

Abstract
Objective
To assess the extent to which the racial/ethnic composition of Medicare Advantage (MA) plans reflects the composition of their areas of operation, given the potential incentives created by the Centers for Medicare & Medicaid Services' Quality Bonus Payments for such plans to avoid enrolling racial/ethnic minority beneficiaries.
Data Sources/Study Setting
2009 Medicare Consumer Assessment of Healthcare Providers and Systems (MCAHPS) survey and administrative data from the Medicare Enrollment Database.
Data Collection/Extraction Methods
We defined each plan's area of operation as all counties in which it had MA enrollees, and we created a matrix of race/ethnicity by plan by county of residence to assess the racial/ethnic distribution of each plan's enrollees in comparison with the racial/ethnic composition of MA beneficiaries in its operational area.
Principal Findings
There is little evidence that health plans are selectively underenrolling blacks, Latinos, or Asians to a substantial degree. A small but potentially important subset of plans disproportionately serves minority beneficiaries.
Conclusions
These findings provide a baseline profile that will enable crucial ongoing monitoring to assess how the implementation of Quality Bonus Payments may affect MA plan coverage of minority populations.
Keywords: Race/ethnicity, Medicare Advantage, public quality reporting
In 2013, Medicare beneficiaries are being offered a choice of more than 2,000 Medicare Advantage (MA) HMO and preferred provider organization (PPO) plans. As of September 2012, 27 percent of beneficiaries were enrolled in such plans, which operate in locally defined areas (Gold et al. 2012) that are proposed by the MA plans and reviewed and approved by the Centers for Medicare & Medicaid Services (CMS). While entire plan service areas are reviewed by CMS to avoid selection for particular demographic groups (2012), this review does not prevent a plan from marketing more heavily in some areas than in others or from designing benefits and/or amenities to differentially attract certain groups of beneficiaries.
Medicare Advantage plans have greater participation among certain racial/ethnic minority groups of beneficiaries, suggesting that certain configurations of these benefits, marketing approaches, and amenities may result in disproportionate minority enrollment (Shimada et al. 2009). Conversely, quality-based incentive payments under initiatives such as the Affordable Care Act's Quality Bonus Payments (United States 2010) have the potential to induce MA plans to avoid enrolling beneficiaries who may be perceived as potentially lowering the plans' overall quality scores. Given the long history of poorer care processes, worse outcomes, and lower patient experience scores among some groups of racial/ethnic minority Medicare beneficiaries (Schneider, Zaslavsky, and Epstein 2002; Virnig et al. 2002; Trivedi et al. 2005, 2011; Elliott et al. 2011; Haviland et al. 2012), such programs could potentially incentivize MA plans to avoid enrolling beneficiaries from minority racial/ethnic groups.
In this article, therefore, we assess the extent to which the racial/ethnic composition of MA plans reflects the composition of the local areas in which CMS has approved their operation. This allows us to understand the extent to which MA plans systematically underrepresent or overrepresent black, Latino, and Asian/Pacific Islander (API) beneficiaries in their local areas.
The Role of Special Needs Plans
Special Needs Plans (SNPs) are a newer group of Medicare managed care plans that are of particular relevance to the issues under consideration here. SNPs were created under the Medicare Modernization Act of 2003 with the goal of improving care coordination for identifiable subgroups of beneficiaries, and their authority was extended first through 2009 under the Medicare Improvements for Patients and Providers Act of 2008 (MIPPA) and subsequently through 2013 under the Affordable Care Act of 2010. A given MA contract may choose to offer SNP and/or non-SNP benefit packages so that a contract may be entirely, partly, or in no part comprised of SNP benefit packages.
SNPs are unique within Medicare as the only type of plan that is permitted to limit services to a subset of the beneficiary population. Because they are targeted to specific subgroups and allow more selection through marketing and beneficiary self-selection, we would expect to see overrepresentation of some types of beneficiaries within SNP benefit packages. Three types of SNPs have been defined, focusing on (1) noninstitutionalized dual-eligible beneficiaries (those eligible for both Medicare and Medicaid); (2) beneficiaries with specified chronic diseases or disabling conditions (such as diabetes, stroke, chronic heart failure, or dementia) (Centers for Medicare & Medicaid Services 2012); and (3) institutionalized beneficiaries. Our analyses include only the first two types of SNPs, as the survey on which our analyses are in part based is not administered to institutionalized beneficiaries.
Dual-eligible SNPs have the potential to concentrate low-income beneficiaries, those in poor health, those with lower educational attainment, and some racial/ethnic minorities, given the composition of the dual-eligible population. Chronic and disabling condition SNPs have the potential to concentrate beneficiaries in poorer health and some racial/ethnic minorities, given the higher incidence of several of the eligible chronic conditions, such as diabetes, in these populations. The effect of Quality Bonus Payments on the incentives for minority enrollment within SNPs may be different than for non-SNPs, however. Higher risk-adjusted payments for beneficiaries in poorer health particularly affect SNPs (Milligan and Woodcock 2008) and may alleviate concerns about whether greater enrollment of less healthy minority beneficiaries would result in lower performance on quality measures and resulting lower Quality Bonus Payments.
As a result, our primary goal in this study is to understand the extent to which MA plans underrepresent or overrepresent minority beneficiaries within their local areas of operation, thus providing evidence of the extent to which marketing and other activities might substantially shape the racial/ethnic composition of plans even within their individually approved areas of operation. We are particularly interested in differences that affect a large proportion of minority beneficiaries. Our secondary goal is to understand the extent to which such underrepresentation or overrepresentation is limited to SNPs, which are allowed to select beneficiaries in poor health and with lower socioeconomic status and which may face somewhat different financial incentives than other MA plans.
Data and Methods
Unit of Analysis
MA contracts are the primary administrative unit for Medicare managed care. A contract consists of one or more benefits packages offered by a single sponsor in a specific geographic area. Because of the potential importance of SNPs in the racial/ethnic distribution of enrollees, we divide each contract into SNP and non-SNP portions by benefit package, assigning beneficiaries according to the type of benefit package in which they are enrolled. For ease of reference, we henceforth use the terms SNP plans and non-SNP plans to refer to all SNP and non-SNP benefit packages within an MA contract, respectively. Each contract may contain either one or two plans as we define them here.
Administrative Data
To obtain information on the characteristics of enrollees in each MA plan and among all MA enrollees in each MA plan's operational area, we relied on two data sources. The Medicare Enrollment Database includes a census of enrollment information for all Medicare beneficiaries (including enrollment in SNP and non-SNP MA plans) and beneficiary residential address, but it does not include beneficiary self-reported race/ethnicity, health, or educational attainment. While the Enrollment Database does contain administrative measures of race/ethnicity, those measures are known to substantially undercount Latinos and Asians (Elliott et al. 2009).
One way to correct these data would be to use a modification of indirect estimation of race/ethnicity, incorporating surname and address information (Elliott et al. 2009); this approach would have been most appropriate if our goal had been to compare quality or performance by race/ethnicity. Here, our primary focus is on the racial/ethnic composition of plans (divided into SNP and non-SNP benefit packages), so we employ an alternative approach. By linking self-reported race/ethnicity data from a large, nationally representative survey of beneficiaries to the Enrollment Database via detailed post stratification on a variety of beneficiary characteristics, it is possible to estimate the distributions of race/ethnicity, self-rated health, and education for each MA plan and for the MA population in each MA plan's operational area. These post-stratification weights account for known patterns of differential survey nonresponse by race/ethnicity (Klein et al. 2011). Because the beneficiaries' residential address is known, we created a three-dimensional matrix of race/ethnicity by plan by county of residence to serve as the basis of our analyses. The Appendix includes detailed information on this matrix and its use in our analyses.
Survey Data
We use data from the 2009 Medicare Consumer Assessment of Healthcare Providers and Systems (MCAHPS) survey in combination with administrative data from the Medicare Enrollment Database. The MCAHPS is a mail survey with telephone follow-up based on a stratified random sample of Medicare beneficiaries, with contracts serving as strata for MA beneficiaries (Heller et al. 2009; Martino et al. 2009). The 2009 MCAHPS survey attempted to contact 672,919 Medicare beneficiaries and received responses from 415,902 (61.8 percent response rate). The survey includes responses from 245,262 MA beneficiaries from the 449 MA contracts with more than 300 enrollees; we exclude 101 PPO contracts with relatively small survey sample sizes that would limit the accuracy of our analysis for those contracts. Our analysis of the composition of beneficiaries is limited to the remaining 348 non-PPO MA contracts (n = 201,079), excluding three SNP plans that each have a single beneficiary in the sample and missing data for key variables. These 348 contracts include 199 SNP and 305 non-SNP plans, which we will collectively refer to as 504 plans throughout the remainder of this article. To determine beneficiary composition in the plans' areas of operation, we include all non-PPO MA beneficiaries.
Our analysis employs self-reported race/ethnicity, health status, and educational level from the MCAHPS survey. Other variables were derived from Medicare administrative files.
Race/Ethnicity
MCAHPS asks beneficiaries two separate questions related to race (white, black or African American, Asian, Native Hawaiian or other Pacific Islander [NHOPI], and American Indian or Alaska Native [AI/AN]) and to Hispanic/Latino origin. We classify as Latino all individuals responding affirmatively to the Hispanic/Latino origin question, regardless of race. If the respondent was not Latino and endorsed exactly one race OR endorsed Asian or NHOPI and no other race, we classify as AI/AN, black, API, or white, accordingly. If the respondent endorsed two or more races (except Asian and Pacific Islander), we classify as multiracial. Individuals missing race/ethnicity were classified as unknown. Thus, we have seven mutually exclusive race/ethnicity categories, of which we analyze six: Latino, black, API, AI/AN, multiracial, and white beneficiaries.
Post-Stratification Approach
Responses to the MCAHPS survey, linked to the Enrollment Database, were post-stratified to represent all MA beneficiaries. Data were weighted to represent the MA population within each county and MA contract, followed by applying a ranking procedure employing loglinear weights by iterative proportional fitting (Deming and Stephan 1940; Purcell and Kish 1980) to align weighted sample distributions within each plan to those in administrative data (on gender, age, race/ethnicity, Medicaid status, eligibility for Medicare's low-income supplement to assist with premium payments, SNP status, and enrollment in a Part D prescription drug plan) and zip-code level distributions of income, education, and race/ethnicity.
Construction of the Race/Ethnicity by Plan by County of Residence Matrix
The distributions of race/ethnicity, health status, and educational level of the enrollees of each SNP and non-SNP plan are summarized and compared to the distributions of all MA-enrolled beneficiaries in each plan's operational area, using weights to provide county-level matching. Each plan's area of operation was defined as the set of all counties in which the plan had enrollees responding to the MCAHPS survey. To calculate the distributions of interest within a plan's operational area, the distributions of MA-enrolled beneficiaries in each county were pooled across the operational area using weights that correspond to the proportion of plan enrollees who reside in each county within the operational area. For some plans (n = 104), usually small SNPs (n = 89), small sample sizes (fewer than 100 MCAHPS survey responses, selected to ensure a standard error ≤5 percent for plan estimates of actual enrollment) resulted in measures of that plan's racial/ethnic distribution that were insufficiently precise for plan-level inference (flagged in our results as poor-precision plans). Thus, greater weight was given to the counties in which the plan was most active. Additional details of this approach are available in the Appendix.
Metric
We compare plans' concentration of racial/ethnic minority beneficiaries against the MA beneficiaries in the areas in which they operate, overall and stratified by SNP status. Because our interest in differences that affect large numbers of minority beneficiaries, plans are classified as underrepresenting minority beneficiaries by more than 25 percentage points as compared to the operational area, underrepresenting by 10–25 percentage points, representing within 10 percentage points of the area's level of concentration, overrepresenting by 10–25 percentage points, and overrepresenting by more than 25 percentage points. This approach is particularly suited to detecting discrepancies in operational areas with a large proportion of minorities.
Results
Table 1 shows the characteristics of MA beneficiaries overall and by SNP status. More than two thirds of MA enrollees are white; approximately 7.8 percent are black, 10.9 percent are Latino, and 2.5 percent are Asian. This distribution is fairly similar to that for all Medicare beneficiaries (data not shown), although MA enrollees are more likely to be Latino than Medicare beneficiaries in general (10.9 percent vs. 6.6 percent, respectively), in keeping with prior findings regarding this population (Keenan et al. 2009; Shimada et al. 2009). In addition, a substantially higher proportion of MA beneficiaries who are enrolled in SNPs come from racial/ethnic minority groups. More than one third of SNP enrollees (35.7 percent) are Latino, compared with 8.1 percent of non-SNP enrollees, and blacks comprise nearly twice the proportion of the population among SNP enrollees (13.4 percent) as among non-SNP enrollees (7.2 percent).
Table 1.
Characteristics of Medicare Advantage Beneficiaries (2009)*
|
Medicare Advantage Enrollees† |
|||
|---|---|---|---|
| All | Special Needs Plans Only | Non-Special Needs Plans Only | |
| Sample size | n = 201,079 | n = 34,814 | n = 166,265 |
| Population size | N = 8,443,090 | N = 876,061 | N = 7,567,029 |
| Characteristic | % | % | % |
| Race/ethnicity | |||
| White | 67.7 | 35.2 | 71.3 |
| Black | 7.8 | 13.4 | 7.2 |
| Latino | 10.9 | 35.7 | 8.1 |
| Asian/Pacific Islander | 2.5 | 3.7 | 2.4 |
| Other or multiracial | 1.8 | 2.4 | 1.8 |
| Unknown | 9.3 | 9.5 | 9.3 |
| Educational attainment | |||
| Less than high school | 24.0 | 48.3 | 21.3 |
| High school graduate or more | 76.0 | 51.7 | 78.7 |
| Health status | |||
| Fair/poor health | 27.1 | 47.6 | 24.8 |
| Good, very good, or excellent health | 72.9 | 52.4 | 75.2 |
| Gender | |||
| Male | 41.5 | 36.1 | 42.1 |
| Female | 58.5 | 63.9 | 57.9 |
| Age | |||
| 18–64 | 8.9 | 23.3 | 7.3 |
| 65–79 | 66.8 | 56.9 | 67.9 |
| 80+ | 24.3 | 19.9 | 24.8 |
| Census division of residence | |||
| New England | 3.8 | 1.8 | 4.0 |
| Middle Atlantic | 17.1 | 17.1 | 17.1 |
| East North Central | 13.3 | 2.6 | 14.5 |
| West North Central | 5.9 | 4.6 | 6.0 |
| South Atlantic | 15.1 | 8.8 | 15.8 |
| East South Central | 4.7 | 6.6 | 4.5 |
| West South Central | 7.3 | 6.3 | 7.4 |
| Mountain | 8.2 | 6.9 | 8.3 |
| Pacific | 21.2 | 22.1 | 21.1 |
| Puerto Rico | 3.5 | 23.2 | 1.3 |
Percentages are weighted to represent all Medicare Advantage beneficiaries.
Excluding PPOs.
SNP enrollees differ from non-SNP MA beneficiaries in other important ways as well. SNP enrollees are more likely to have less than a high school education (48.3 percent vs. 21.3 percent), to be in fair or poor health (47.6 percent vs. 24.8 percent), to be female (63.9 percent vs. 57.9 percent), and to be aged 18–64 and hence legally disabled (23.3 percent vs. 7.3 percent); they are less likely to live in the East North Central and South Atlantic regions and are more likely to live in Puerto Rico.
Table 2 compares plans' concentration of racial/ethnic minority beneficiaries against the areas in which they operate, overall and stratified by SNP status. Excluding the 104 poor-precision plans, 110 SNPs and 290 non-SNP plans remain and are classified as underrepresenting minority beneficiaries by more than 25 percentage points as compared to the operational area, underrepresenting by 10–25 percentage points, representing within 10 percentage points of the area's level of concentration, overrepresenting by 10–25 percentage points, and overrepresenting by more than 25 percentage points. Operational areas are classified as having low (less than 10 percent), moderate (10–50 percent), or high (greater than 50 percent) concentrations of beneficiaries in each racial/ethnic group. We focus our discussion primarily on differences that exceed 25 percentage points.
Table 2.
Medicare Advantage Plan Concentration of Minority Beneficiaries by Concentration in Their Operational Areas*
|
Plan Concentration of Minority Beneficiaries by Percentage Point Difference from Operational Area: Number of Plans and Percent of Plans |
||||||
|---|---|---|---|---|---|---|
|
Underrepresented by |
Overrepresented by |
|||||
| >25 Points | 10–25 Points | Proportional Representation within 10 Points | 10–25 Points | >25 Points | ||
| Special needs plans (n = 110) | ||||||
| Concentration of Hispanics in plan operational area | ||||||
| Less than 10% (n = 56) | N/A† | N/A | 49 (88%) | 4 (7%) | 3 (5%) | |
| 10%–50% (n = 43) | 0 | 0 | 11 (26%) | 21 (49%) | 11 (26%) | |
| Greater than 50% (n = 11) | 0 | 0 | 9 (82%) | 2 (18%) | 0 | |
| Concentration of blacks in plan operational area | ||||||
| Less than 10% (n = 65) | N/A | N/A | 60 (92%) | 5 (8%) | 0 | |
| 10%–50% (n = 41) | 0 | 3 (7%) | 11 (27%) | 20 (49%) | 7 (17%) | |
| Greater than 50% (n = 4) | 0 | 0 | 0 | 4 (100%) | 0 | |
| Concentration of Asian/Pacific Islanders in Plan Operational Area | ||||||
| Less than 10% (n = 107) | N/A | N/A | 102 (95%) | 3 (3%) | 2 (2%) | |
| 10%–50% (n = 2) | 0 | 0 | 0 | 1 (50%) | 1 (50%) | |
| Greater than 50% (n = 1) | 0 | 0 | 1 (100%) | 0 | 0 | |
| Non-special needs plans (n = 290) | ||||||
| Concentration of Hispanics in plan operational area | ||||||
| Less than 10% (n = 205) | N/A | N/A | 204 (99%) | 1 (<1%) | 0 | |
| 10%–50% (n = 68) | 0 | 7 (10%) | 51 (75%) | 6 (9%) | 4 (6%) | |
| Greater than 50% (n = 17) | 1 (6%) | 2 (12%) | 11 (65%) | 1 (6%) | 2 (12%) | |
| Concentration of blacks in plan operational area | ||||||
| Less than 10% (n = 180) | N/A | N/A | 179 (99%) | 0 | 1 (<1%) | |
| 10%–50% (n = 110) | 0 | 8 (7%) | 77 (70%) | 21 (19%) | 4 (4%) | |
| Greater than 50% (n = 0) | 0 | 0 | 0 | 0 | 0 | |
| Concentration of Asian/Pacific Islanders in plan operational area | ||||||
| Less than 10% (n = 286) | N/A | N/A | 284 (99%) | 0 | 2 (1%) | |
| 10–50% (n = 1) | 0 | 0 | 0 | 0 | 1 (100%) | |
| Greater than 50% (n = 3) | 0 | 1 (33%) | 2 (67%) | 0 | 0 | |
Excluding PPOs and poor-precision plans.
Not applicable.
After excluding poor-precision plans, we find that only one plan underrepresents minority beneficiaries relative to its operational area by 25 percentage points or more. This plan is not a SNP, has fewer than 800 enrollees total, and underrepresents Latino beneficiaries (45 percent) in a majority Latino operational area (72 percent of the operational area population is Latino); it also overrepresents whites, who make up 51 percent of the plan's enrollees and only 27 percent of its operational area. In an additional 21 instances among 19 plans, minority beneficiaries are underrepresented to a lesser extent, between 10 and 25 percentage points relative to the plans' operational areas. These plans include only 3 SNPs, all of which underrepresent black beneficiaries; the 18 non-SNP plans in this range underrepresent a combination of black and Latino beneficiaries.
Although only a small number of plans disproportionately overenroll members of one or more minority racial/ethnic groups relative to their presence in the plan's operational area, plans are more likely to overenroll than to underenroll minorities, with 38 plans exceeding their operational area proportion by 25 percentage points or more. Latino, black, and API populations are substantially overenrolled in 20, 12, and 6 plans, respectively. SNP plans substantially concentrate MA beneficiaries in each racial/ethnic group more often than non-SNP plans, with 24 of the 110 SNP plans (22 percent) but only 14 of the 290 non-SNP plans (5 percent) concentrating minority beneficiaries by 25 percentage points or more above the beneficiary population in their operational area (p < .001). Furthermore, in 89 instances among 71 plans, minority beneficiaries are overrepresented to a more moderate extent, between 10 and 25 percentage points relative to plans' operational areas.
The majority of plans that overrepresent Latino and black beneficiaries are those in areas with moderate concentrations of Latinos and blacks (10–50 percent), regardless of SNP status. In contrast, the majority of plans overrepresenting Asians and Pacific Islanders are located in areas with low concentrations of such beneficiaries (<10 percent); this pattern reflects the lower prevalence of Asians and Pacific Islanders than blacks and Hispanics in the overall MA beneficiary population.
Figures 1 and 2 display the relationship between the proportion of each plan's enrollees with a given characteristic and the proportion of MA beneficiaries in the plan's operational area with the same characteristic. The area of each circle is proportionate to the size of plan enrollment. Plans for which the center of the circle is within the dark gray shaded area are those for which the proportion of the plan's enrollees is within 10 percentage points of the overall average for the MA population in its operational area; the lighter gray shading represents a 25 percentage point band. Each figure shows SNP and non-SNP plans separately. Poor-precision plans are marked on the graph by the symbol “X,” again size proportional.
Figure 1.
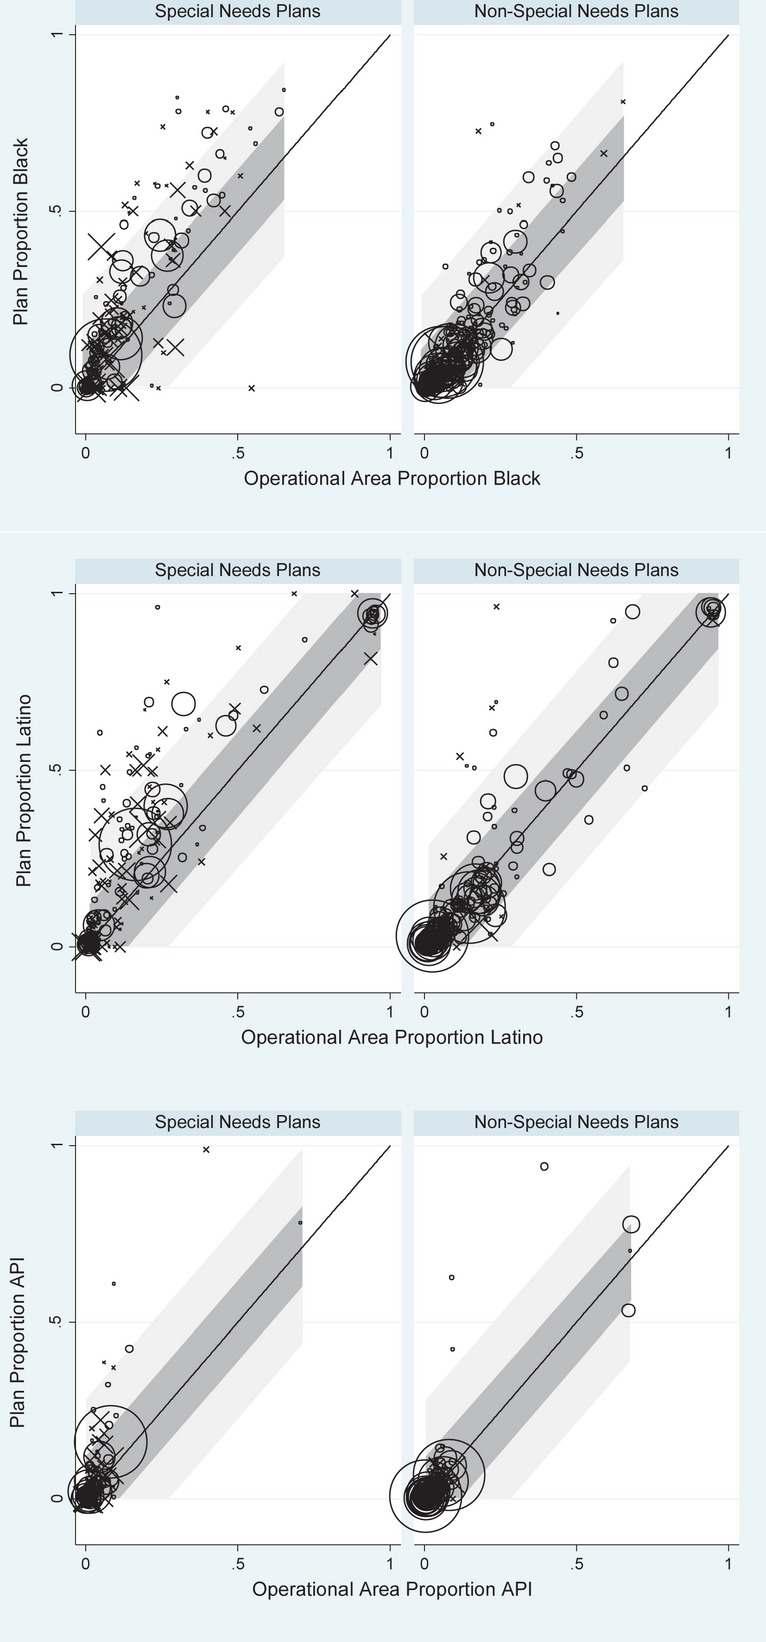
Proportion of Plan Enrollees from Given Racial/Ethnic Group Compared with Group Representation in Plan Operational Area
Figure 2.
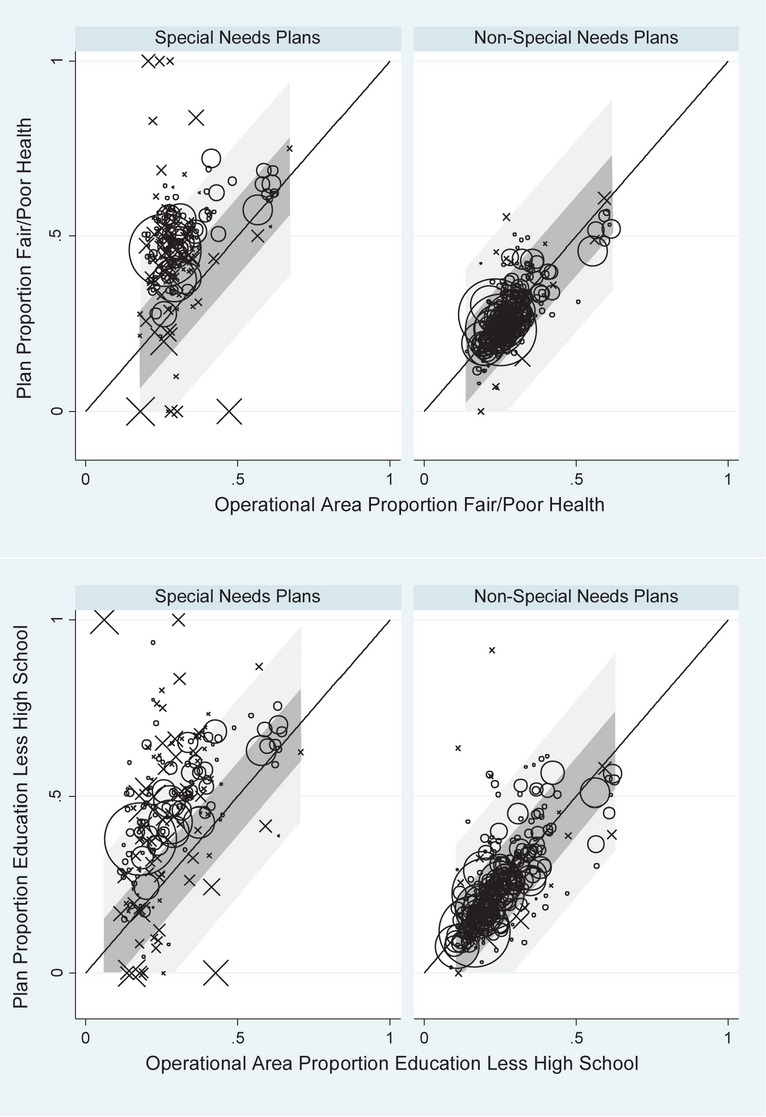
Proportion of Plan Enrollees in Fair/Poor Health or with Less Than a High School Education Compared with Group Representation in Plan Operational Area Note. Size of circles is proportionate to size of plan enrollment. The symbol X is used to mark those SNP or non-SNP plans with fewer than 100 survey responses. Plans in shaded area have enrollment from given racial/ethnic group within 10 percentage points (dark shade) and 25 percentage points (light shade) of the overall average for their operational areas.
In Figure 1, we show the relationship between plans' enrolled populations and the populations in their operational areas for black, Latino, and Asian beneficiaries. For each of these groups, we find that the vast majority of MA plans have enrollments that are reasonably proportionate to the racial/ethnic composition of their operational areas (with correlations of between .80 and .92, not shown), graphically depicting what we present in Table 2.
Figure 2 includes similar information for beneficiaries in fair or poor health and those with less than a high school education. Given the focus of SNP plans on dual-eligible enrollees (those with lower incomes, a characteristic often correlated with poorer health status) and those with chronic illnesses, it is not surprising that SNPs tend to concentrate enrollment of MA beneficiaries in fair or poor health relative to their operational areas. Excluding poor-precision plans, there are no plans that underrepresent those in fair or poor health by more than 25 percentage points, while eight plans (all of which are non-SNPs) underrepresent this group by 10–25 percentage points.
For beneficiaries with lower educational levels, we observe a similar pattern, with both SNP and non-SNP plans concentrating these beneficiaries to some extent, but with greater overrepresentation of such enrollees occurring in SNPs. A single plan underrepresents those with low education by more than 25 percentage points, with 30 percent of plan enrollees having less than a high school education compared with 57 percent of MA beneficiaries in the plan's operational area. This is the same plan described above that also underrepresents Latino beneficiaries. Underrepresentation of MA beneficiaries with low levels of education by 10–25 percentage points is more common, with 2 SNP and 20 non-SNP plans doing so.
It is possible that any observed disproportionate enrollment by race/ethnicity is entirely an indirect consequence of permissible selection on the basis of health status and/or SES, particularly for SNPs. We therefore performed sensitivity tests to assess the extent to which disproportionate enrollment of a racial/ethnic group by SNP or non-SNP plans could be accounted for by racial/ethnic differences in educational attainment and health status. These analyses first used weighting to match each plan's operational area to the plan's enrollees with respect to four categories defined by combinations of fair or poor heath versus better health and no high school degree versus at least a high school degree (see Appendix for details). The resulting adjusted racial/ethnic distributions in each operational area (adjusted to match the health and SES distribution in each plan) were then compared to the observed racial/ethnic distributions in each SNP and non-SNP MA plan (data not shown). The correlations between the operational area proportions of each racial/ethnic group after this adjustment with the unadjusted operational area proportions are .98–.99, suggesting that disproportionate enrollment by race/ethnicity is not likely solely a result of disproportionate enrollment of beneficiaries with worse health status or low educational attainment.
Discussion
With the exception of a single plan, our analyses show no evidence that MA plans underenroll racial/ethnic minority groups by more than 25 percentage points relative to their presence among MA beneficiaries in plans' local operational areas, and we find few instances of underenrollment by 10–25 percentage points. The one exception, not a SNP plan, is fairly small and underrepresents Latinos in an operational area that has a majority Latino population. Similarly, we find few instances of substantial underrepresentation of beneficiaries with poor health status or low educational attainment. Instead, we generally see a pattern of slight underrepresentation of minority beneficiaries across many plans and corresponding overrepresentation in a few plans.
Thus, in all other cases where plan enrollment differs substantially from operational area composition, plans overrepresent a particular racial/ethnic minority group. This small number of plans (n = 38) has minority group enrollment that is more than 25 percentage points above their representation in the plans' operational areas. The vast majority of these plans are SNPs, which by definition will enroll low-income beneficiaries or those who have chronic or disabling conditions. Higher risk-adjusted payments for beneficiaries in poorer health particularly affect SNPs (Milligan and Woodcock 2008) and thus may alleviate plan concerns about whether greater enrollment of less healthy minority beneficiaries would result in lower performance on quality measures and resulting lower Quality Bonus Payments.
Due to the higher prevalence of low income and some chronic conditions in some racial/ethnic minority groups, a reasonable hypothesis would be that a higher concentration of some racial/ethnic groups within SNP plans is entirely or primarily a side effect of CMS allowing such plans to select beneficiaries based on Medicaid eligibility or chronic condition diagnoses. However, we find that the overrepresentation of racial/ethnic minorities in these SNP plans changes little after further adjusting for educational attainment and self-reported health status. While adjustment for specific diagnoses and other factors not available for these analyses might have had a somewhat greater effect, our results suggest that plans may have additional features that increase enrollment by specific racial/ethnic groups beyond what might be expected from qualifying conditions and Medicaid status alone. Some non-SNP plans also concentrate minority beneficiaries (Zaslavsky et al. 2000), though not as often as SNP plans. The existence of plans that overenroll minority beneficiaries relative to their operational areas, combined with the lower quality typically experienced by minority patients, might suggest the need to consider case mix adjustment of technical quality scores either by race/ethnicity or by proxies such as socioeconomic status and/or language preference.
Our analysis has several limitations. First, there are minor limitations in our ability to measure differences in race/ethnicity between plans and their areas of operation. Our analyses exclude smaller MA plans, including PPOs, and do not examine the extent to which minorities may disproportionately enroll in MA plans relative to fee-for-service Medicare, as such analyses have been previously described in other studies (Shimada et al. 2009). In addition, we note that because the plan operational area measures we use are weighted based on county-level plan enrollment, we do not address any concentration of beneficiaries that occurs through a plan's greater overall presence in one county rather than another within its local operational area. As such, we may have understated plan underenrollment or overenrollment relative to their operational areas. Our operational areas are very similar to the contract service areas defined by CMS as the areas in which the contract is approved to operate; they will differ only to the extent that a county within a contract service area does not have any enrollees or any enrollees responding to the Medicare CAHPS survey. In addition, mailing addresses used in CAHPS surveys may differ in some cases from residential addresses. Nevertheless, our results should provide an accurate measurement of patterns of enrollment relative to the population of corresponding areas for the vast majority of the MA population.
Second, our approach is best suited to detect large departures in minority enrollment from what would be expected in the operational area (e.g., 25 percent vs. 45 percent) and thus focuses on differences in areas of high minority enrollment that would affect large numbers of minority beneficiaries. It is less sensitive for detecting instances of strong selection in terms of ratios in areas of low minority enrollment (e.g., 1 percent vs. 5 percent) that effect fewer total minority beneficiaries.
Third and more notably, we have no specific information regarding how the plans that concentrate individual beneficiaries with certain characteristics came to do so, other than the legal criteria for enrollment in SNPs. We do not know, for example, the extent to which these plans specifically sought to attract certain segments of the market by offering particular services (e.g., linguistically targeted services) or via outreach and marketing activities targeted to members of particular racial/ethnic groups. We are also currently unable to assess the role that premium prices play in disproportionate enrollment by socioeconomic status (directly) and race/ethnicity (indirectly, as members of some racial/ethnic minority groups are disproportionately likely to have low socioeconomic status). Finally, other research that is currently under way will examine a crucial question not addressed here—the extent to which plans that disproportionately serve members of certain racial/ethnic minority groups may provide either better or worse quality of care and plan experiences to these beneficiaries than plans that do not concentrate in this way.
Our analyses suggest that, prior to the implementation of Quality Bonus Payments under the Affordable Care Act, there is little evidence that health plans are selectively underenrolling blacks, Latinos, or Asians to a substantial degree. Indeed, a small but potentially important subset of plans—SNPs in particular—disproportionately serve minority beneficiaries. These findings provide a baseline profile that will enable crucial ongoing monitoring to assess the implementation of the Quality Bonus Payments—that is, the extent to which implementation creates unintended consequences by incentivizing plans to seek out those beneficiaries whom they may perceive as most desirable from a quality scoring perspective.
MIPPA mandates a new effort to measure and report quality measures by race and ethnicity, including data on health care disparities for Medicare beneficiaries covered under both managed care plans and fee-for-service Medicare. (Martino et al. 2013). What MIPPA will not track, however, is enrollment in MA plans by members of different racial/ethnic minority groups. Our results show that there is little cause so far for worry that MA plans are systematically avoiding enrolling members of racial/ethnic minority groups, clearing the way for MIPPA to focus on potential disparities within plans rather than disparities in enrollment.
Acknowledgments
Joint Acknowledgment/Disclosure Statement: CMS Contract number: HHSM-500-2005-00028I.
Disclosures: None.
Disclaimers: None.
SUPPORTING INFORMATION
Additional supporting information may be found in the online version of this article
Author Matrix.
Construction of the Race/Ethnicity Distribution for Each Plan and Its Operational Area.
References
- Centers for Medicare & Medicaid Services. 2012. “CMS.gov/Medicare” [accessed on November 12, 2012]. Available at http://www.cms.gov/Medicare/Medicare.Html. [PubMed]
- Centers for Medicare & Medicaid Services. 2012. “Special Needs Plans: Overview” [accessed on August 24, 2011]. Available at http://www.cms.gov/specialneedsplans/01_overview.asp? [PubMed]
- Deming WE, Stephan FF. “On a Least Squares Adjustment of a Sampled Frequency Table When the Expected Marginal Totals Are Known”. Annals of Mathematical Statistics. 1940;11(4):427–44. [Google Scholar]
- Elliott MN, Morrison PA, Fremont A, McCaffrey DF, Pantoja P, Lurie N. “Using the Census Bureau's Surname List to Improve Estimates of Race/Ethnicity and Associated Disparities”. Health Services and Outcomes Research Methodology. 2009;9(2):69–83. [Google Scholar]
- Elliott MN, Haviland AM, Orr N, Hambarsoomian K, Cleary PD. “How Do the Experiences of Medicare Beneficiary Subgroups Differ between Managed Care and Original Medicare? ”Health Services Research. 2011;46(4):1039–58. doi: 10.1111/j.1475-6773.2011.01245.x. [DOI] [PMC free article] [PubMed] [Google Scholar]
- Gold M, Jacobson G, Damico A, Neuman T. 2012. “Medicare Advantage 2013 Data Spotlight: Plan Availability and Premiums” [accessed on April 2, 2013]. Available at http://www.kff.org/medicare/8388.cfm.
- Haviland AM, Elliott MN, Weech-Maldonado R, Hambarsoomian K, Orr N, Hays RD. “Racial/Ethnic Disparities in Medicare Part D Experiences”. Medical Care. 2012;50(suppl):S40–7. doi: 10.1097/MLR.0b013e3182610aa5. [DOI] [PMC free article] [PubMed] [Google Scholar]
- Heller A, Elliott MN, Haviland AM, Klein DJ, Kanouse DE. “Patient Activation Status as a Predictor of Patient Experience among Medicare Beneficiaries”. Medical Care. 2009;47(8):850–7. doi: 10.1097/MLR.0b013e318197b661. [DOI] [PubMed] [Google Scholar]
- H.R. 3590. 111th Congress: Patient Protection and Affordable Care Act; 2009. [Google Scholar]
- Keenan PS, Elliott MN, Cleary PD, Zaslavsky AM, Landon BE. “Quality Assessments by Sick and Healthy Beneficiaries in Traditional Medicare and Medicare Managed Care”. Medical Care. 2009;47(8):882–8. doi: 10.1097/MLR.0b013e3181a39415. [DOI] [PubMed] [Google Scholar]
- Klein DJ, Elliott MN, Haviland AM, Saliba D, Burkhart Q, Edwards C, Zaslavsky AM. “Understanding Nonresponse to the 2007 Medicare CAHPS Survey”. Gerontologist. 2011;51(6):843–55. doi: 10.1093/geront/gnr046. [DOI] [PubMed] [Google Scholar]
- Martino SC, Elliott MN, Cleary PD, Kanouse DE, Brown JA, Spritzer KL, Heller A, Hays RD. “Psychometric Properties of an Instrument to Assess Medicare Beneficiaries' Prescription Drug Plan Experiences”. Health Care Financing and Review. 2009;30(3):41–53. [PMC free article] [PubMed] [Google Scholar]
- Martino SC, Weinick RM, Kanouse DE, Brown JA, Haviland AM, Goldstein E, Adams JL, Hambarsoomian K, Klein DJ, Elliott MN. “Reporting CAHPS and HEDIS Data by Race/Ethnicity for Medicare Beneficiaries”. Health Services Research. 2013;48(2):417–34. doi: 10.1111/j.1475-6773.2012.01452.x. [DOI] [PMC free article] [PubMed] [Google Scholar]
- Milligan C, Woodcock C. Medicare Advantage Special Needs Plans for Dual Eligibles: A Primer. New York: Commonwealth Fund; 2008. [PubMed] [Google Scholar]
- Purcell NJ, Kish L. “Postcensal Estimates for Local Areas (or Domains)”. International Statistical Review. 1980;48(1):3–18. [Google Scholar]
- Schneider EC, Zaslavsky AM, Epstein AM. “Racial Disparities in the Quality of Care for Enrollees in Medicare Managed Care”. Journal of the American Medical Association. 2002;287(10):1288–94. doi: 10.1001/jama.287.10.1288. [DOI] [PubMed] [Google Scholar]
- Shimada SL, Zaslavsky AM, Zaborski LB, O'Malley AJ, Heller A, Cleary PD. “Market and Beneficiary Characteristics Associated with Enrollment in Medicare Managed Care Plans and Fee-For-Service”. Medical Care. 2009;47(5):517–23. doi: 10.1097/MLR.0b013e318195f86e. [DOI] [PubMed] [Google Scholar]
- Trivedi AN, Zaslavsky AM, Schneider EC, Ayanian JZ. “Trends in the Quality of Care and Racial Disparities in Medicare Managed Care”. New England Journal of Medicine. 2005;353(7):692–700. doi: 10.1056/NEJMsa051207. [DOI] [PubMed] [Google Scholar]
- Trivedi AN, Grebla RC, Wright SM, Washington DL. “Despite Improved Quality of Care in the Veterans Affairs Health System, Racial Disparity Persists for Important Clinical Outcomes”. Health Affairs. 2011;30(4):707–15. doi: 10.1377/hlthaff.2011.0074. [DOI] [PubMed] [Google Scholar]
- Virnig BA, Lurie N, Huang Z, Musgrave D, McBean AM, Dowd B. “Racial Variation in Quality of Care among Medicare+Choice Enrollees”. Health Affairs. 2002;21(6):224–30. doi: 10.1377/hlthaff.21.6.224. [DOI] [PubMed] [Google Scholar]
- Zaslavsky AM, Hochheimer JN, Schneider EC, Cleary PD, Seidman JJ, McGlynn EA, Thompson JW, Sennett C, Epstein AM. “Impact of Sociodemographic Case Mix on the HEDIS Measures of Health Plan Quality”. Medical Care. 2000;38(10):981–92. doi: 10.1097/00005650-200010000-00002. [DOI] [PubMed] [Google Scholar]
Associated Data
This section collects any data citations, data availability statements, or supplementary materials included in this article.
Supplementary Materials
Author Matrix.
Construction of the Race/Ethnicity Distribution for Each Plan and Its Operational Area.