Abstract
Noninvasive magnetic resonance spectroscopy (MRS) with chemical shift imaging (CSI) provides valuable metabolic information for research and clinical studies, but is often limited by long scan times. Recently, spectroscopy with linear algebraic modeling (SLAM) was shown to provide compartment-averaged spectra resolved in one spatial dimension with many-fold reductions in scan-time. This was achieved using a small subset of the CSI phase-encoding steps from central image k-space that maximized the signal-to-noise ratio. Here, SLAM is extended to two- and three-dimensions (2D, 3D). In addition, SLAM is combined with sensitivity-encoded (SENSE) parallel imaging techniques, enabling the replacement of even more CSI phase-encoding steps to further accelerate scan-speed. A modified SLAM reconstruction algorithm is introduced that significantly reduces the effects of signal nonuniformity within compartments. Finally, main-field inhomogeneity corrections are provided, analogous to CSI. These methods are all tested on brain proton MRS data from a total of 24 patients with brain tumors, and in a human cardiac phosphorus 3D SLAM study at 3T. Acceleration factors of up to 120-fold versus CSI are demonstrated, including speed-up factors of 5-fold relative to already-accelerated SENSE CSI. Brain metabolites are quantified in SLAM and SENSE SLAM spectra and found to be indistinguishable from CSI measures from the same compartments. The modified reconstruction algorithm demonstrated immunity to maladjusted segmentation and errors from signal heterogeneity in brain data. In conclusion, SLAM demonstrates the potential to supplant CSI in studies requiring compartment-average spectra or large volume coverage, by dramatically reducing scan-time while providing essentially the same quantitative results.
Keywords: localized spectroscopy, chemical shift imaging (CSI), SLAM, brain, cancer, heart
1. Introduction
Spatially localized magnetic resonance spectroscopy (MRS) has provided valuable insight into many normal and diseased human conditions[1–11]. Compared to single voxel MRS techniques, such as PRESS[12], STEAM[13] and ISIS[14], the standard multi-voxel chemical shift imaging (CSI) method[15] has the advantages of accessing multiple regions simultaneously with higher signal-to-noise ratio (SNR) per unit scan-time. However, the clinical application of CSI is limited by the long scan time required to apply a complete set of phase-encoded acquisitions before the individual voxel spectra can be reconstructed. In addition, due to the way that SNR adds in magnetic resonance imaging (MRI) and MRS, SNR lost by setting the voxel size smaller than needed during acquisition, cannot be entirely restored post-acquisition[16, 17].
Many methods have been proposed to speed-up CSI acquisitions. These include methods that combine spectral and spatial encoding[18, 19]; and those that actually reduce the amount of image k-space sampled by gradient-encoding[17, 20–33]. In general, the latter fall into three categories: (a) methods employing parallel imaging[20–23]; (b) those incorporating prior knowledge based on scout MRI[17, 24–29]; and (c) those using compressed sensing and sparse reconstruction[30–33]. Of these, only Category (a) methods are currently in widespread use in clinical MRI/MRS scanners. Of Category (b), SLIM[24], GSLIM[25] and SLOOP[26] are strictly speaking, non-CSI methods that in theory offer superior resolution to CSI by eliminating Fourier bleeding. Indeed, this has been the focus of their in vivo applications to date, which have been limited to retroactively acquired CSI data[34–39]. Thus, although SLIM and SLOOP could provide faster scanning than CSI[24, 26, 29], to our knowledge no speed advantage has been demonstrated proactively in vivo or in humans. Category (c) methods are relatively new, and have seen even less use, perhaps reflecting the low SNR of most non-hyperpolarized MRS applications, which is not ideal for compressed sensing.
Recently, we introduced another Category (b) MRS localization method, “spectroscopy with linear algebraic modeling” or SLAM[17], wherein compartmental-average spectra are acquired using a greatly reduced CSI phase-encoding gradient set selected from central k-space where SNR is highest. The spectra are reconstructed from C compartments segmented from scout MRI, which are incorporated into the standard CSI model using an auxiliary “b” matrix[17]. SLAM was demonstrated on both retroactively and proactively acquired one-dimensional (1D) phosphorus (31P) human cardiac CSI data, yielding either a 4 to 8-fold acceleration in scan-time with the same quantitative results, or a ∼40% SNR improvement for the same scan-time, as compared to our standard protocol[2, 4, 5].
In the present work, SLAM is extended to two- (2D) and three dimensions (3D), and in addition, combined with parallel imaging techniques, specifically SENSE[20], to achieve dramatic speedup factors of 5–120 compared to CSI and SENSE CSI[21]. A modified SLAM reconstruction algorithm is introduced that improves accuracy by reducing the method’s sensitivity to signal inhomogeneity within compartments. Additional improvements are provided to incorporate spatial and temporal main (B0) and RF (B1) field inhomogeneity terms, including eddy-current correction. These advances are implemented on 2D and multi-slice proton (1H) MRS studies of the brains of healthy subjects and patients with tumors, both retroactively and proactively. Brain compartmental average metabolite levels and ratios from CSI and SENSE CSI are determined and quantitatively compared with those from corresponding high-speed SLAM spectra. Finally, 3D SLAM is applied to 31P MRS in a phantom and in human heart, with speedup factors of 100 and 7, respectively.
2. Theory
The conventional CSI[15] reconstruction can be cast as a linear equation:
| (1) |
where s is the known vectorized signal matrix, PE is the phase-encoding operator, and ρ is the unknown vectorized spectral matrix. For 1D CSI, PE is simply a discrete Fourier transform (DFT) operator. For 2D or 3D CSI, PE is the Kronecker product[40] of double or triple serial DFT operators, respectively. M is the total number of phase-encoding steps or spatial voxels, and N is the number of chemical shift domain data points.
When sensitivity encoding[20, 21, 41] is used, Eq. (1) is rewritten as:
| (2) |
where E is the combined phase-encoding and sensitivity-encoding operator, and M’ denotes the product of the number of coil elements, Nc, and the (reduced) number of phase-encoding steps, MR (=M/R, where R as the SENSE acceleration factor). While defined in Ref. [41], E can be constructed by stacking the product of PE with the sensitivity encoding matrix, SE, of each coil element, as
| (3) |
where 1, 2, …, Nc index each coil element. Furthermore, as described in Ref. [41] for SNR optimization, “pre-whitening” can be done to both sides of Eq. (2) by multiplying (L−1 ⊗I)M'*M', where LNc*Ncis obtained from a Cholesky decomposition of the noise covariance matrix[41]; IMR*MR is an identity matrix; and ⊗ is the Kronecker operator[40].
2.1. SLAM localization with prior knowledge
For simplicity, Eq. (2) is used throughout to represent both conventional CSI and the pre-whitened SENSE CSI reconstruction, the latter differentiated by the “SENSE” label. Introducing an auxiliary matrix, b, containing the spatial information defining the C compartments segmented from MRI, results in:
| (4) |
As described in Ref. [17], b is composed by adding “−1” elements into C columns of an identity matrix. Note that the first dimension of the ρ matrix carries ordered spatial information for all of the voxels. Accordingly, the location of each of the C columns corresponds to the first voxel of each of the C compartments. The “−1” elements are located in each of the C columns after the first voxel, and correspond to all the rest of the voxels in each compartment. These elements are used to eliminate hypothetically identical rows in the ρ matrix in accordance with the compartment model[17].
Assuming that the individual CSI spectra in each of the C compartments are identical, dimensional reduction[17] of Eq. (4) then leads to:
| (5) |
where is obtained from retaining the C non-eliminated rows in ρM*N, which correspond to the spectra of the C first voxels in the C compartments, respectively. is obtained by retaining the C columns in corresponding to the C non-eliminated rows.
2.2. Algorithms for SLAM and SENSE SLAM reconstruction
Two algorithms are used to reconstruct SLAM or SENSE SLAM spectra. The first is the same one described in Ref. [17]:
| (6) |
where “+” denotes the Moore-Penrose pseudo-inverse when M’ > C, or the inverse when M’ =C. The second, slightly different, algorithm is denoted with asterisks as SLAM* or SENSE SLAM*
| (7) |
Both algorithms require that M’ ≥C, which is easily fulfilled in practice, e.g. C =3 for cardiac spectroscopy[17], or C =4 or 5 for SLAM MRS of brain, as exemplified later. With conventional (Eq. 6) SLAM, M’ ≤M always, and typically M’ <<M, which means that (EM'*M)+ is generally under-determined. Conversely, for SENSE SLAM* (Eq. 7), M’ =NcM/R could easily exceed M making (EM'*M)+ over-determined (eg, with a combination of an Nc =32 element coil and an acceleration factor R = 16). In any case, numeric regularization is recommended, especially where SENSE reconstruction is involved and SNR is low. Here, a truncated singular value decomposition (TSVD)[42] method is utilized wherein values below, for example 2% of the maximum, are discarded to ensure that the condition number[43] is not greater than 50. In practice, the level of numeric regularization may be optimized for non-ideal/low SNR data, by increasing the level of numeric regularization until the results become stable.
2.3. The discrete spatial response function
The continuous spatial response function (SRF) has been used to analyze image-based spectroscopic localization methods[17, 35]. While this assumes that the continuously distributed spectra from the subject are “ground truth”, the spatially continuous spectra are generally unknown for anything other than test phantoms. Here instead, and analogous to the fractional SLAM leakage/error minimization approach used in Ref. [17], a discrete form of the SRF (dSRF) is used which treats the spatially discrete CSI spectra as ground truth. The CSI spectra are measurable in practice, and CSI’s widespread use for multi-voxel MRS renders it a standard whose compartmental average SRF can reasonably approximate the various compartments, albeit dependent on spatial resolution. The dSRF is especially suited for analysis of the SLAM reconstruction because prior knowledge is incorporated into its under-sampled CSI model. Note that unlike the continuous SRF, the dSRF is only defined at the discrete CSI sample points. Also note that a discrete point spread function was used in a similar way to characterize under-sampling interference between Fourier voxels in sparse MRI[32].
For (SENSE) SLAM,
| (8) |
and for (SENSE) SLAM*,
| (9) |
The calculation of contributions from any specific spatial region, to the reconstructed (SENSE) SLAM spectrum from these dSRFs is shown in Appendix A.
2.4. Incorporating spatial and temporal inhomogeneity
In practice, the reconstructed CSI and SENSE CSI spectra are often further corrected for spatial and temporal B0 and B1 field inhomogeneities, for example, due to the use of surface coils[35] and/or gradient eddy currents that induce spatially- and/or time-dependent phase variations[44]. These can be accommodated by modifying Eq. (4) to incorporate a diagonal matrix A comprised of the spatially-dependent terms:
| (10) |
The diagonal elements in A are correction factors, such as reciprocals of the receiver coil sensitivity profile, or conjugates of the phase variation at each voxel. The reconstruction for (SENSE) SLAM and (SENSE) SLAM* are, respectively:
| (11) |
| (12) |
If temporal correction terms involving time-varying phases are required[44], the reconstruction in Eqs. (10–12) must be repeated at each time point. The 1H brain MRS examples shown later utilize both spatial and temporal eddy current corrections[44, 45]. Note that such corrections can alter the dSRF, especially when A varies abruptly. Appendix B lists the dSRF formulae with A included.
2.5. Summary of (SENSE) SLAM implementation
The proactive SLAM and SENSE SLAM experimental protocols are as follows:
Acquire a scout MRI;
Apply a subset-of M’ ≥C phase-encoding gradients selected from the central k-space of a regular (SENSE) CSI sequence (or an alternative user-defined subset–see Ref. [17]), and acquire the MRS data;
Register the regular (SENSE) CSI grid onto the corresponding MRI;
Segment the (SENSE) CSI voxels into the C desired anatomical compartments based on the MRI;
Reconstruct the compartmental spectra using (SENSE) SLAM or the modified (SENSE) SLAM* algorithms (Eqs. 6, 7).
For retroactive validation, (SENSE) SLAM is simply applied to the central k-space signals of previously acquired (SENSE) CSI data in Step (ii), and the resulting compartmental average spectra compared to those obtained by co-adding CSI spectra from the constituent voxels in the identical compartments. Acceleration factors (the value of M’) were chosen by empirical testing of (SENSE) SLAM/SLAM* on conventional (SENSE) CSI data sets, to achieve acceptable agreement for the intended application. Expressions for the relative SNR of compartmental average (SENSE) CSI, (SENSE) SLAM and SLAM* spectra are presented in Appendix C.
3. Methods
All phantom and human studies were performed on a 3T Philips Achieva MRI/MRS system. All human studies were performed on consenting participants using protocols approved by our Institutional Review Board. Reconstruction was performed off-line on a personal laptop computer (quad-core, 1.87 GHz) using software developed in Matlab (Mathworks, Natick, MA). (SENSE) CSI, (SENSE) SLAM and SLAM* spectra are displayed as true compartmental averages, normalized to account for differences in compartmental volume, and without time-domain filtering, unless otherwise stated. Vertical scaling is the same for each subject, independent of method, but may vary between subjects depending on receiver gain. Compartments in the brain were segmented on CSI grids to include any voxel with a volume that intersected a region-of-interest on the corresponding 1H image by 50% or more.
3.1 31P MRS studies of phantoms
31P MRS studies were performed with a single loop 14-cm 31P transmit/receive surface coil, with two disk phantoms filled with 300mM H3PO4 and H3PO2 placed on top in skewed orientations. After multi-slice gradient refocused echo (GRE) scout 1H MRI, a 3D 31P CSI[15] sequence was applied with adiabatic-half-passage (AHP) excitation (repetition time, TR=717 ms; field-of-view, FOV, X=Z=160 mm, Y=100 mm with X, Y, and Z as the horizontal, vertical, and longitudinal FOV extents in the magnet bore; spatial resolution per voxel, ∆X=∆Z=16 mm, ∆Y=5 mm; number of phase-encoding steps, PE=10×10×20=2000; total scan time =23.9 min). Proactive 3D SLAM was then performed with all parameters the same, except that only the 2×2×5=20 central-most k-space PEs were applied, reducing the scan time to 15.8 s (including two startup cycles). The CSI grid was co-registered with the scout MRI, three compartments segmented, and proactive SLAM spectra reconstructed. These were compared with the co-added, compartmental average CSI spectra from the constituent voxels in the identical compartments, as noted above.
3.2 Proactive 1H MRS brain studies in healthy subjects
In vivo studies of the human brain in healthy volunteers first utilized a commercial 8-channel receive-only head coil operating in quadrature mode to avoid the complications of SENSE reconstruction. Scout MRI was provided by a spin-lattice relaxation (T1)-weighted 3D turbo-GRE sequence (flip-angle FA =80; echo-time TE=3.2 ms; TR=6.9 ms; FOV, Y=256 mm, X=228 mm, Z=156 mm; resolution ∆X=∆Y=1 mm, ∆Z=1.2 mm; total scan time =4.5 min). A spin-echo single-slice 2D 1H CSI sequence[11, 46, 47] was then applied (TR=2 s; TE=144 ms; FA=900; FOV, Y=200 mm, X=180 mm; slice thickness, SL=∆Z=15 mm; resolution ∆X=∆Y=10 mm; number of PEs =360; scan-time =12 min) with eight outer volume saturation (OVS) slabs[46] angled around the head to suppress the lipid signal from the scalp, along with a “VAPOR”[48] pre-pulse for water suppression. This was followed by a 2D SLAM sequence with identical parameters except that the number of PEs were reduced to 49 from central-most k-space, reducing the scan-time to 1.7 min (including two startup cycles). The CSI and MRI grids were co-registered and C=4 compartments segmented to: a small user-defined region in the brain; the ‘rest of the brain’; the scalp; and a background compartment. Compartmental average CSI spectra were computed for these four compartments for comparison with SLAM. SLAM was also implemented using just the central 25 of the 49 PEs, for an effective acceleration factor of R=14.
3.3 Retroactive 1H MRS brain studies in cancer patients
MRI and 1H CSI MRS data were obtained from 16 consecutively recruited patients enrolled in an ongoing clinical research study, who had brain tumors with discernible choline (Cho), total creatine (CR, unphosphorylated creatine, Cr, plus phosphocreatine, PCr) or N-acetylaspartate (NAA). These data were acquired with a commercial 32-element SENSE head coil. The acquisition protocol involved: (a) a SENSE coil-sensitivity reference scan; (b) a multi-slice FLAIR[49, 50] sequence (TE=120 ms; TR=11 s; Inversion recovery delay, TI=2.8 s; FOV, Y=212 mm, X=189 mm, Z =132 mm; resolution, ∆Y=0.83 mm, ∆X=1.04 mm; ∆Z=2.2 mm; duration=3.85 min); and (c) a three-slice SENSE-accelerated 2D spin-echo 1H CSI sequence (vertical and horizontal acceleration factors RY=3, RX=2; TR=2.5 s; TE=144 ms; FA=900; FOV, Y=230 mm, X=188 mm, SL =∆Z=13.2 mm; slice gap SG=4.4 mm; ∆X=∆Y=7 mm)[11, 21, 46, 47]. The SENSE acceleration reduced the number of phase encodes from 891 (=33×27) to 154 (=11×14). This was further reduced to 120 by omitting the corners of k-space. Eight lipid-suppression OVS slabs and dual-band water-lipid-suppression (HGDB) pre-pulses were used[51]. (d) An additional set of 27 CSI PEs were acquired without HGDB pulses to provide eddy-current compensation[44]. The total scan-time for (c) and (d) was 6.2 min. Eddy-current-corrected CSI spectra were reconstructed using the scanner’s default settings.
Because the raw k-space data were not saved for these studies, retroactive SLAM and SLAM* reconstruction were performed using 1/6th of the k-space data obtained by inverse Fourier transforming the eddy-current-corrected CSI spectra. Five compartments were assigned for SLAM and SLAM*. These were: tumor; contralateral brain (since clinical MRS assessment is routinely based on differences between a suspected pathology and its contralateral region); ‘rest of the brain’ compartment excluding the tumor and the contralateral compartments; scalp; and background. Magnitudes of peaks in SLAM, SLAM* and the compartmental average CSI spectra, were least-squares fitted to Gaussian models in the frequency domain using software written in Matlab, and Cho, CR and NAA peak areas calculated. The results were compared with the compartmental average CSI spectra obtained by co-adding the CSI spectra from constituent voxels in the identical compartments.
3.4 SENSE and proactive 1H MRS brain studies
A further set of 8 in vivo brain tumor studies were acquired with the identical CSI protocol except that the raw k-space data was separately saved. As in the scanner’s default reconstruction, the 120 water-suppressed SENSE CSI signals (SENSE factors RY=3, RX=2) with the corners of k-space omitted, were zero-filled back to the 11×14=154 rectangular array. SENSE SLAM and SENSE SLAM* analysis was performed using the 25 central k-space PEs, and, as an extreme example, using only 1 PE (zero gradient, but 32 channel acquisition) to provide effective speed-up factors of 5 and 120, respectively. The 11×14 SENSE CSI k-space acquisition scheme with the corners omitted, and the k-space sampling for SENSE SLAM* with a further 5-fold and 120-fold acceleration factors are illustrated in Fig. 1.
Figure 1.
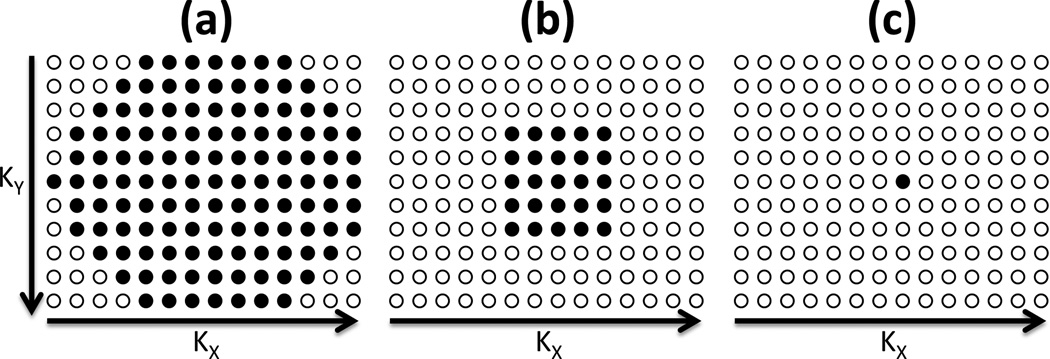
The k-space acquisition schemes for: (a) 11×14 SENSE CSI with corners omitted (120 steps); and SENSE SLAM/SLAM* acquisitions with further (b) 5-fold (25 steps total) and (c) 120-fold (1-step) acceleration factors, respectively. For simplicity, the 6-fold k-space undersampling afforded by SENSE, is omitted. Each filled circle denotes a k-space sample in the kY (or Y) and kx (or X) directions.
In the last 5 of these patients, a proactive three-slice 2D SENSE SLAM sequence was also implemented using 25 PEs for a total scan-time of 1.1 min, including two startup cycles but no additional eddy-current acquisition. Excluding the latter, this corresponded to R=5 compared to the SENSE CSI protocol above. SENSE SLAM spectra were compared to compartmental average SENSE CSI spectra both without and with eddy current corrections. For eddy current compensation, the 27 non-water-suppressed PEs from the CSI eddy-current acquisition were reconstructed by SENSE CSI zero-filled to 154, from which the spatial and time-dependent phases were estimated and interpolated across the sample volume[44] after correcting for phase jumps[45]. The same spatial phases were then used for correcting SENSE CSI, SLAM and SLAM* spectra.
Finally, a five-slice 2D SENSE SLAM sequence was implemented pro-actively by extending TR to 3.4 s (duration =1.5 min including two startup cycles) to provide whole brain coverage while maintaining all other parameters the same.
3.5 In vivo 3D 31P human heart MRS
In vivo cardiac 31P MRS studies were performed on healthy volunteers oriented prone on a 17cm/11cm diameter dual loop transmit and 8cm single loop receive coil[52]. Turbo-GRE scout 1H MRI was performed (FA=300; TR=4.3 ms; TE=2.1 ms; FOV, Z=450 mm, X=450 mm, Y=160 mm; resolution ∆Z=2.34 mm, ∆X=4.69 mm, ∆Y=5 mm), followed by a cardiac-gated pulse-and-acquire 3D 31P CSI sequence (AHP excitation; TR=2 s; FOV Z=160 mm, X=180 mm, Y=160 mm; resolution ∆Z=∆X=20 mm, ∆Y=10 mm; PEs =1152; duration =38.7 min including 8 startup cycles). Three compartments–chest, heart and background–were segmented from the co-registered images. SLAM spectra were reconstructed and compared to the compartmental average CSI spectra.
3.6 Effect of compartmental misregistration and sample heterogeneity
To investigate the robustness of the SENSE SLAM* and SENSE SLAM reconstruction to mis-registration and signal heterogeneity, the segmented compartment maps from 8 different MRS studies with 5 segmented compartments, were superimposed on a 9th data set, resulting in gross misplacement of compartments relative to the anatomy. The resultant SENSE SLAM* and SENSE SLAM spectra from the mis-registered compartments that contain mixtures of various involved and uninvolved tissues, were compared with the average SENSE CSI spectra from same compartments.
3.7 Localization analysis
To evaluate differences in the dSRF of (SENSE) SLAM and (SENSE) SLAM*, a quantitative analysis was performed with 5 segmented compartments in a 1H MRS data set acquired from a patient with a brain tumor, in accordance with Appendix A. For the dSRF computation and analysis, the acceleration factor of SENSE SLAM and SENSE SLAM* was 6 times faster than SENSE CSI (25 phase encodes vs. 154 phase encodes) without omitting the corners of k-space. To compare SLAM and SLAM* two acceleration factors, R=6 and 36 vs. CSI, were chosen.
To quantify the potential contamination of the tumor dSRF from extra-compartmental signals, the integral of both the dSRF and its modulus, |dSRF| were calculated by summation over each of the five segmented compartments for: (i) SENSE SLAM*, (ii) SENSE SLAM, (iii) SLAM*, and (iv) SLAM*, both without (TSVD threshold =0%) and with numeric regularization at a 2% TSVD threshold. Note that while the summed dSRF benefits from the cancellation effects of an oscillating spatial response[17], the summed |dSRF| represents a worst possible scenario with no cancellation whatsoever, requiring both positive and negative MRS signals having the same sign as the dSRF. Because numeric regularization has a broadening effect on the dSRF, we also computed the integrated dSRF and |dSRF| over a region expanded by ∼20% in each direction about the tumor compartment, effectively making it 40% larger, analogous to the effect of a cosine-apodized point spread function[53].
Finally we compute the dSRF for a brain compartment in the extreme case of the 120-fold accelerated SENSE SLAM* spectrum acquired with only a single phase-encode.
4. Results
4.1 31P MRS studies of phantoms
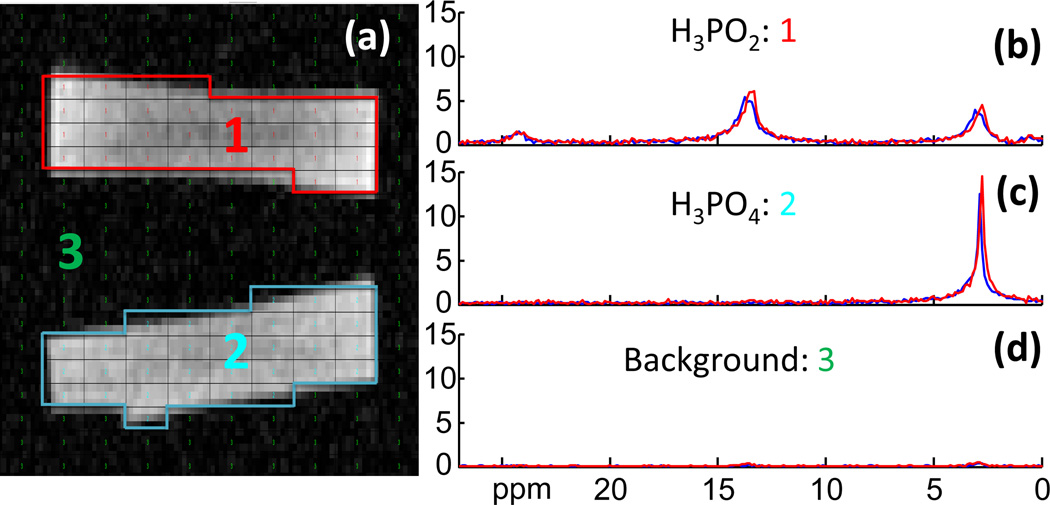
Figure 2 shows the segmentation on a scout MRI of the disk phantom, and spectra representing the compartmental average 3D CSI and 3D SLAM reconstructions. Minimal difference is observed between the proactively acquired SLAM (red) and CSI spectra (blue), despite the fact that the SLAM spectra was acquired 100 times faster than the CSI spectra, excluding the 2 startup cycles. The H3PO4 phantom has a singlet at 2.9 ppm and the H3PO2 phantom has three peaks at 2.9 ppm, 13.5 ppm and 24.1 ppm. No spatial leakage from the 13.5 ppm and 24.1 ppm peaks of the H3PO2 phantom spectrum (Fig. 2b), into the H3PO4 spectrum (Fig. 2c) is discernible in either CSI or SLAM spectra, and spatial leakage into background (Fig. 2d) is also negligible.
Figure 2.
Comparison of 3D proactive 31P SLAM spectra in a phantom. (a) Segmentation based on a co-registered phantom image. The CSI voxels are segmented into three compartments: 1, H3PO2; 2, H3PO4; 3, background. (b–d) Red SLAM spectra reconstructed from 20 phase encodes compared to the blue CSI compartmental average spectra reconstructed from 2000 phase encodes. The SLAM acceleration factor is R=100.
4.2 Proactive 1H MRS brain studies in healthy subjects
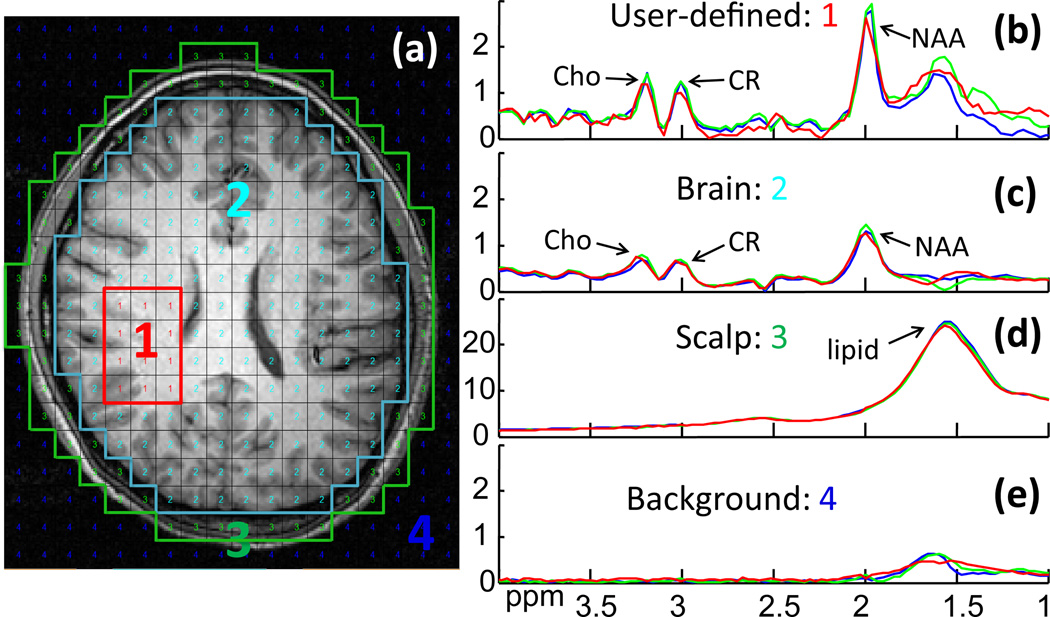
Figure 3 compares both proactive and retroactive implementation of 2D SLAM with 2D CSI in a normal brain. The user-defined region inside the brain (Fig. 3a) was chosen to mimic a potentially “abnormal” compartment. Both retroactive (green) and proactive SLAM spectra (red) agree with the CSI spectrum from the compartment (blue), and are essentially coincident in the brain and scalp compartments (Fig. 3c,d). Here, SLAM is 14 times faster than CSI. The proactive SLAM spectrum from the “abnormal” compartment (Fig. 3b) differs slightly more from the CSI spectrum than the retroactive SLAM spectrum, likely reflecting scan-to-scan variations including SNR effects, fat/water suppression and/or physiologic motion.
Figure 3.
Retroactive and proactive SLAM in normal brain. (a) MRI of normal brain, overlaid with the CSI grid and segmented into four compartments post MRS acquisition: (1) user-defined area; (2) ‘rest of the brain’; (3) scalp; and (4) background. (b–d) 2D CSI (blue) and 2D SLAM spectra (red and green) acquired from the four compartments. The red SLAM spectra were acquired in a proactive scan using data 14 times faster than CSI. The green SLAM spectra were reconstructed retroactively from a subset of 1/14th of the CSI data.
Reconstruction time (solving Eq. 6 or 7) for matrix sizes up to 800×5 was ≤2min on the laptop computer for all studies.
4.3 Retroactive 1H MRS brain studies in cancer patients
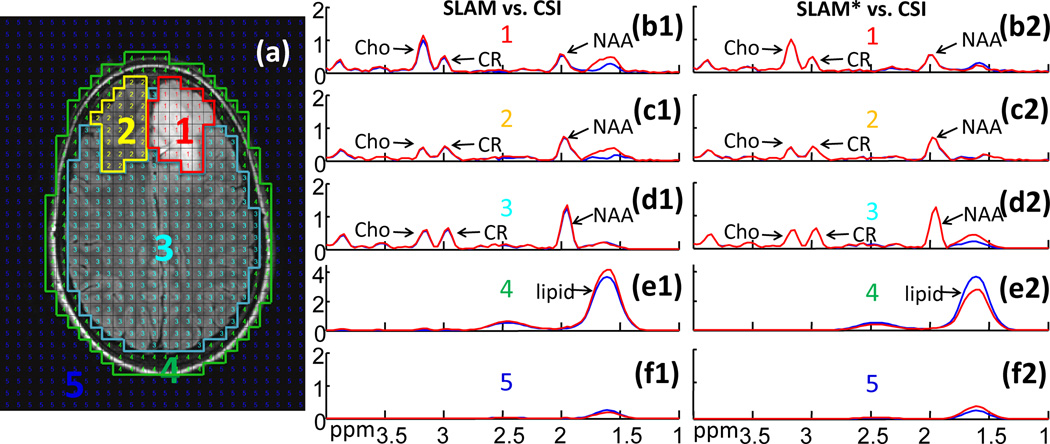
Figure 4 is an example of retroactive implementation of SLAM (spectra b1–f1) and SLAM* (spectra b2–f2) in a patient with a low-grade astrocytoma (Fig. 4a). The CSI spectra were generated from 33×27 PEs while SLAM used only 1/6th (=13×11) of them. Both SLAM and SLAM* spectra (red) basically coincide with the compartment average CSI spectra (blue) over nearly the entire spectral range. SLAM* is slightly more consistent with CSI than SLAM in this example (eg, Cho in b1 vs. b2, and NAA in d1 vs. d2). Importantly, the high Cho/CR peak area ratio in the tumor compartment is faithfully preserved by SLAM and SLAM* (spectra b1, b2), while the contralateral compartment does not show high Cho/CR (spectra c1, c2). Elevated Cho levels are common in tumors[9], and the Cho/CR ratio may be useful for grading them[54].
Figure 4.
Comparison of SLAM and SLAM* brain spectra with CSI. (a) Image with co-registered CSI grid and segmented into five compartments: (1) tumor (low-grade astrocytoma); (2) contralateral brain; (3) ‘rest of the brain’; (4) scalp; and (5) background. Spectra (b1–f2) show the CSI spectra (blue) from the corresponding compartments, along with SLAM (b1–f1) and SLAM* (b2–f2) spectra (red) reconstructed from 1/6th the CSI data for an acceleration factor R=6.
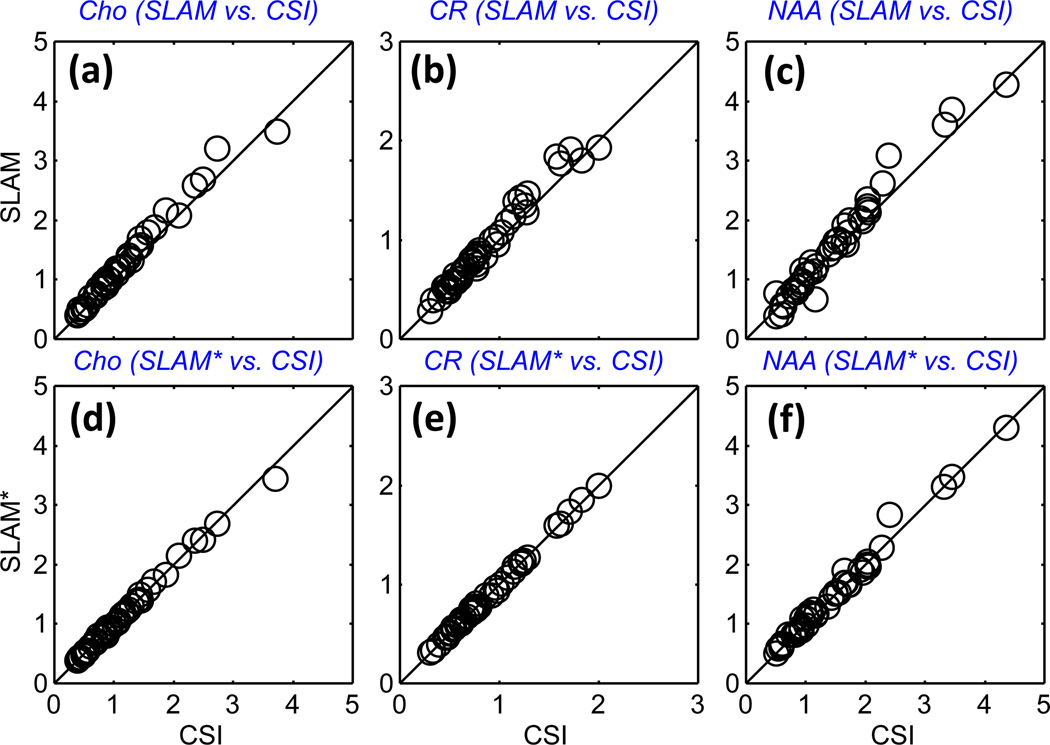
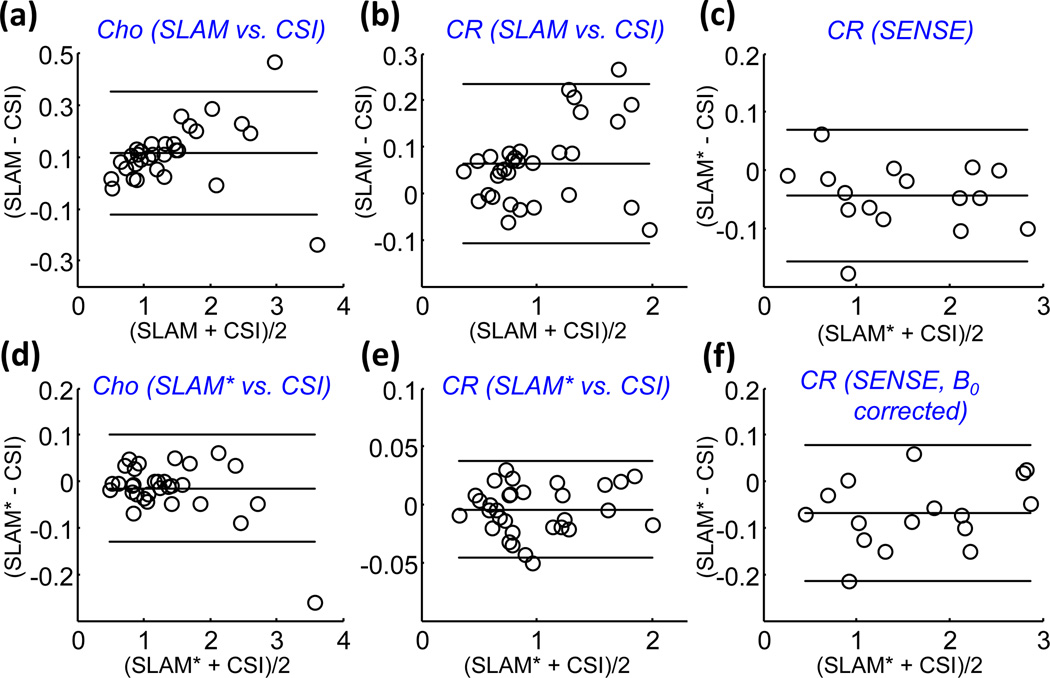
Figure 5 shows the Cho, CR, and NAA levels quantified from CSI, SLAM and SLAM* spectra, reconstructed retroactively from tumor compartments in the 16 patient data sets. For the tumor, contralateral brain, and ‘rest of the brain’ compartments, both SLAM and SLAM* are quantitatively consistent with CSI, while the SLAM* reconstruction shows slightly less deviation than SLAM. The same consistency of results compared to CSI was observed for the Cho/Cr metabolite ratios (not shown), and Bland-Altman analysis for Cho, CR (Fig. 6) and NAA from the tumor and contralateral brain compartments did not reveal any significant systematic effects. The standard deviation (SD) of the ratio of SLAM to CSI levels of NAA, Cho and CR, were respectively 15%, 5.9% and 6.7%, as compared to 6.2%, 2.8% and 2.1% for SLAM*, reflecting perhaps the greater lipid contamination of NAA in the SLAM spectra.
Figure 5.
Quantitative comparison of SLAM and SLAM* with CSI data from the 16 patients. Cho, CR, and NAA levels (arbitrary units) as quantified in SLAM (a–c), and in SLAM* (d–f) spectra in tumor, contralateral brain and ‘rest of the brain’ compartments, as a function of those levels measured in the CSI spectra from the same compartments. The SLAM and SLAM* spectra were reconstructed from 1/6 of the 2D CSI data for an effective R=6. The correlation coefficients are R ≥ 0.98 for all cases.
Figure 6.
Bland-Altman plots for Cho (a, c) and CR (b, e) measured by SLAM (a, b) and SLAM* (d,e), as compared to CSI. Parts (c) and (e) show Bland-Altman plots for CR measured by SENSE SLAM* as compared to SENSE CSI, without (c), and with (f) B0 corrections.
4.4 SENSE and proactive 1H MRS brain studies
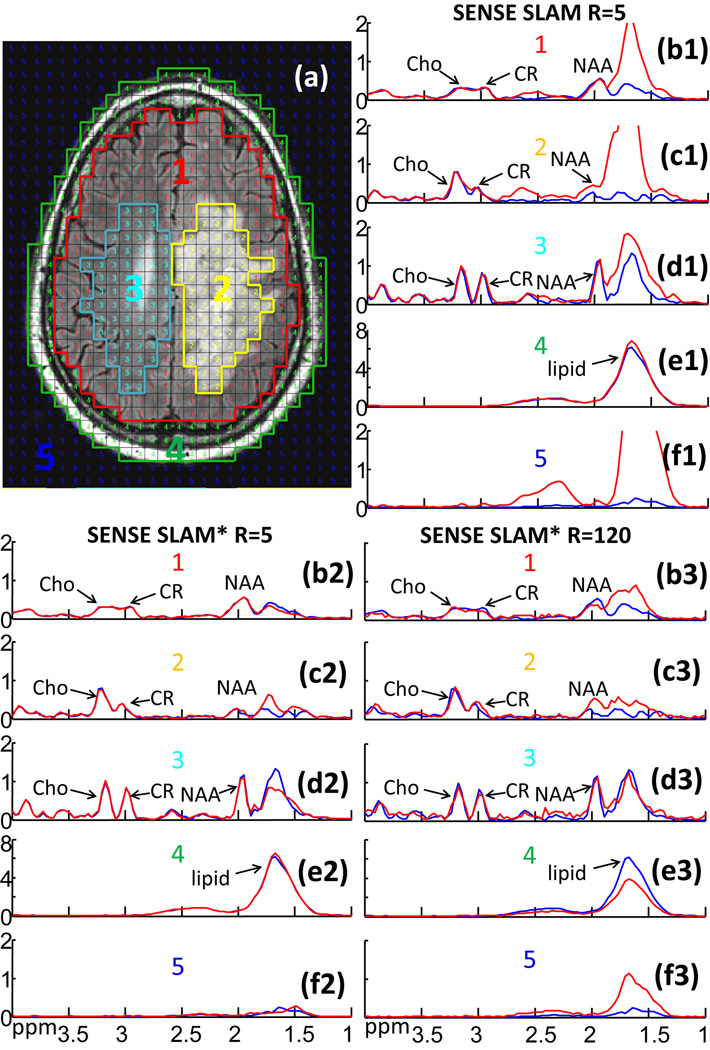
Figure 7 demonstrates SENSE SLAM implementation on a patient with a large glioblastoma whose raw k-space data had been saved. Here the SENSE SLAM and SENSE SLAM* spectra (red) are effectively 5 times (spectra b1–f1 and b2–f2) and 120 times faster (spectra b3–f3) than the SENSE CSI data (blue), respectively. With SENSE, the modified SLAM* algorithm (spectra b2–f2) consistently outperforms the original SLAM algorithm (spectra b1–f1), in the ∼1.7 ppm lipid region where strong, broad, lipid peaks tend to corrupt the NAA peaks. The SENSE SLAM* spectra (b2–d2) are relatively unaffected by the lipid peaks. Substantially less spatial leakage is also evident in the background compartment of SENSE SLAM* compared to SENSE SLAM (spectra f2 vs. f1). In the extreme case where only the central zero-gradient PE step was used and spatial-encoding depends entirely on SENSE, SENSE SLAM* produces surprisingly good spectra (spectra b3-f3), while the earlier SLAM algorithm performed poorly (not shown). Based on Appendix C, for the tumor compartment (c3), SENSE SLAM* maintains 23% of the SNR of SENSE CSI. After correcting for the over two-orders-of-magnitude difference in acquisition time, the SNR per unit volume per unit time for SENSE SLAM* is about 3 times higher than SENSE CSI. Importantly again, the high Cho/CR characteristic of the tumor is preserved in both SLAM* and SLAM tumor spectra (spectra c1, c2, c3).
Figure 7.
2D retroactive SENSE SLAM and SENSE SLAM* results. (a) MRI showing segmentation of five compartments: (1) ‘rest of the brain’; (2) tumor (a glioblastoma); (3) contralateral brain; (4) scalp; and (5) background. Spectra (b1–f3) are from the corresponding compartments with SENSE CSI spectra in blue for comparison. SENSE SLAM spectra (b1–f1) and SENSE SLAM* spectra (b2–f2) in red, were reconstructed with 1/5th of the SENSE CSI data, for an acceleration factor R=5. Spectra (b3-f3) were reconstructed with R=120 using SENSE SLAM*.
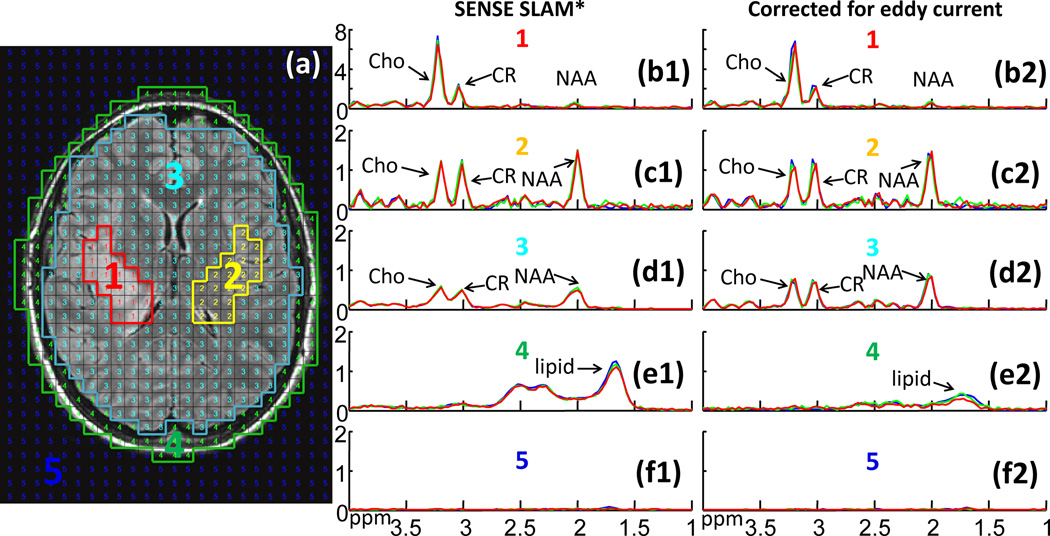
Figure 8 shows retroactive (green) and proactive (red) SENSE SLAM*, and SENSE CSI results (blue), without (spectra b1–f1) and with (spectra b2–f2) corrections for eddy-current induced time-varying spatial phases. Without eddy-current correction, the SENSE SLAM* used 25 PEs, while SENSE CSI used 120 phase encodes. All three methods used the same eddy-current CSI-based eddy-current acquisition to estimate the time/space-varying phase. A high level of coincidence is evident among the three sets of spectra. Eddy current correction noticeably improves spectral resolution (spectra d2 vs. d1) while reducing lipid contamination (spectra e2 vs. e1).
Figure 8.
SENSE CSI and SLAM* spectra without and with eddy current corrections. (a) MRI depicting segmentation: (1) brain tumor; (2) contralateral brain; (3) ‘rest of the brain’; (4) scalp; and (5) background. Spectra (b1–f2) are from the corresponding compartments without (b1–f1) and with (b2–f2) eddy current correction. Blue spectra are SENSE CSI. The SENSE SLAM* spectra are reconstructed from 1/5th of the CSI data set (green), or proactively in a separate scan with R=5 (red).
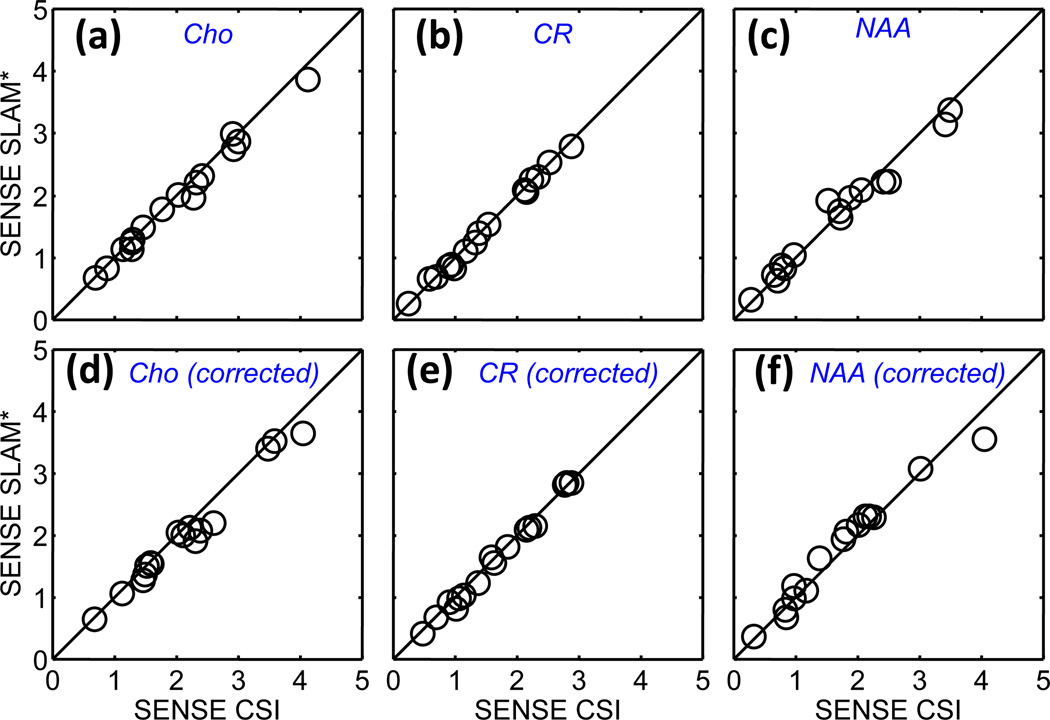
Figure 9 shows quantitative Cho, CR and NAA levels for SENSE CSI and SENSE SLAM* without and with eddy-current correction for tumor and contralateral brain compartments in the 8 patients. SENSE SLAM* reliably generates quantitatively indistinguishable results as SENSE CSI both without and with (b, d) eddy current correction, 5 times faster. Similar results were found for measurements of metabolite ratios derived from tumor and contra-lateral compartments (not shown), and Bland-Altman analysis for CR, Cho, and NAA measurements with SENSE did not reveal any significant systematic effects (Fig. 6c,f shows results for CR only).
Figure 9.
Quantitative comparison of SENSE SLAM* measures of Cho, CR, and NAA levels (arbitrary units) in tumor and contralateral brain with SENSE CSI measures from the same compartments, without (a–c) and with (d–f) eddy current corrections. The SENSE SLAM* spectra were reconstructed with 1/5th of the CSI data for R = 5. Correlation coefficients are R ≥ 0.98 for all cases.
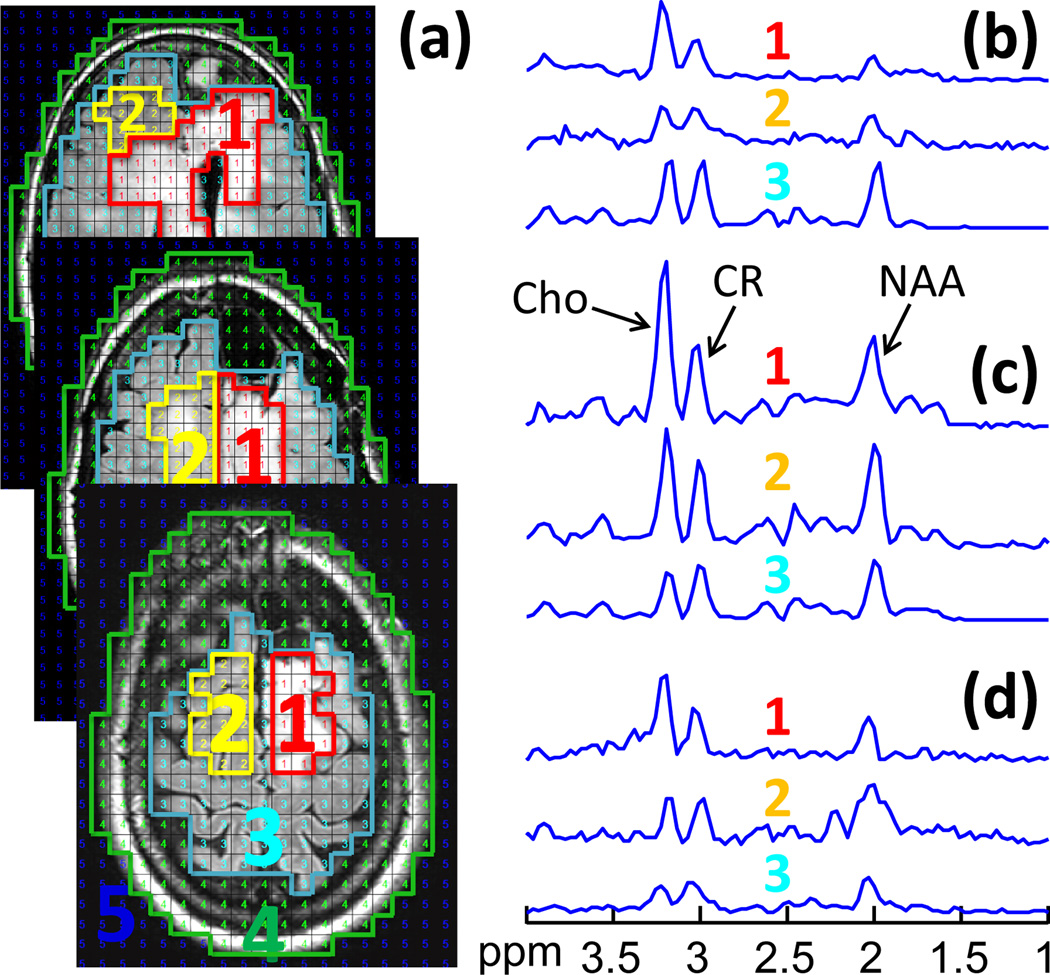
Figure 10 demonstrates the feasibility of providing essentially whole-brain coverage for brain tumor patients using proactive SENSE SLAM* in ∼1.5 min. In this case, the tumor was too large to permit coverage by the regular SENSE CSI protocol and a whole-brain SENSE CSI acquisition was precluded by scan-time, so no CSI data were available for comparison. Elevated Cho/CR is evident in the tumor compartment in the three adjacent slices (Fig. 10b–d).
Figure 10.
(a) Proactive SENSE SLAM* from the top three sections (separation, 17.6 mm) of a 5-slice data set, annotated to show: (1) tumor; (2) contralateral brain; (3) ‘rest of the brain’; (4) scalp; and (5) background compartments. (b–d) SENSE SLAM* spectra of the corresponding compartments in each of the three slices.
4.5 In vivo 3D 31P human heart MRS
Figure 11 illustrates the application of 3D SLAM reconstruction to a conventional thoracic 31P 3D CSI data set acquired in 38.7 min at 3T, which was reduced by SLAM to 5.5 min, representing an acceleration factor of 7.
Figure 11.

3D SLAM in a human 31P cardiac study. (a) Cardiac MRI showing segmented compartments: (1) chest; (2) heart; and (3) background. SLAM (red) and CSI (blue) spectra from (b) the chest and (c) the heart, with R = 7 and a 15 Hz exponential filter.
4.6 Compartmental misregistration and sample heterogeneity
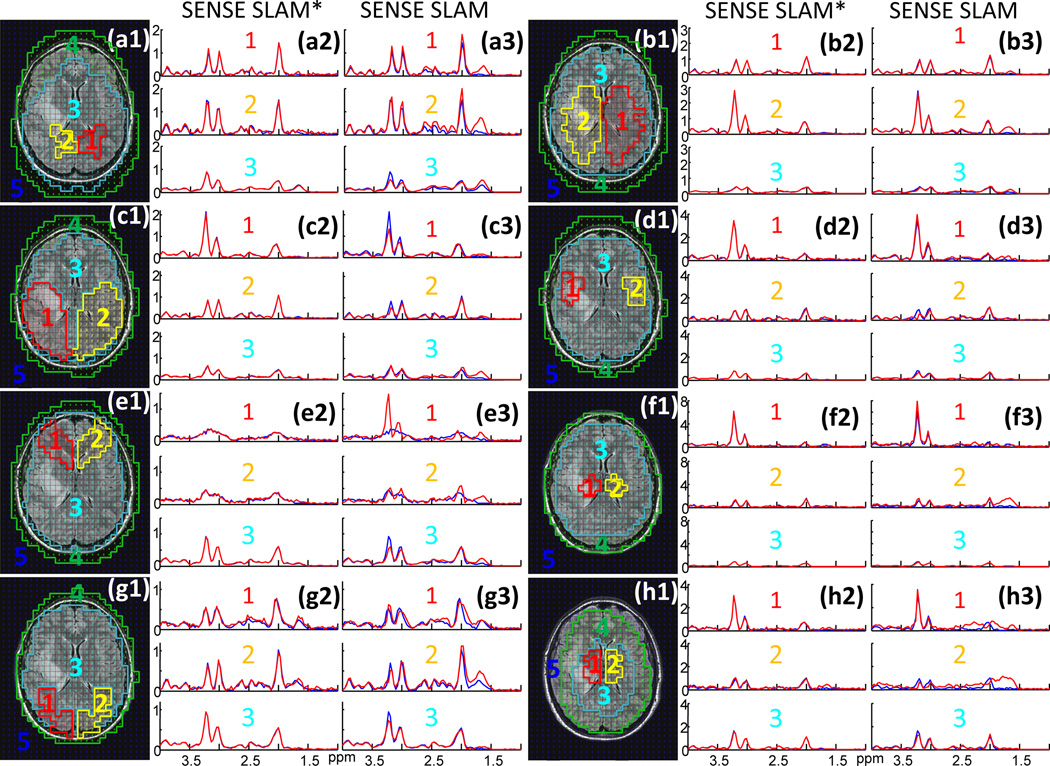
Figure 12 shows the sensitivity of SENSE SLAM* (spectra a2-h2) and SENSE SLAM (spectra a3-h3) to segmentation errors due to gross maladjustment in both size and location. Despite gross intra-compartmental anatomical inhomogeneity, SENSE SLAM* spectra are remarkably consistent with SENSE CSI from the same compartments in all cases, consistent with manageable, if not negligible signal bleed. SENSE SLAM reconstructed with Eq. (6), does show some discrepancies (eg, compare spectra c3 and e3), and inferior fitting to the SENSE CSI spectra used as the standard, compared to SENSE SLAM*. Importantly, all SLAM and SLAM* spectra were reconstructed from the same 25 PEs from central k-space, with an acceleration factor of 5 vs. SENSE CSI.
Figure 12.
The effects of incorrect segmentation and inhomogeneity. (a1–h1) Brain MRI showing eight grossly maladjusted segmentations (Fig. 8a shows the correct segmentation). The corresponding SENSE SLAM* (a2–h2, red) and SENSE SLAM spectra (a3–h3, red) reconstructed from the maladjusted compartments are compared with the average SENSE CSI cspectra (blue) from the same compartments. For SENSE SLAM* and SENSE SLAM, R = 5 compared to SENSE CSI.
4.7 Localization analyses
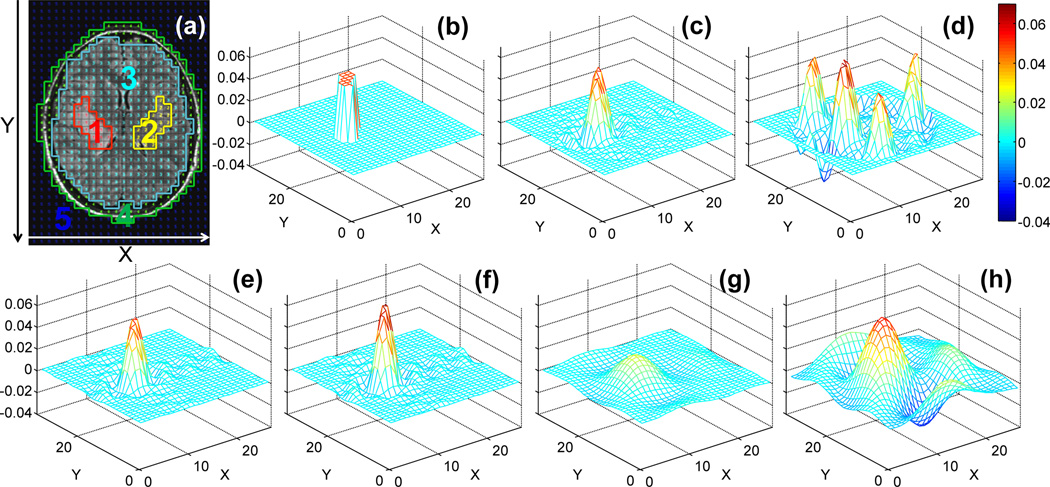
Figure 13 plots the dSRF’s for a tumor compartment reconstructed from the (SENSE) SLAM and (SENSE) SLAM* strategies, applied to the same anatomic segmentation (Fig. 13a). The difference between the modified SENSE SLAM* algorithm, Eq. (7), and SENSE SLAM employing Eq. (6) is best appreciated from parts (c) and (d). SENSE SLAM* has a spatially restricted dSRF, whereas the dSRF of SENSE SLAM is expansive with both positive and negative lobes.
Figure 13.
The computed tumor dSRF. (a) Brain MRI showing tumor segmentation(1, in red). The real part of dSRF is shown for the following reconstructions: (b) SENSE SLAM* (R=6 vs. SENSE CSI, without numeric regularization); (c) SENSE SLAM* (R = 6 vs. SENSE CSI, with numeric regularization and TSVD threshold ≤2% of the maximum); (d) SENSE SLAM (R=6 vs. SENSE CSI); (e) SLAM* (R=6 vs. CSI); (f) SLAM (R=6 vs. CSI); (g) SLAM* (R=36 vs. CSI); (h) SLAM (R=36 vs. CSI). Note that the dSRF is essentially not changed with or without the 2% TSVD in (d–h).
The dSRF of SENSE SLAM* performed with Eq. (7) without numeric regularization, is in theory perfect (Fig. 13b). This is because combining the 25 PEs with the 32 separate acquisition channels creates M’=25×32=800 known k-space signals. Although there are M=33×27=891 unknown image-space signals, application of the sensitivity mask during SENSE reconstruction[20] effectively reduces the number of unknowns from 891 to less than 800. Consequently, (EM'*M)+ in Eq. [9] is over-determined–hence the perfect dSRF. With numeric regularization, which is typically needed to ensure a well-conditioned matrix inversion when SNR is low, ‘the perfect dSRF’ of Fig. 13(b) degrades slightly to the dSRF for SENSE SLAM* shown in Fig 13(c). The dSRF remains spatially well-constrained, with edge definition improving as the TSVD threshold is reduced, or as more PEs are added. On the other hand, as Fig. 13(d) shows, the dSRF of SENSE SLAM employing Eq. (6) does not closely approximate the perfect case, even with all phase encodes (154 PEs in SENSE CSI) included.
However, without SENSE reconstruction, the dSRF of SLAM* (Fig. 13e) and SLAM (Fig. 13f) using 1/6th of the CSI PEs, are very similar to each other. They are also similar to the dSRF of numerically regularized SENSE SLAM* (Fig. 13c), which is 6 times faster than SENSE CSI and 36 times faster than CSI. However, the similarity between SLAM* and SLAM dSRFs disappears as the number of PEs is reduced further, as illustrated with only 1/36th of the CSI PEs in Figs. 13(g) and (h). Note that while numeric regularization affects the dSRF of SENSE SLAM*, it barely alters that of SLAM, SENSE SLAM or SLAM*. We found that numeric regularization with the 2% TSVD threshold was adequate for the data sets analyzed herein.
To quantify the dSRF’s of the tumor compartment in Fig. 13, the summed dSRF and |dSRF| were calculated over the five segmented compartments (tumor and contralateral brain, 20 CSI voxels each; ‘rest of the brain’ compartment #3, 288 voxels; scalp, and background). Without numeric regularization, SENSE SLAM* achieved perfect reconstruction (Table 1, row a) consistent with its dSRF (Fig. 13b). Numeric regularization broadened the dSRF of SENSE SLAM*, resulting in non-zero sums of dSRF and |dSRF| from the surrounding compartments (Table 1, row b). On the other hand, SENSE SLAM always forces the integral of dSRF to zero over the other compartments. This is in part achieved by a spatially oscillating dSRF (Fig. 13d), reflected in the non-zero |dSRF| sum in Table 1 (row c), which explains the strong lipid contamination in the SENSE SLAM spectra (Fig. 7, spectra b1–f1). Unlike SLAM (Table 1, row e), SLAM* (row d) does not force the summed dSRF to zero, but SLAM* does reduce the |dSRF| sum compared to SLAM. This is consistent with the reduced lipid contamination noted in Fig. 7.
Table 1.
Localization analysis based on dSRF’s of the tumor compartment shown in Figure 13 for, SENSE SLAM* with 2% TSVD, and SENSE SLAM*, SENSE SLAM, SLAM* and SLAM without regularization, respectively. Summation of dSRF and absolute dSRF (|dSRF|) are computed over different spatial regions.
| Sum of | Tumor | Contra- lateral |
Brain | Scalp | Background | |
|---|---|---|---|---|---|---|
| (a): SENSE SLAM* w/o regularization | dSRF | 1 | 0 | 0 | 0 | 0 |
| |dSRF| | 1 | 0 | 0 | 0 | 0 | |
| (b): SENSE SLAM* with 2% TSVD | dSRF | 0.8304 | 0.0095 – 0.0014i | 0.1678 + 0.0014i | −0.0023 – 0.0005i | −0.0054 – 0.004i |
| |dSRF| | 0.8304 | 0.0304 | 0.5671 | 0.1367 | 0.072 | |
| (c): SENSE SLAM | dSRF | 1 | 0 | 0 | 0 | 0 |
| |dSRF| | 1.0001 | 0.0873 | 2.3905 | 1.8984 | 0.8022 | |
| (d): SLAM* | dSRF | 0.8180 | 0.0186 | 0.1804 | −0.0208 | 0.0038 |
| |dSRF| | 0.8180 | 0.034 | 0.5839 | 0.0948 | 0.1519 | |
| (e): SLAM | dSRF | 1 | 0 | 0 | 0 | 0 |
| |dSRF| | 1 | 0.0361 | 0.7876 | 0.1253 | 0.2011 | |
| Summation over ∼20% extended tumor region | ||||||
| (f): SENSE SLAM* w/o regularization | dSRF | 1 | 0 | 0 | 0 | 0 |
| |dSRF| | 1 | 0 | 0 | 0 | 0 | |
| (g): SENSE SLAM* with 2% TSVD | dSRF | 0.9720 – 0.0015i | 0.0095 – 0.0014i | 0.0262 + 0.0028i | −0.0023 – 0.0005i | −0.0054 – 0.004i |
| |dSRF| | 0.9721 | 0.0304 | 0.4255 | 0.1367 | 0.072 | |
| (h): SLAM* | dSRF | 0.962 | 0.0186 | 0.0364 | −0.0208 | 0.0038 |
| |dSRF| | 0.962 | 0.034 | 0.4399 | 0.0948 | 0.1519 | |
Both of the dSRF’s in Fig. 13(c,e) are broadened compared to the perfect case (Fig. 13b). Table 1, rows f–h, show the effect of summing the dSRF and |dSRF| of the tumor compartment over a region expanded by ∼20% in each direction (tumor extended from 20 to 28 voxels; same 20-voxel contralateral brain compartment; remaining brain region decreased to 280 voxels). Without regularization SENSE SLAM* is unchanged (Table 1, row f vs. row a). However, with numerical regularization the summed dSRF in the tumor increases from 0.83 to 0.97, while that in the rest of the brain decreases from 0.17 to 0.03 (row g). A similar result obtains for SLAM* (Table 1, row h). This means that nearly all of the contributions to the reconstructed SLAM* and SENSE SLAM* spectra derive from a region localized around the tumor. Thus, it is reasonable to interpret the numerically regularized dSRF of SLAM* or SENSE SLAM* as a broadening (∼20% in each direction for the specific geometry shown in Fig. 13a) of the ideal case.
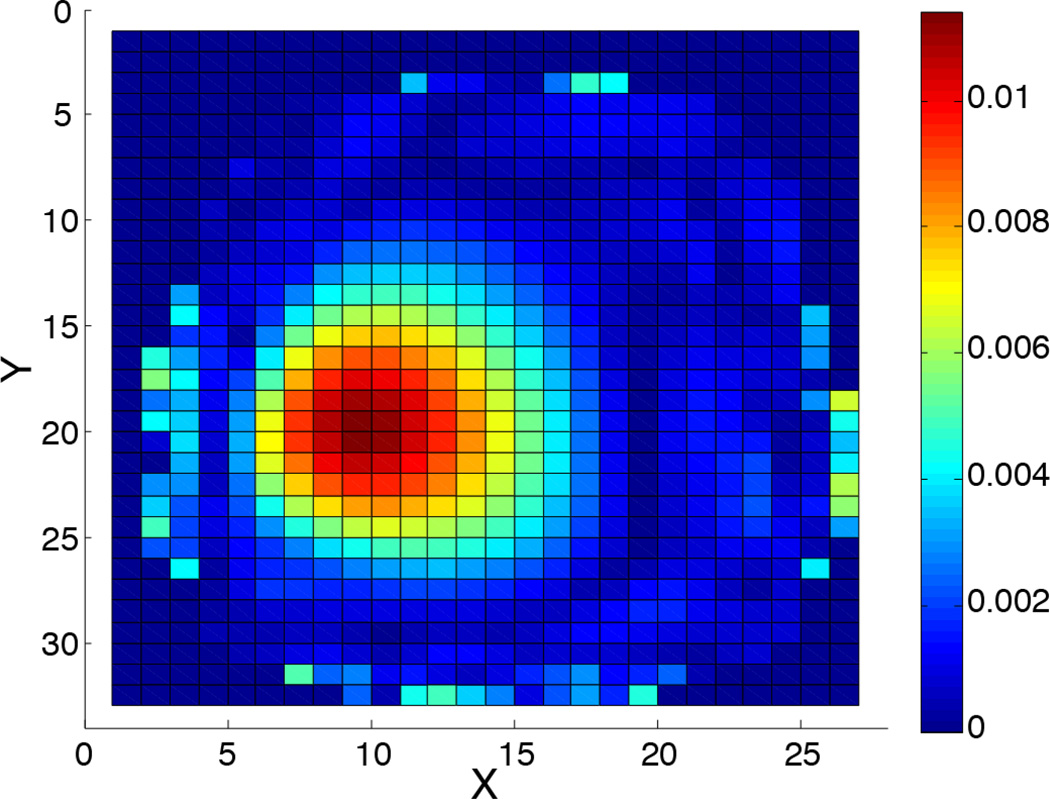
Finally, Fig. 14 depicts the dSRF in the extreme case of 120-fold accelerated SENSE SLAM* for compartment 3 of Fig. 7. Here, with only a single PE, localization is essentially entirely attributable to the SENSE coils in combination with the prior knowledge. This results in some signal rise around the periphery, close to the coils. Note that such extreme acceleration may not work well for other segmentation, data, or applications.
Figure 14.
The computed dSRF for compartment #3 of Fig. 7 in the extreme case of a single phase-encode (intensity scale is arbitrary).
5. Discussion
Even though information about spatial heterogeneity may be lost, in human and animal studies in practice, metrics derived from global or compartmentally-averaged spectra are often used to index metabolic status for diagnostic or prognostic purposes. SLAM is an MRS localization method that provides average spectra from segmented anatomical compartments using a limited set of phase-encoded acquisitions. Because these spectra are reconstructed by linear algebra for which any subset of the conventional CSI PE set can be selected, choosing only those at central k-space where SNR is highest, generally results in the best SNR by avoiding SNR losses associated with co-adding conventional CSI spectra, post-acquisition[16, 17]. This means that SLAM can employ the same (central k-space) PE set for any given study protocol without requiring additional scanner-side prescription. The SNR gain compared to coadding CSI spectra then provides a substantial offset to the SNR loss that results from cutting the scan-time by dropping the high-order phase-encodes of the conventional CSI acquisition. Compared to 2D and 3D CSI whose PE sets typically require 102 to 103 acquisitions, the decimated PE acquisition sets possible with SLAM can produce very large reductions in scan-time indeed. Such reductions can easily enable inclusion or extension of MRS in a patient or animal MRI/MRS protocol that would otherwise be precluded by time constraints, as was the case for the brain tumor patient in Fig. 10 for whom conventional SENSE CSI could not otherwise be performed.
In prior work[17], we demonstrated up to an 8-fold acceleration for 1D SLAM limited to a single receiver coil, when compared to an existing standard 16-PE 1D CSI protocol used for human cardiac 31P MRS[49]. With a 4-fold speed-up, measurements of human cardiac energy metabolism obtained from 1D SLAM and 1D CSI were indistinguishable. In the present work we have expanded 1D single-coil SLAM in five major and novel ways.
First, we have extended the SLAM method to 2D and 3D CSI achieving acceleration factors of up to 100-fold (Fig. 2) and 120-fold (Fig 7). Even the lower acceleration factors of 5- or 7-fold reported for the human data (Figs 7–12) represent meaningful, enabling, scan-time advantages. Importantly, these acceleration factors are measured relative to CSI acquisitions that have already been truncated by dropping (22% of the) PEs from the corners of k-space. The 7-fold reduction for 3D 31P cardiac CSI, for example (Fig. 11), slashes a barely tenable 39-min scan, which would be impractical for quantitative kinetic studies involving repeat acquisitions[2, 4, 5], to just 5½ min. This is short enough to include with a whole functional cardiac MRI study in a single patient exam. But even if the time-saving were not needed, averaging 7 SLAM acquisitions, for example, could still deliver up to a √7-fold SNR benefit compared to a compartmental-average CSI spectrum acquired in the same time: averaging four 1D SLAM acquisitions was already shown to produce a ∼√4=2-fold SNR gain for leg 31P MRS[17], and a ∼3-fold gain in SNR per unit volume and time was demonstrated in Fig. 7.
Second, we have combined SLAM with multi-receiver SENSE. State-of-the-art brain 1H CSI often employs SENSE parallel imaging techniques to dramatically reduce the CSI PE set and hence scan-time. This raises questions of whether SLAM can do better than SENSE CSI, or even if, or how, SLAM could be combined with SENSE. The analysis and results from a 32-channel head-coil presented here show that, with conventional SENSE calibration, the signals from the individual receiver channels can actually be used in lieu of PEs in SLAM, for spatial encoding. Consequently, SENSE SLAM can provide significant additional scan-time acceleration on top of that provided by SENSE CSI. This was demonstrated with 5 to 6-fold acceleration factors in Figs. 7–10 and 12. The example of a 120-fold acceleration compared to SENSE CSI illustrates the extreme case of replacing all but a single central k-space PE with the SENSE inputs from the 32-channel coil (Figs. 7, 14). Indeed, in many cases adding SENSE results in a reconstruction that is many-fold over-determined for the number of compartments being solved. Note that while the choice of gradient PEs to be used in conjunction with the SENSE reconstruction is arbitrary, deteriorating error and SNR away from central k-space argue for always choosing the centermost k-space steps first.
Third, we introduced a modification to the SLAM algorithm–SLAM* (Eq. 7) that reduces errors due to the effects of signal heterogeneity within compartments[17]. Although the integral of the SRF computed with the prior SLAM reconstruction (Eq. 6) is forced to zero outside a desired segmented compartment, non-zero integrals can result when signal variations are large. While the summed dSRF magnitudes in Table 1 represent highly unlikely worst-case scenarios in which nothing at all cancels, the experimental studies suggest that in practice, incomplete cancellation primarily arises from the superficial scalp compartment. Here, variations in intense lipid signals are exacerbated by the OVS pulses, as well as by the field inhomogeneity at the scalp which is furthest from the magnet iso-center, resulting in lipid signals bleeding into the brain SLAM spectra. We showed that the spatially limited dSRF of the SLAM* reconstruction (Fig. 13) greatly ameliorates this affect. For this reason it is preferred, especially with SENSE. The cost of SLAM* is some broadening of the dSRF. The broadening decreases as the number of PEs or the compartment size increases, and also as the threshold for numeric regularization is reduced. The upshot, is that SLAM* and especially SENSE SLAM*, are relatively insensitive to inhomogeneity or gross maladjustment of the segmentation (Fig. 12), such that lipid contamination of SLAM* spectra differs little from the CSI standard (Figs. 4, 7, 8, 12). Even so, the dSRF is a function of the acceleration factor, the SENSE coil geometry, as well as the sample distribution and compartment segmentation, and will therefore likely require some tailoring to optimize results for a given study protocol.
Fourth, all of these techniques–2D, 3D, SLAM and SLAM*, with and without SENSE– have been reduced to practice in vivo, in human studies. Moreover, as the data in Figs. 5 and 9 attest, when these techniques are applied to 1H MRS studies of patients with brain tumors and key 1H MRS metabolites–Cho, CR, and NAA–are quantified and compared with the average CSI spectra from the same compartments, the same results obtain. This, 5 times faster than SENSE CSI, which is already accelerated.
Fifth, we have shown that existing tools commonly applied to compensate CSI spectra for field inhomogeneities and eddy-currents, can conveniently be incorporated into SLAM on a voxel or compartment-by-compartment basis similar to CSI, without affecting the quantitative agreement between SLAM and CSI (Figs. 8, 9). As usual, the treatment of spatial and temporal field inhomogeneities (Sec. 2.4), does require quantification of their behavior.
We previously reviewed SLAM in the context of earlier SLIM[24], GSLIM[25] and SLOOP[26] approaches noting their differences, as well as single voxel approaches which are limited to rectangular voxels that can’t be altered post-acquisition[17]. SLIM, GSLIM and SLOOP could in principle offer ultra-high resolution and eliminate artifacts from signal bleed. However, this would require perfectly accurate compartmental segmentation and uniform compartments that may be difficult to realize in practice. Ultra-high resolution MRS, which would at least be needed to establish a standard for error quantification, may also be problematic. In contrast, SLAM accepts conventional CSI as the standard. It is therefore easily validated with existing CSI data sets, retro- or pro-actively acquired (Fig. 8, 10), and does not need ultra-high resolution MRS and accurate segmentation is not critical (Fig. 12).
In conclusion, SLAM is a new CSI-based MRS localization technique that offers huge reductions in scan-time and potentially large increases in volume coverage, while preserving SNR. The method does not even require scanner-side prescription of anatomic compartments. In our opinion, its reduction-to-practice in 2D, in 3D, with SENSE, with eddy-current compensation, and with quantitative validation in 1H MRS studies of 24 patients with brain tumors, should suffice to demonstrate that the technique is now ready for prime time.
Highlights.
2D and 3D SLAM provide compartment-average spectra up to 120-fold faster than CSI.
SLAM can use phase-encoding gradients and/or parallel imaging detectors (SENSE).
SENSE SLAM 5-fold faster than already-accelerated brain 2D SENSE CSI, is shown.
A modified SLAM reconstruction algorithm improves spatial response and reduces error.
SLAM 31P heart and 1H brain tumor measures are the same as CSI, 5–7 times faster.
Acknowledgements
We thank Dr. Michael Schär from Philips Healthcare for help concerning the Philips MRI/MRS scanner, and Drs. Peter Barker at Johns Hopkins University and He Zhu now at Vanderbilt University, for helpful discussions and providing some early data.
Grant support: American Heart Association 13GRNT17050100; National Institutes of Health EB007829, HL61912, EB009731, CA166171.
Appndix A: Localization analysis for (SENSE) SLAM
The reconstructed (SENSE) SLAM spectrum for the ith compartment of a set of C compartments
can be determined from the dSRF as:
| (A1) |
where denotes that only the ith (1 ≤ i ≤ C) row corresponding to the ith compartment is selected from the (SENSE) SLAM spectral matrix, ; dSRFC*M(i, j) is the element at the ith row and jth column of dSRFC*M; j (1 ≤ j ≤ M) is an index for each of all M spatial voxels; and ρM*N(j,:) is the jth spectrum in the (SENSE) CSI spectral matrix, ρM*N.
If the spatial voxels of ρM*N in a specific region are grouped to form a user-defined region k, their contribution to the ith SLAM spectrum from the compartment of interest, , is:
| (A2) |
where ρ̄k is the average (SENSE) CSI spectrum for region k; and is the deviation of each individual CSI voxel spectrum in the kth region from its regional mean.
A further examination of Eq. (A2) leads to:
| (A3) |
Eq. [A3] relates the SLAM spectrum reconstructed for the ith compartment, to the contributions from the mean signal of each region and the inhomogeneities, modulated by the dSRF over the specified regions. The inequality in |dSRF| sets an upper bound on contributions due to regional inhomogeneity.
Appendix B: The dSRF for (SENSE) SLAM incorporating inhomogeneity effects
The dSRF for (SENSE) SLAM reconstruction (Eq. 11), after incorporating spatial alternation terms, is:
| (B1) |
Similarly, for (SENSE) SLAM* (Eq. 12):
| (B2) |
For time-varying spatial corrections, the dSRF should be computed separately for each time point.
Appendix c: The SNR of (SENSE) SLAM
The compartmental average (SENSE) CSI spectrum for the ith compartment, , obtained from the “pre-whitened” Eq. (2) is:
| (C1) |
where L is the number of voxels in the ith compartment, j is a voxel index in the ith compartment, is the (SENSE) CSI unfolding matrix, and Mcsi is the number of acquired (SENSE) CSI signals from all coil elements. Assuming the SD of the noise in the pre-whitened signal matrix, sMcsi*N is σ, the noise in the ith compartmental average (SENSE) CSI spectrum is,
| (C2) |
where k (1 ≤ k ≤ M csi) is an index for each acquired signal.
Similarly, the noise for the ith compartmental (SENSE) SLAM spectrum is,
| (C3) |
and
| (C4) |
for (SENSE) SLAM*. Here M’ is the total number of k-space signals used in (SENSE) SLAM/SLAM*, and (i, k) denotes the corresponding matrix element.
The relative SNRs for a given total scan-time obtain by comparing Eqs. C2–C4, assuming the compartment signal is constant.
Footnotes
Publisher's Disclaimer: This is a PDF file of an unedited manuscript that has been accepted for publication. As a service to our customers we are providing this early version of the manuscript. The manuscript will undergo copyediting, typesetting, and review of the resulting proof before it is published in its final citable form. Please note that during the production process errors may be discovered which could affect the content, and all legal disclaimers that apply to the journal pertain.
References
- 1.Hardy CJ, Weiss RG, Bottomley PA, Gerstenblith G. Altered myocardial high-energy phosphate metabolites in patients with dilated cardiomyopathy. American Heart Journal. 1991;122:795–801. doi: 10.1016/0002-8703(91)90527-o. [DOI] [PubMed] [Google Scholar]
- 2.Weiss RG, Bottomley PA, Hardy CJ, Gerstenblith G. Regional myocardial metabolism of high-energy phosphates during isometric exercise in patients with coronary artery disease. New England Journal of Medicine. 1990;323:1593–1600. doi: 10.1056/NEJM199012063232304. [DOI] [PubMed] [Google Scholar]
- 3.Bottomley PA, Weiss RG. Non-invasive magnetic-resonance detection of creatine depletion in non-viable infarcted myocardium. The Lancet. 1998;351:714–718. doi: 10.1016/S0140-6736(97)06402-7. [DOI] [PubMed] [Google Scholar]
- 4.Weiss RG, Gerstenblith G, Bottomley PA. ATP flux through creatine kinase in the normal, stressed, and failing human heart. Proceedings of the National Academy of Sciences of the United States of America. 2005;102:808–813. doi: 10.1073/pnas.0408962102. [DOI] [PMC free article] [PubMed] [Google Scholar]
- 5.Smith CS, Bottomley PA, Schulman SP, Gerstenblith G, Weiss RG. Altered creatine kinase adenosine triphosphate kinetics in failing hypertrophied human myocardium. Circulation. 2006;114:1151–1158. doi: 10.1161/CIRCULATIONAHA.106.613646. [DOI] [PMC free article] [PubMed] [Google Scholar]
- 6.Kurhanewicz J, Vigneron DB, Hricak H, Narayan P, Carroll P, Nelson SJ. Three-dimensional H-1 MR spectroscopic imaging of the in situ human prostate with high (0.24–0.7-cm3) spatial resolution. Radiology. 1996;198:795–805. doi: 10.1148/radiology.198.3.8628874. [DOI] [PubMed] [Google Scholar]
- 7.Nelson SJ, Vigneron DB, Dillon WP. Serial evaluation of patients with brain tumors using volume MRI and 3D 1H MRSI. NMR in Biomedicine. 1999;12:123–138. doi: 10.1002/(sici)1099-1492(199905)12:3<123::aid-nbm541>3.0.co;2-y. [DOI] [PubMed] [Google Scholar]
- 8.Scheidler J, Hricak H, Vigneron DB, Kyle KY, Sokolov DL, Huang LR, Zaloudek CJ, Nelson SJ, Carroll PR, Kurhanewicz J. Prostate Cancer: Localization with Three-dimensional Proton MR Spectroscopic Imaging—Clinicopathologic Study. Radiology. 1999;213:473–480. doi: 10.1148/radiology.213.2.r99nv23473. [DOI] [PubMed] [Google Scholar]
- 9.Dowling C, Bollen AW, Noworolski SM, McDermott MW, Barbaro NM, Day MR, Henry RG, Chang SM, Dillon WP, Nelson SJ. Preoperative proton MR spectroscopic imaging of brain tumors: correlation with histopathologic analysis of resection specimens. American Journal of Neuroradiology. 2001;22:604–612. [PMC free article] [PubMed] [Google Scholar]
- 10.Barker PB, Gillard JH, Van Zijl P, Soher BJ, Hanley DF, Agildere AM, Oppenheimer SM, Bryan RN. Acute stroke: evaluation with serial proton MR spectroscopic imaging. Radiology. 1994;192:723–732. doi: 10.1148/radiology.192.3.8058940. [DOI] [PubMed] [Google Scholar]
- 11.Barker PB, Lin DD. In vivo proton MR spectroscopy of the human brain. Progress in Nuclear Magnetic Resonance Spectroscopy. 2006;49:99–128. [Google Scholar]
- 12.Bottomley PA. Spatial localization in NMR spectroscopy in vivo. Annals of the New York Academy of Sciences. 1987;508:333–348. doi: 10.1111/j.1749-6632.1987.tb32915.x. [DOI] [PubMed] [Google Scholar]
- 13.Frahm J, Merboldt K-D, Hänicke W. Localized proton spectroscopy using stimulated echoes. Journal of Magnetic Resonance (1969) 1987;72:502–508. [Google Scholar]
- 14.Ordidge R, Connelly A, Lohman J. Image-selected in Vivo spectroscopy (ISIS). A new technique for spatially selective nmr spectroscopy. Journal of Magnetic Resonance (1969) 1986;66:283–294. [Google Scholar]
- 15.Brown T, Kincaid B, Ugurbil K. NMR chemical shift imaging in three dimensions. Proceedings of the National Academy of Sciences. 1982;79:3523–3526. doi: 10.1073/pnas.79.11.3523. [DOI] [PMC free article] [PubMed] [Google Scholar]
- 16.Bottomley PA, Hardy CJ. Strategies and Protocols for Clinical 31P Research in the Heart and Brain. Phil. Trans. R. Soc. Lond. A. 1990;333:531–544. [Google Scholar]
- 17.Zhang Y, Gabr RE, Schär M, Weiss RG, Bottomley PA. Magnetic resonance Spectroscopy with Linear Algebraic Modeling (SLAM) for higher speed and sensitivity. Journal of Magnetic Resonance. 2012:66–76. doi: 10.1016/j.jmr.2012.03.008. [DOI] [PMC free article] [PubMed] [Google Scholar]
- 18.Posse S, Tedeschi G, Risinger R, Ogg R, Bihan DL. High Speed 1H Spectroscopic Imaging in Human Brain by Echo Planar Spatial-Spectral Encoding. Magnetic resonance in medicine. 1995;33:34–40. doi: 10.1002/mrm.1910330106. [DOI] [PubMed] [Google Scholar]
- 19.Adalsteinsson E, Irarrazabal P, Topp S, Meyer C, Macovski A, Spielman DM. Volumetric spectroscopic imaging with spiral-based k-space trajectories. Magnetic resonance in medicine. 1998;39:889–898. doi: 10.1002/mrm.1910390606. [DOI] [PubMed] [Google Scholar]
- 20.Pruessmann KP, Weiger M, Scheidegger MB, Boesiger P. SENSE: sensitivity encoding for fast MRI. Magnetic Resonance in Medicine. 1999;42:952–962. [PubMed] [Google Scholar]
- 21.Dydak U, Weiger M, Pruessmann KP, Meier D, Boesiger P. Sensitivity-encoded spectroscopic imaging. Magnetic Resonance in Medicine. 2001;46:713–722. doi: 10.1002/mrm.1250. [DOI] [PubMed] [Google Scholar]
- 22.Griswold MA, Jakob PM, Heidemann RM, Nittka M, Jellus V, Wang J, Kiefer B, Haase A. Generalized autocalibrating partially parallel acquisitions (GRAPPA) Magnetic Resonance in Medicine. 2002;47:1202–1210. doi: 10.1002/mrm.10171. [DOI] [PubMed] [Google Scholar]
- 23.Breuer F, Ebel D, Ruff J, Blaimer M, Seiberlich N, Griswold M, Jakob P. Parallel 2D and 3D spectroscopic imaging using GRAPPA. Proc. Intl. Soc. Mag. Reson. Med. 2006:3653. [Google Scholar]
- 24.Hu X, Levin DN, Lauterbur PC, Spraggins T. SLIM: Spectral localization by imaging. Magnetic Resonance in Medicine. 1988;8:314–322. doi: 10.1002/mrm.1910080308. [DOI] [PubMed] [Google Scholar]
- 25.Liang Z-P, Lauterbur P. A generalized series approach to MR spectroscopic imaging, Medical Imaging. IEEE Transactions on. 1991;10:132–137. doi: 10.1109/42.79470. [DOI] [PubMed] [Google Scholar]
- 26.von Kienlin M, Mejia R. Spectral localization with optimal pointspread function. Journal of Magnetic Resonance (1969) 1991;94:268–287. [Google Scholar]
- 27.Bashir A, Yablonskiy DA. Natural linewidth chemical shift imaging (NL-CSI) Magnetic Resonance in Medicine. 2006;56:7–18. doi: 10.1002/mrm.20917. [DOI] [PMC free article] [PubMed] [Google Scholar]
- 28.Khalidov I, Van De Ville D, Jacob M, Lazeyras F, Unser M. BSLIM: Spectral localization by imaging with explicit B0 field inhomogeneity compensation, Medical Imaging. IEEE Transactions on. 2007;26:990–1000. doi: 10.1109/TMI.2007.897385. [DOI] [PubMed] [Google Scholar]
- 29.An L, Warach S, Shen J. Spectral localization by imaging using multielement receiver coils. Magnetic Resonance in Medicine. 2011;66:1–10. doi: 10.1002/mrm.22783. [DOI] [PMC free article] [PubMed] [Google Scholar]
- 30.Donoho DL. Compressed sensing, Information Theory. IEEE Transactions on. 2006;52:1289–1306. [Google Scholar]
- 31.Candès EJ, Romberg J, Tao T. Robust uncertainty principles: Exact signal reconstruction from highly incomplete frequency information, Information Theory. IEEE Transactions on. 2006;52:489–509. [Google Scholar]
- 32.Lustig M, Donoho D, Pauly JM. Sparse MRI: The application of compressed sensing for rapid MR imaging. Magnetic Resonance in Medicine. 2007;58:1182–1195. doi: 10.1002/mrm.21391. [DOI] [PubMed] [Google Scholar]
- 33.Hu S, Lustig M, Balakrishnan A, Larson PE, Bok R, Kurhanewicz J, Nelson SJ, Goga A, Pauly JM, Vigneron DB. 3D compressed sensing for highly accelerated hyperpolarized 13C MRSI with in vivo applications to transgenic mouse models of cancer. Magnetic Resonance in Medicine. 2009;63:312–321. doi: 10.1002/mrm.22233. [DOI] [PMC free article] [PubMed] [Google Scholar]
- 34.Dong Z, Hwang JH. Lipid signal extraction by SLIM: Application to 1H MR spectroscopic imaging of human calf muscles. Magnetic Resonance in Medicine. 2006;55:1447–1453. doi: 10.1002/mrm.20895. [DOI] [PubMed] [Google Scholar]
- 35.Loffler R, Sauter R, Kolem H, Haase A, von Kienlin M. Localized spectroscopy from anatomically matched compartments: improved sensitivity and localization for cardiac 31P MRS in humans. Journal of Magnetic Resonance. 1998;134:287–299. doi: 10.1006/jmre.1998.1497. [DOI] [PubMed] [Google Scholar]
- 36.Meininger M, Landschütz W, Beer M, Seyfarth T, Horn M, Pabst T, Haase A, Hahn D, Neubauer S, von Kienlin M. Concentrations of human cardiac phosphorus metabolites determined by SLOOP 31P NMR spectroscopy. Magnetic Resonance in Medicine. 1999;41:657–663. doi: 10.1002/(sici)1522-2594(199904)41:4<657::aid-mrm3>3.0.co;2-i. [DOI] [PubMed] [Google Scholar]
- 37.von Kienlin M, Beer M, Greiser A, Hahn D, Harre K, Köstler H, Landschütz W, Pabst T, Sandstede J, Neubauer S. Advances in human cardiac 31P-MR spectroscopy: SLOOP and clinical applications. Journal of Magnetic Resonance Imaging. 2001;13:521–527. doi: 10.1002/jmri.1074. [DOI] [PubMed] [Google Scholar]
- 38.Beer M, Seyfarth T, Sandstede J, Landschütz W, Lipke C, Köstler H, von Kienlin M, Harre K, Hahn D, Neubauer S. Absolute concentrations of high-energy phosphate metabolites in normal, hypertrophied, and failing human myocardium measured noninvasively with 31P-SLOOP magnetic resonance spectroscopy. Journal of the American College of Cardiology. 2002;40:1267–1274. doi: 10.1016/s0735-1097(02)02160-5. [DOI] [PubMed] [Google Scholar]
- 39.Geier O, Weng AM, Toepell A, Hahn D, Spindler M, Beer M, Köstler H. Acquisition-weighted chemical shift imaging improves SLOOP quantification of human cardiac phosphorus metabolites. Zeitschrift für Medizinische Physik. 2013;49:1–6. doi: 10.1016/j.zemedi.2013.01.002. [DOI] [PubMed] [Google Scholar]
- 40.Loan CFV. The ubiquitous Kronecker product. Journal of Computational and Applied Mathematics. 2000;123:85–100. [Google Scholar]
- 41.Pruessmann KP, Weiger M, Börnert P, Boesiger P. Advances in sensitivity encoding with arbitrary k-space trajectories. Magnetic Resonance in Medicine. 2001;46:638–651. doi: 10.1002/mrm.1241. [DOI] [PubMed] [Google Scholar]
- 42.Hoge WS, Brooks DH, Madore B, Kyriakos WE. A tour of accelerated parallel MR imaging from a linear systems perspective. Concepts in Magnetic Resonance Part A. 2005;27:17–37. [Google Scholar]
- 43.Horn RA, Johnson CR. Matrix analysis. Cambridge university press. 1990 [Google Scholar]
- 44.Roebuck JR, Hearshen DO, O'Donnell M, Raidy T. Correction of phase effects produced by eddy currents in solvent suppressed 1H-CSI. Magnetic Resonance in Medicine. 1993;30:277–282. doi: 10.1002/mrm.1910300302. [DOI] [PubMed] [Google Scholar]
- 45.Simonetti A, Melssen W, Van der Graaf M, Heerschap A, Buydens L. Automated correction of unwanted phase jumps in reference signals which corrupt MRSI spectra after eddy current correction. Journal of Magnetic Resonance. 2002;159:151–157. doi: 10.1016/s1090-7807(02)00102-7. [DOI] [PubMed] [Google Scholar]
- 46.Duyn JH, Gillen J, Sobering G, Van Zijl P, Moonen C. Multisection proton MR spectroscopic imaging of the brain. Radiology. 1993;188:277–282. doi: 10.1148/radiology.188.1.8511313. [DOI] [PubMed] [Google Scholar]
- 47.Zhu H, Barker PB. MR spectroscopy and spectroscopic imaging of the brain, Methods in molecular biology (Clifton. NJ) 2011;711:203–226. doi: 10.1007/978-1-61737-992-5_9. [DOI] [PMC free article] [PubMed] [Google Scholar]
- 48.Tkac I, Starcuk Z, Choi I, Gruetter R. In Vivo 1H NMR Spectroscopy of Rat Brain at 1 ms Echo Time. Magnetic Resonance in Medicine. 1999;41:649–656. doi: 10.1002/(sici)1522-2594(199904)41:4<649::aid-mrm2>3.0.co;2-g. [DOI] [PubMed] [Google Scholar]
- 49.Hajnal JV, De Coene B, Lewis PD, Baudouin CJ, Cowan FM, Pennock JM, Young IR, Bydder GM. High signal regions in normal white matter shown by heavily T2-weighted CSF nulled IR sequences. Journal of Computer Assisted Tomography. 1992;16:506–513. doi: 10.1097/00004728-199207000-00002. [DOI] [PubMed] [Google Scholar]
- 50.Hajnal JV, Bryant DJ, Kasuboski L, Pattany PM, De Coene B, Lewis PD, Pennock JM, Oatridge A, Young IR, Bydder GM. Use of fluid attenuated inversion recovery (FLAIR) pulse sequences in MRI of the brain. Journal of Computer Assisted Tomography. 1992;16:841–844. doi: 10.1097/00004728-199211000-00001. [DOI] [PubMed] [Google Scholar]
- 51.Zhu H, Ouwerkerk R, Barker PB. Dual-band water and lipid suppression for MR spectroscopic imaging at 3 Tesla. Magnetic Resonance in Medicine. 2010;63:1486–1492. doi: 10.1002/mrm.22324. [DOI] [PMC free article] [PubMed] [Google Scholar]
- 52.El-Sharkawy A-M, Schär M, Ouwerkerk R, Weiss RG, Bottomley PA. Quantitative cardiac 31P spectroscopy at 3 Tesla using adiabatic pulses. Magnetic Resonance in Medicine. 2009;61:785–795. doi: 10.1002/mrm.21867. [DOI] [PMC free article] [PubMed] [Google Scholar]
- 53.De Graaf RA. In vivo NMR spectroscopy: principles and techniques. Wiley-Interscience. 2008 [Google Scholar]
- 54.Howe F, Barton S, Cudlip S, Stubbs M, Saunders D, Murphy M, Wilkins P, Opstad K, Doyle V, McLean M. Metabolic profiles of human brain tumors using quantitative in vivo 1H magnetic resonance spectroscopy. Magnetic Resonance in Medicine. 2003;49:223–232. doi: 10.1002/mrm.10367. [DOI] [PubMed] [Google Scholar]


