

Abstract
One of the major failure modes of bioprosthetic heart valves (BHVs) is noncalcific structural deterioration due to fatigue of the tissue leaflets; yet, the mechanisms of fatigue are not well understood. BHV durability is primarily assessed based on visual inspection of the leaflets following accelerated wear testing. In this study, we developed a computational framework to simulate BHV leaflet fatigue, which is both efficient and quantitative, making it an attractive alternative to traditional accelerated wear testing. We utilize a phenomenological soft tissue fatigue damage model developed previously to describe the stress softening and permanent set of the glutaraldehyde-treated bovine pericardium leaflets in BHVs subjected to cyclic loading. A parametric study was conducted to determine the effects of altered leaflet and stent elastic properties on the fatigue of the leaflets. The simulation results show that heterogeneity of the leaflet elastic properties, poor leaflet coaptation, and little stent-tip deflection may accelerate leaflet fatigue, which agrees with clinical findings. Therefore, the developed framework may be an invaluable tool for evaluating leaflet durability in new tissue valve designs, including traditional BHVs as well as new transcatheter valves.
Keywords: Bioprosthetic heart valve durability, Soft tissue fatigue, Finite element analysis
1 Introduction
Currently, the only clinically proven effective, long-term treatment for valvular heart disease is open-chest cardiac valve repair or replacement surgery. Typically with aortic valve disease, the native valve is replaced with either a mechanical or tissue-derived bioprosthetic heart valve (BHV). BHVs offer superior hemodynamics and eliminate the need for anticoagulants accompanying mechanical valve replacement. For these reasons, BHVs have been widely used to treat valvular disease for over 40 years (Brewer et al. 1977). Now with the advent of minimally invasive implantation techniques, a new breed of BHVs amenable to transcatheter delivery is emerging (Munt and Webb 2006; Webb et al. 2007). Yet, the main limitation of BHVs continues to be the long-term durability owing to calcification or fatigue-induced structural deterioration of the tissue leaflets (Vyavahare et al. 1999; Haziza et al. 1996). Consequently, BHVs often need to be replaced within 10 years of implantation, and in as little as 5 years in younger patients (Vyavahare et al. 1999). It has been suggested that these failures are caused by localized leaflet damage at stressed regions, but the mechanisms of BHV leaflet fatigue and failure are incompletely understood.
It is, however, clear that BHV design features have an impact on the long-term durability. For instance, the Ionescu– Shiley (IS) valve was taken off the market for its subpar durability of approximately 5 years (Gabbay et al. 1984a,b; Brais et al. 1985; Reul et al. 1985; Cooley et al. 1986; Nistal et al. 1986a,b), due to design flaws shortly after its release. The limited durability of the IS valve was thought to be the result of the rigid stent and the suture hole in the leaflet near the top of the post (Brais et al. 1985). For this reason, second-generation pericardial BHVs, including the Carpentier–Edwards Perimount (CEP), incorporated a flexible stent to act as a cushion and reduce stresses acting on the leaflets (Singhal et al. 2013). The CEP valve has an in vivo durability of up to 20 years. After extensive study, the inferior durability of the IS valve compared to the CEP valve has been hypothesized to be the result of several factors: very little stent-tip deflection (due to the rigid stent), thin leaflets, and poor leaflet coaptation causing “pin-wheeling” of the leaflets (Vesely 2008–2011). In rare cases, early CEP valve structural failures have also been observed (Fleisher et al. 2004). These failures are thought to be largely due to heterogeneity in the structure and properties of the glutaraldehyde-treated bovine pericardium (GLBP) leaflets, which leads to leaflet tearing and/or prolapse due to elongation of one or more of the leaflets (Trowbridge et al. 1986; Fleisher et al. 2004; Singhal et al. 2013). Much of this insight comes from comparing clinical outcomes for various BHV designs, and although these studies were very useful to determine critical valve design issues, in vivo studies are not well controlled due to patient variability and this retrospective approach is unsuitable for investigating new designs.
Currently, the International Organization for Standardization (2005) and the Food and Drug Administration (2010) recommend that new BHV designs be tested up to 200 million cycles using accelerated wear testers (AWTs) to evaluate the device safety and efficacy over time. Although AWTs can imitate the in vivo hemodynamics, it remains difficult to isolate the specific effects of various BHV design parameters on the durability of the leaflets when using this technique. BHV durability assessment is largely based on the visual inspection of the leaflets following AWT cycling, and this method is both time-consuming and expensive.
For a quantitative and efficient assessment of BHV performance, attention has turned toward computational analyses of BHV function (Christie 1992; Krucinski et al. 1993; Sun et al. 2005; Kim et al. 2008). It is commonly accepted that BHV durability can be improved by reducing high stress concentrations in the leaflets. However, a peak stress analysis at a single snapshot in time may not be sufficient to predict the BHV durability. Under cyclic loading, the leaflets will undergo stress softening and permanent set; thus, both the tissue properties and leaflet geometry are changing over time, and both factors may change the stress distribution throughout the valve life cycle.
In this study, we utilize a phenomenological fatigue damage model developed previously (Martin and Sun 2013) to describe the overall fatigue damage of GLBP leaflets due to cyclic loading in BHV applications. The model incorporates descriptions of the fatigue-induced stress softening and permanent set of GLBP. The fatigue damage model was implemented into ABAQUS via a user-defined material (UMAT) in conjunction with the nonlinear orthotropic Fung-elastic model and is utilized in BHV cyclic loading simulations. The effect of different leaflet and stent properties on the fatigue damage of the leaflets was investigated in a typical BHV model (Sun et al. 2005). This marks the first study where fatigue damage was simulated for BHV applications and the effect of BHV design parameters on the durability was quantitatively assessed. Although the GLBP fatigue parameters from our previous study (Martin and Sun 2013) were not rigorously determined through experiments, the comparison between cases provides invaluable insight into the specific effects of BHV design features on long-term BHV durability. This computational approach to studying BHV durability will hopefully benefit the valve community: allowing researchers to efficiently evaluate new BHV designs prior to AWT testing.
2 Methods
2.1 Constitutive modeling of tissue fatigue
2.1.1 Fatigued state tissue strain energy function
To incorporate changes to the valve leaflet material properties as a result of fatigue damage, the strain energy function, W, is enhanced with the addition of a stress-softening parameter, Ds, and a permanent set parameter, Dps (Martin and Sun 2013), given by
| (1) |
where E is the Green strain tensor and Wps is the dissipated strain energy due to the permanent set. At the unfatigued state, both Ds and Dps are inactive, i.e., Ds = 0 and Dps = 0; thus, W is only a function of E. The parameters Ds and Dps become active with the onset of fatigue damage induced by cyclic loading, and the inclusion of these terms provides a means of changing the form of the strain energy function, which is no longer elastic.
2.1.2 Equivalent strain
In order to establish the law of tissue fatigue damage evolution, we use the equivalent strain Ξt (Simo 1987), a scalar quantity proportional to the strain energy at time t,
| (2) |
Where E(t) is the Green strain tensor at time t ∈ [0, T]. Since the primary focus of this study is on long-term tissue fatigue damage after millions of cycles of loading, the damage criteria were only evaluated at the peak of each loading cycle to reduce computational time. Therefore, we evaluate the peak equivalent strain (Martin and Sun 2013) after each loading cycle, given explicitly by:
| (3) |
where f is the frequency and n is the number of loading cycles up to a maximum number, ntot.
2.1.3 Cycles to failure definition
Here, we introduce two parameters ψmin and ψmax, to define the boundaries of the fatigue damage evolution zone, where ψmin represents the minimum equivalent strain to elicit the accumulation of fatigue damage and ψmax represents the tissue maximum equivalent strain limit. We propose that the number of cycles until failure (ntot) is given by the following equation:
| (4) |
where α and β are material constants governing the amount of damage incurred by a single cycle at .
2.1.4 Fatigue-induced stress softening
We assume that at a given equivalent strain, an equal amount of damage is accumulated during each loading cycle, representing a linear accumulation of damage. Therefore, the total amount of damage due to stress softening, Ds, after n tensile loading cycles is given by
| (5) |
2.1.5 Fatigue-induced permanent set
Tissue damage is associated with irreversible tissue elasticity loss; therefore, a permanent set is exhibited after cyclic loading. In our previous study (Martin and Sun 2013), the permanent set was defined as a function of the maximum permanent set strains along the principal axes for the uniaxial tensile failure condition in the 22 direction. This permanent set definition captured the permanent set induced by uniaxial fatigue cycling of a square specimen in the 22 direction well, because all areas of the specimen were experiencing similar uniaxial loading conditions. For the application of BHVs, different areas of the leaflets are experiencing different loading conditions at any given time, so the permanent set definition was modified. The permanent set, Dpsij, is given by:
| (6) |
The permanent set is now scaled by the peak strain ratio, , to enforce anisotropy in the permanent set, where is the Green strain at in direction ij, and . The refers to the maximum permanent set Green strain associated with uniaxial tensile failure along the kl direction (Dpsmaxkl), where the kl direction corresponds to that of , i.e., . Under this modified formulation, we assume that the permanent set is most significant in the direction of the maximum peak strain and that the permanent set in the other directions is proportional to the ratio of peak strains.
We employ a plastic stress, Sp, to enforce the permanent set (Martin and Sun 2013).
| (7) |
The Sp contribution to the overall tissue response is governed by η in Eq. 8, which was modified from Dorfmann and Ogden's η function (Dorfmann and Ogden 2004) in order to accommodate for the dissipated equivalent strain associated with the permanent set, Ξps, defined by Eq. 9,
| (8) |
| (9) |
2.1.6 Fatigued tissue response
The second Piola-Kirchoff stress tensor may be expressed in the following reduced form:
| (10) |
The interested reader is referred to our previous publication (Martin and Sun 2013) for further details on the tissue fatigue constitutive model.
For the purpose of this study, GLBP is assumed to be an incompressible (det F= 1), anisotropic, nonlinear, hyper-elastic material (Sun and Sacks 2005), and the unfatigued strain energy, W0, was expressed as the generalized Fung-type strain energy function for the planar biaxial response of soft biological tissues given by (Fung 1993)
| (11) |
| (12) |
where c and A1–6 are material parameters.
2.2 Finite element modeling of BHVs
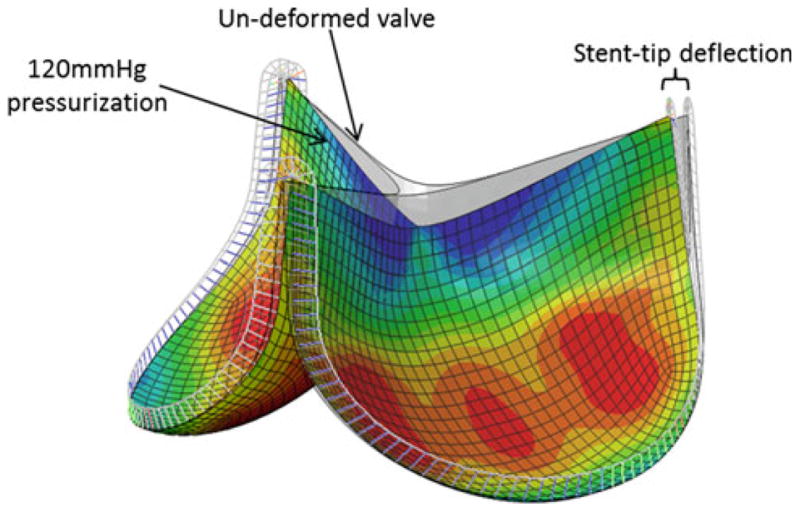
The BHV finite element model was developed and validated previously by Sun et al. (2005) (Fig. 1). Briefly, the trileaflet BHV model consisted of GLBP tissue leaflets mounted onto a metal stent. The stent was constructed using beam elements. The nominal wireframe (stent) was assigned a Young's modulus of 160.1GPa and a Poisson ratio of 0.3. The leaflets were attached to the valve stent and modeled using quadrilateral large strain shell elements. Each leaflet had its own local coordinate system for material property definitions that were fully defined by the constitutive law, Eq. (10), which was incorporated into a user subroutine (UMAT). Details of the constitutive model implementation into ABAQUS (Providence, RI) have been previously presented (Sun and Sacks 2005). The contact between two leaflets was modeled using a master-slave contact pair (an option in ABAQUS). The leaflet that was stiffer in the radial direction was assigned the master surface while the other was specified as the slave surface. A quasi-static approach was used to analyze the deformation of the model from a stress-free position to a fully loaded configuration with the effects of fatigue by applying cyclic uniform pressure to a peak pressure of ∼120mmHg to the aortic side of the leaflet.
Fig. 1. BHV finite element model in the pressurized state overlapped with the initial undeformed geometry.
2.3 Determination of leaflet material properties
The unfatigued GLBP leaflet properties were defined by the Fung coefficients presented by Sun (2003) derived from biaxial tests for each of the three dissected GLBP leaflets of a CEP valve. The GLBP leaflet fatigue response was defined by the hypothetical GLBP fatigue parameters presented in our previous work (Martin and Sun 2013). The β and Dpsmax values were modified for this study. The parameters for defining the leaflet properties are given in Table 1. The amount of damage per simulated cycle was scaled up to reflect approximately 10 × 106 cycles real time based on the fatigue model parameters. However, it is important to note that although these fatigue model parameters were able to capture the GLBP uniaxial fatigue response in the loading direction, these parameters were not rigorously determined due to limited experimental data. Therefore, the amount of damage at certain cycle states may not be accurate, and we use the variable, N, to nominalize the simulated cycle state. Although the exact timing of fatigue effects cannot be predicted, this model may be a very useful tool to assess the effects of altered leaflet and stent properties on BHV durability through well-controlled, side-by-side comparison.
Table 1. Leaflet material and fatigue properties.
| Un-fatigued state Fung parameters | |||||||
|---|---|---|---|---|---|---|---|
|
| |||||||
| Specimen | c (kPa) | A1 | A2 | A3 | A4 | A5 | A6 |
| Leaflet 1 (L1) | 14.42 | 61.27 | 70.37 | 5.11 | 14.20 | 3.10 | 2.01 |
| Leaflet 2 (L2) | 9.95 | 56.85 | 192.18 | 1.00 | 34.00 | 2.00 | 4.00 |
| Leaflet 3 (L3) | 25.32 | 21.82 | 274.77 | 15.66 | 50.41 | 2.00 | 41.86 |
| Fatigue model parameters | ||||||||||
|---|---|---|---|---|---|---|---|---|---|---|
|
| ||||||||||
| Specimen |
|
|
nmax (N) | Dpsmax11 | Dpsmax12 | Dpsmax22 | α | β | ||
| All leaflets | 4.67 | 431,840.00 | 36.80 | 0.10 | 0.05 | 0.10 | 1.00 | 10.0 | ||
2.4 Parametric study of the effect of leaflet and stent properties on BHV durability
In an effort to investigate the effects of leaflet and stent material properties on the BHV durability, we conducted a parametric study. The effect of the unfatigued leaflet properties was tested by comparing three nominal valve cases: L1—all three leaflets were assigned the L1 property (Fig. 2a), L2—all leaflets were assigned the L2 property (Fig. 2b), and L3—all leaflets were assigned the L3 property (Fig. 2c). The effect of mismatched leaflets was tested by comparing three additional cases: L1/L2/L3—each leaflet was assigned a distinct unfatigued property, 2 L1/ L2—two leaflets were assigned the L1 property while the other was assigned the L2 property, and L1/ 2 L2—two leaflets were assigned the L2 property while the other was assigned the L1 property. The effect of valve stent-tip deflection was investigated by altering the stent modulus by ±40%, referred to as the 1.4E and 0.6E cases, respectively, in the L1 (L1 0.6E, L1 1.4E) and L2 (L2 0.6E, L2 1.4E) nominal valves. The Rigid case, where the stent modulus was unchanged, albeit all degrees of freedom of the stent were fixed in space to prevent any stent-tip deflection, was also studied. Each BHV model was subjected to up to 30N simulated cycles of fatigue.
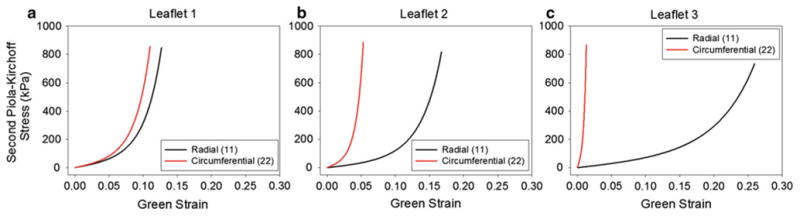
Fig. 2. Equi-biaxial response for each leaflet property: a L1, b L2, and c L3, in the radial and circumferential directions.
3 Results
3.1 Effect of cyclic loading on BHV function
Cyclic loading induced leaflet material property and geometry changes in each case. Some degree of fatigue damage was evident in each of the leaflets, with peak damages on the aortic side of the leaflets, for each of the BHVs studied. This damage caused the leaflets to “sag” in all cases. Figure 3a, b shows the overlaid leaflet geometry for the L1 valve at the 0N and 30N states under ∼120 mmHg pressure. The leaflet free edge was lowered, but leaflet coaptation was maintained by leaflet sagging particularly in the belly region of the leaflet. Leaflet fatigue damage also induced changes in the leaflet stress distribution. Contour plots of the max principal stress in the L1 valve leaflet at the 0N (Fig. 3c) and 30N (Fig. 3d) states show that the leaflet peak stress is originally along the suture attachment line on the aortic side of the leaflet, but at the highly fatigued state, the leaflet peak stress is located at the commissure on the ventricular side of the leaflet.
Fig. 3.
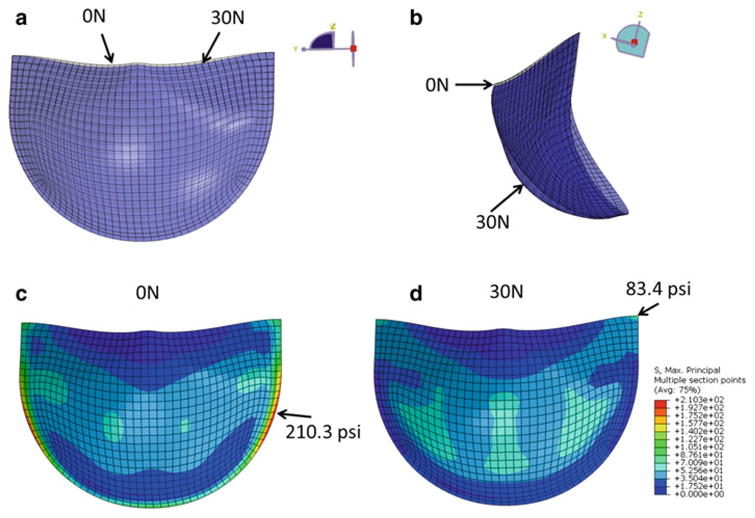
Overlaid L1 valve leaflet geometry in the fully pressurized state after 0N cycles of fatigue (gray) and 30N cycles of fatigue (blue). a (Front view) Sagging of the leaflet free edge at the 30N state and b (side view) increased curvature in the leaflet at the 30N state which is particularly pronounced in the belly region. The L1 leaflet max principal stress distribution on the aortic side of the leaflet at the c 0N and d 30N states. The arrows indicate the peak stress location
3.2 Leaflet property parametric study
In each simulation, the valve model was subjected to 20N cycles of pressurization. In three cases, the L3, L1/L2/L3, and 2 L1/L2 cases, the simulation diverged prior to the 20N cycle mark. The remaining three simulations completed successfully. The three nominal cases displayed very different initial leaflet stress distribution patterns (Fig. 4a), which translated to very different fatigue damage patterns (Fig. 4b). Both the L1 and L3 valves had high stress concentrations and fatigue damage along the suture attachment lines below the commissures. The L2 valve leaflets had much lower peak stresses that were located at the sides of the belly region, inwards from the suture attachments. The leaflet fatigue damage region was largest in the L1 valve. The damage was most significant along the suture attachments but also appeared along the belly and commissures. In the L2 valve, the fatigue damage was very minimal and in the region corresponding to the peak stresses, while in the L3 valve, in addition to the damage along the suture attachments, damage accumulated at the free edge due to twisting of the leaflets upon cyclic closure. The L1 and L2 nominal valves both displayed good leaflet coaptation and no fatigue damage at the leaflet free edge.
Fig. 4. Contour plots of the a max principal stress in psi at the unfatigued and fully loaded state and b the 9N state fatigue damage on the aortic side of the leaflet for each valve of the leaflet property parametric study.
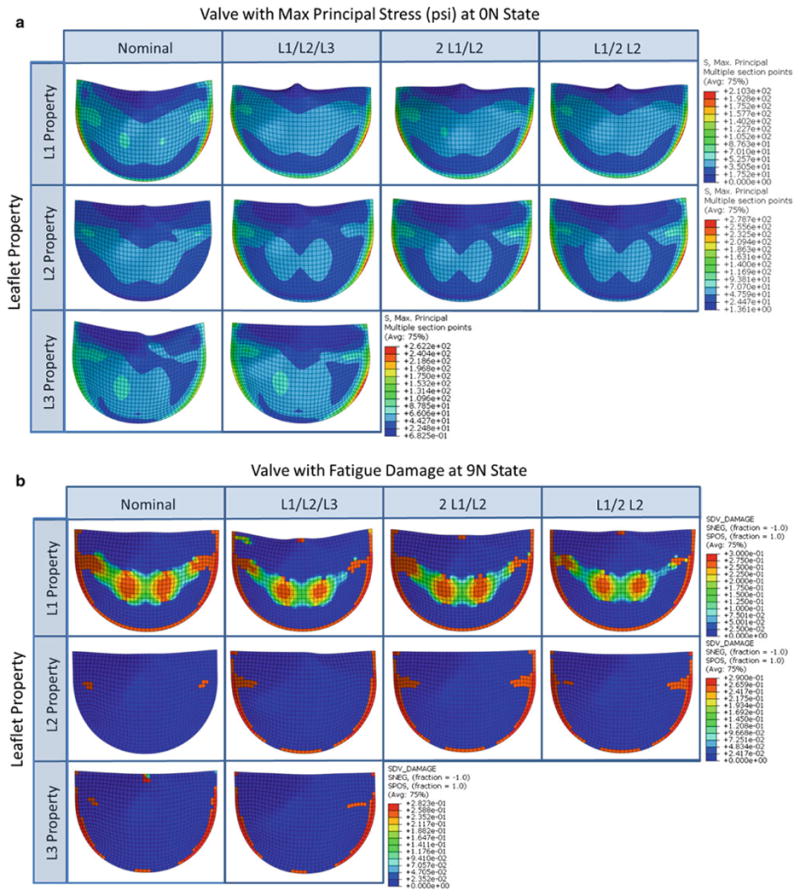
In the leaflet mismatch cases, the initial leaflet stresses, particularly along the commissures, increased in each leaflet (Fig. 4a), which accelerated fatigue damage in these regions (Fig. 4b). The L2 leaflet stress distribution in the mismatch cases was altered dramatically with much higher peak stresses that moved toward the suture attachment lines. Fatigue damage was greatly accelerated in the L2 leaflet in each of the mismatch cases. The stress distributions and damage patterns in the L1 and L3 leaflets in the mismatch cases were similar to the respective nominal cases. However, a small amount of damage along the L1 leaflet free edge was induced in the mismatch cases due to the compromised leaflet coaptation in these cases, where one or two leaflets would “lean” over the others.
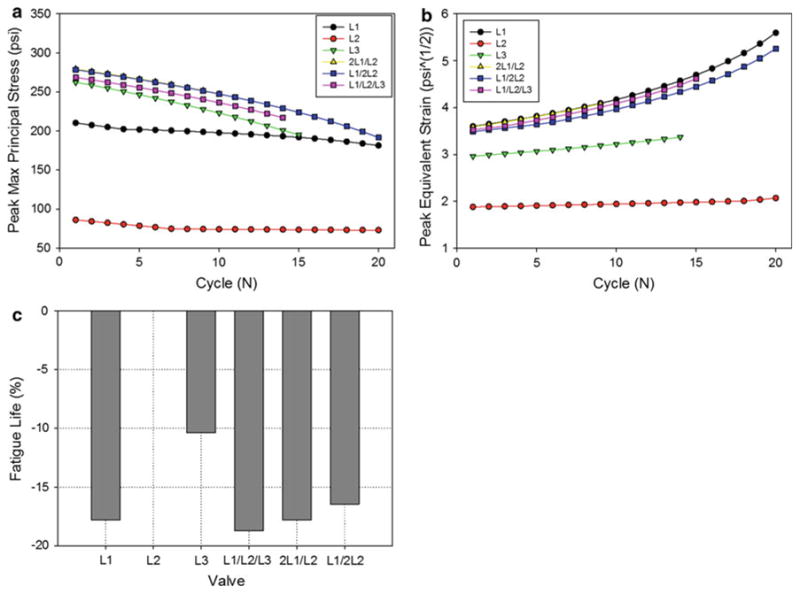
The leaflet peak stress, equivalent strain, and damage factor (Ds) were extracted at each cycle for each case (Fig. 5a–c). TheL2 valve displayed the lowest peak leaflet stresses, equivalent strains, and damage throughout cycling. Interestingly, of the nominal cases, the L3 valve had the highest initial peak stress, which was ∼25% higher than that of the L1 valve; however, the L1 valve had much higher peak equivalent strains throughout cycling, and consequently greater leaflet damage. The leaflet property mismatch cases all displayed higher peak leaflet stresses than the nominal cases; however, they displayed similar peak equivalent strains to the L1 valve throughout cycling. The damage factor in the L1/L2/L3 was accelerated compared to all other cases. Damage in the 2 L1/L2 and L1/2 L2 valves accumulated at a rate similar to the L1 valve. The peak damage factor versus cycle curve in each case was extrapolated to complete leaflet failure (Ds = 1) to estimate the fatigue life of each valve. Figure 5d shows the normalized fatigue life of each valve, to the L2 nominal valve. According to this analysis, the fatigue lives of the L1, L1/L2/L3, 2L1/L2, and L1/2 L2 valves were reduced by over 15 % compared to the L2 valve.
Fig. 5. The effect of leaflet material properties on the peak leaflet a maximum principal stress and b equivalent strain. c The normalized fatigue life of each valve compared to the L2 valve.
3.3 Stent property parametric study
In each simulation, the valve model was subjected to 20N cycles of pressurization. All eight altered stent simulations completed successfully. Changing the stent modulus altered the amount of stent-tip deflection in the L1 and L2 valves to similar degrees. The L1 and L2 nominal valves had stent-tip deflections of 5.3° and 5.9°, respectively. Decreasing the stent modulus by 40% (0.6E) increased the L1 and L2 stent-tip deflections to 8.0° and 8.8°, respectively. Increasing the stent modulus by 40% (1.4E) decreased the deflection in the L1 and L2 valves to 4.0° and 4.5°, respectively, while the “Rigid” formation prevented any stent deflection. Altering the stent modulus had a negligible effect on the L1 leaflet coaptation: In each case, there was a small gap between the leaflets upon closure. However, the stent modulus affected the leaflet coaptation of the L2 valve. The nominal L2 valve had perfect leaflet coaptation, and decreasing the modulus caused slight leaflet pin-wheeling in the L2 0.6E case. Increasing the L2 stent modulus caused a small gap upon valve closure in the L2 1.4E case and a more significant gap in the L2 Rigid case.
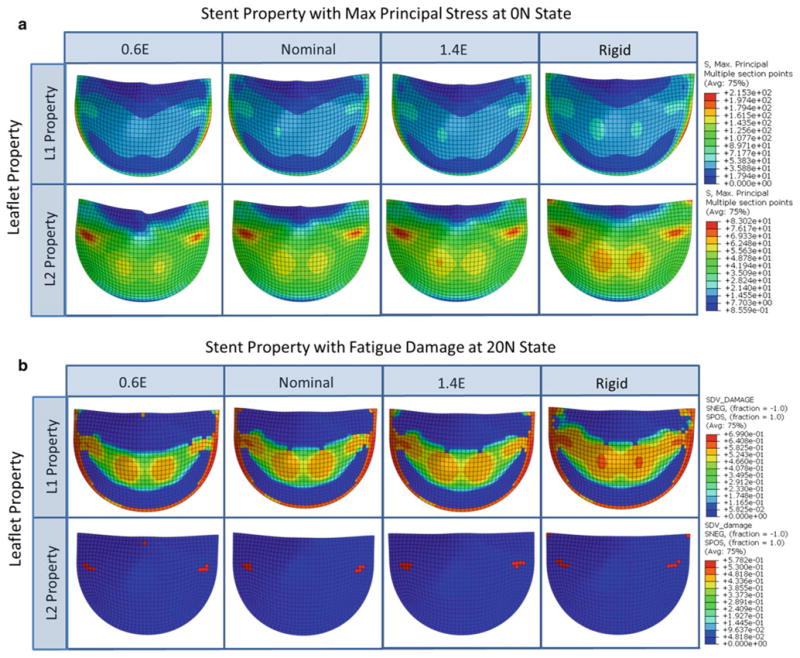
In both the L1 and L2 nominal valves, decreasing the degree of stent-tip deflection increased leaflet stresses particularly in the belly and commissure regions (Fig. 6a), which induced greater fatigue damage in these regions (Fig. 6b). For each of the L1 cases, the peak leaflet stresses were located along the leaflet suture attachments. The L2 nominal, L2 0.6E, and L2 1.4E valves all had leaflet peak stresses on the sides of the leaflet belly region, while the L2 Rigid valve had peak stresses at the commissures.
Fig. 6. Contour plots of the a max principal stress in psi at the unfatigued and fully loaded state and b the 20N state fatigue damage on the aortic side of the leaflet for each valve of the stent property parametric study.
The L1 leaflet peak stresses (Fig. 7a) and equivalent strains (Fig. 7c) throughout cycling were only minimally affected by the altered stent property, where increasing stent-tip deflection decreased leaflet stresses and equivalent strains. The trends were less consistent for the L2 valve, because the peak stresses and equivalent strains did not correspond to the same region of the leaflet in each case. All of the altered stent-tip deflection L2 cases resulted in higher initial peak leaflet stresses and equivalent strains than the nominal L2 (Fig. 7b, d). Similar to the leaflet property parametric study, the peak damage factor versus cycle curves for each valve in the stent property parametric study were extrapolated to estimate the valve fatigue life. The stent property had a minimal effect on the L1 valve fatigue life (Fig. 7e) of <1 %. For the L2 valve, the altered stent-tip deflection had a greater impact on the valve life (Fig. 7f), where the rigid stent reduced valve durability by ∼2.5%, although this is still not very significant.
Fig. 7.
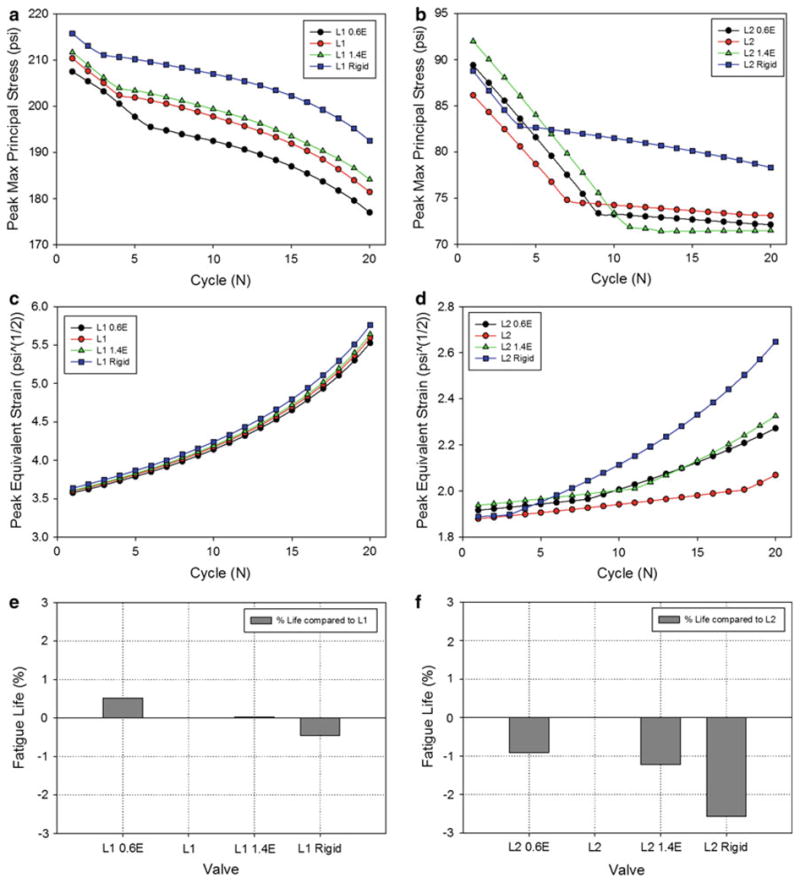
The effect of the stent elastic modulus on the peak L1 leaflet: a maximum principal stress and c equivalent strain observed during valve closure at each cycle. The effect of the stent elastic modulus on the peak L2 leaflet: b maximum principal stress and e equivalent strain observed during valve closure at each cycle. The normalized fatigue life of each of the e L1 and f L2 leaflet property valves with altered stent properties compared to the corresponding nominal valves
4 Discussion
4.1 Effect of cyclic loading on BHV function
The added effects of fatigue-induced stress softening and permanent set caused changes in the leaflet stress distributions and often the region of peak stress in the leaflet. Therefore, the region of peak stress in the unfatigued leaflet may not necessarily correspond to the ultimate failure region. Fatigue also caused the leaflets in each case to sag, particularly in the central belly region of the leaflet (Fig. 4). This phenomenon was also observed in porcine BHVs subjected to 500 × 106 cycles of accelerated wear testing (Smith et al. 1999), where the leaflets exhibited increased curvature particularly in the central belly region. The areas of increased curvature were correlated to areas with collagen fiber distortion (Smith et al. 1999) or damage, which agrees well with the simulated results. Leaflet sagging may increase the coaptation area throughout cycling and accelerate damage at the free edge of the leaflets.
4.2 Effect of leaflet properties on BHV durability
The results of this study suggest that BHV durability is highly dependent on the leaflet properties. Unsurprisingly, the best leaflet properties, L2 and L3, were highly anisotropic with higher stiffness in the circumferential direction, similar to the native valve property (Martin and Sun 2012). The worst leaflet property, L1, was nearly isotropic, which translated to fatigue damage over a much larger area of the leaflets compared to the L2 and L3 valves. The fact that the initial leaflet peak stresses in the L1 valve were lower compared to those of the L3 valve demonstrates that an initial peak leaflet stress analysis may not be appropriate for assessing valve durability. The initial peak leaflet equivalent strain may be a superior metric for assessing valve fatigue, because this value accounts for the total leaflet deformation.
The three leaflet property mismatch cases were associated with higher leaflet stresses and fatigue damage along the leaflet commissures and suture attachments compared to the nominal valves. This helps explain why mechanical failures of BHVs are often associated with leaflet tears in the vicinity of the commissures and/or suture attachments, regardless of the specific design (Trowbridge and Crofts 1987; Schoen and Levy 1999; Butany et al. 2007; Singhal et al. 2013). The L1/L2/L3 valve had the shortest fatigue life of all the valves studied. Fatigue damage was also accelerated in the 2 L1/L2 and L1/2 L2 valves compared with the L2 nominal valve. The damage in these valves was similar to that in the L1 nominal valve. Thus, the valve durability is only as good as the worst leaflet. However, the 2 L1/L2 and L1/2 L2 valves were slightly more durable than the L1/L2/L3 valve, which suggests that leaflet property homogeneity also plays a role in the valve durability and supports leaflet heterogeneity as a failure mode of pericardial BHVs (Trowbridge et al. 1986; Fleisher et al. 2004; Singhal et al. 2013). Of course in reality, it may be challenging to build BHVs with identical leaflet material properties; however, careful selection of the tissue used for fabrication may significantly improve the durability of BHVs. Indeed, leaflet sorting based on mechanical properties has been adopted by the heart valve industry for the BHV manufacturing process.
4.3 Effect of stent properties on BHV durability
As expected, reduction in the stent-tip deflection resulted in higher peak leaflet stresses and fatigue damage in the commissure regions. Mechanical failures of the IS valve were associated with tears in the leaflets along the free edges near the top of the struts (Brais et al. 1985; Schoen et al. 1987; Walley et al. 1992; Machida et al. 2001), which agrees with this result (Fig. 7b). Reduction in the stent modulus redistributed the peak stresses and fatigue damage away from the commissures, toward the leaflet free edge, yet did not always translate to better durability. At some minimum threshold stent-tip deflection value, leaflet fatigue damage will exceed that of the nominal stent.
In the L1 stent property parametric study, although increasing the degree of stent-tip deflection consistently resulted in lower leaflet stresses, equivalent strains, and fatigue damage particularly in the commissure regions, some degree of fatigue damage was accrued in the commissure regions in each case. This result is supported by the clinical finding that commissural tears continue to be a mechanism of BHV failure, even in designs with flexible stents (Vesely 2003).
In the L2 stent property parametric study, all of the altered stent cases resulted in higher leaflet stresses, equivalent strains, and fatigue damage than the nominal case. The incorporation of stent-tip deflection eliminated leaflet fatigue damage in the regions of the commissures completely, yet increased damage at the free edges. The leaflet peak stresses and equivalent strains over cycling followed a similar pattern for the L2, L2 0.6E, and L2 1.4E cases, likely because the peak values in each case corresponded to the same region of the leaflet, toward the sides of the belly region. The peak stresses and equivalent strains for the L2 Rigid leaflets followed a different pattern, but these peak values corresponded to different regions of the leaflets: the commissures. Leaflet fatigue damage seems to propagate differently in different regions. It is clear that the complexity of the BHV design can cause confounding effects on the durability. Overall, the degree of stent-tip deflection had a lesser impact on leaflet durability than the leaflet material properties and affected valves with different leaflet material properties differently.
4.4 Effect of leaflet coaptation on BHV durability
For clinical or experimental cases, where the full leaflet stress and equivalent strain distributions are unknown, the leaflet coaptation upon closure may also be a useful qualitative indicator of BHV durability. The L2 valve had essentially perfect leaflet coaptation and the least amount of fatigue damage in the leaflets. In the leaflet property mismatch cases, one or two of the leaflets would lean over the others due to the differences in stiffness of the contacting materials. The greater the disparity between the leaflets, the more appreciable the leaflet leaning upon closure became. The leaning was most significant in the L1/L2/L3 valve which had the greatest amount of fatigue damage. The leaning is also likely responsible for the high stress concentrations at the suture attachment lines in the L1/L2/L3, L1/2 L2, and 2 L1/L2 valves. Leaflet leaning may initiate a positive feedback mechanism for leaflet tearing. For instance, if a leaflet leans more to one side than to the other, higher stress will be applied to the opposing side of the leaflet along the suture attachment, and as that area becomes damaged, the leaflet leaning will become more pronounced.
Pin-wheeling of the leaflets may also compromise leaflet durability. In the L3 and reduced stent modulus cases, leaflet pin-wheeling upon closure induced fatigue damage at the leaflet free edge. Interestingly, the leaflet max principal stress is often low at the free edge despite high equivalent strains and damage in this region with leaflet pin-wheeling. This is because the leaflets undergo significant compressive strains in this region and the principal stress is actually at a minimum, which further supports the use of the equivalent strain in place of the max principal stress for assessing valve durability.
4.5 Limitations of this study
In this study, we assume a linear progression of the stress softening and permanent set factors at a given equivalent strain as a function of the number of loading cycles, whereas both values may evolve faster during the initial cycles. Also, the dependence of the peak equivalent strain on the fatigue-induced softening and permanent set is unknown. The fatigue damage model parameters were fit to experimental data collected at one peak equivalent strain value (Martin and Sun 2013). A more comprehensive data set is necessary to determine the true unique fatigue model parameters to capture the fatigued response of GLBP. However, although the amount of fatigue damage in each case presented here is dependent on the fatigue model parameters chosen which were not rigorously determined through experiments, this approach is valid for studying the effects of BHV design parameters on durability through well-controlled, side-by-side comparison. It is also important to note that the optimal BHV leaflet and stent properties presented here are likely valve design dependent.
Structural valve degeneration due to calcification was not considered in this study. Calcification tends to occur in the areas of high stress during function (Schoen et al. 1987); thus, the fatigue damage areas for each case presented here may also represent areas most susceptible to calcification. It has been suggested that calcific and noncalcific damage may be synergistic, where collagen disruption could expose new calcium nucleation sites or mechanical damage may occur due to stress concentrations created by local calcium deposits (Schoen 1991; Schoen and Levy 1999).
Finally, a structural-based strain energy function would be better for comparing the effect of material orientation on fatigue damage. For instance, due to the high stiffness of the collagen fibers compared to the compliant matrix, the stress/equivalent strain in the leaflet may be higher along the fiber direction, and thus, by using the Fung strain energy function, this model would predict fatigue damage to occur in the fiber direction. However, the equivalent strain threshold to induce fatigue for the fiber constituents is likely higher than that for the matrix, in which case fatigue damage may occur in the matrix components first. By using a structurally motivated strain energy function and defining the damage criterion in each constituent individually, this phenomenon can be captured. It may also be necessary to include non-affine deformation modes of the tissue constituents, i.e., fiber slippage or breakage, to determine the mechanisms of BHV leaflet fatigue damage. Because GLBP tissue is relatively homogeneous in structure, we assume that use of the Fung strain energy is acceptable. At this time, fatigue simulations with the Fung strain energy function are much more robust with better and faster convergence, which makes it attractive for simulations of long-term damage under complex loading.
5 Conclusions
In this study, GLBP fatigue was simulated for BHV applications. Stress softening and permanent set of the GLBP leaflets were incorporated in the material model to describe the fatigue damage of BHVs subjected to cyclic pressurization. The effects of the BHV leaflet and stent elastic properties on the durability of the leaflets were investigated in a parametric study. The following factors were associated with accelerated fatigue of the GLBP leaflets: heterogeneity of leaflet elastic properties, poor leaflet coaptation, and little stent-tip deflection. Each of these factors has long since been known to accelerate fatigue of BHVs (Brais et al. 1985; Trowbridge et al. 1986; Fleisher et al. 2004; Vesely 2008–2011; Singhal et al. 2013), but this is the first study to show that this is analytically the case. This computational approach to studying fatigue of BHV leaflets may be an invaluable tool for evaluating the durability of new BHV designs, including the next generations of transcatheter aortic valves (TAVs) which also often utilize chemically treated pericardium leaflets. Currently, the long-term durability of TAVs is unknown. Considering that TAVs typically have thinner leaflets than traditional BHVs, the stent is rigid, resulting in little to no stent-tip deflection, and leaflet coaptation may be compromised in the presence of aortic calcification (Sun et al. 2010), fatigue damage in TAVs will undoubtedly be a critical concern of the future.
Acknowledgments
Research for this project was funded in part by NIH HL104080 and HL108240 grants. Caitlin Martin is also supported by a NIH NRSA predoctoral fellowship.
Contributor Information
Caitlin Martin, Tissue Mechanics Laboratory, Biomedical Engineering Program and Mechanical Engineering Department, University of Connecticut, Storrs, CT 06269, USA.
Wei Sun, Email: wei.sun@bme.gatech.edu, Tissue Mechanics Laboratory, Biomedical Engineering Program and Mechanical Engineering Department, University of Connecticut, Storrs, CT 06269, USA; The Wallace H. Coulter Department of Biomedical Engineering, Georgia Institute of Technology, Technology Enterprise Park, Room 206, 387 Technology Circle, Atlanta, GA 30313-2412, USA.
References
- Brais MP, Bedard JP, et al. Ionescu–Shiley pericardial xenografts: follow-up of up to 6 years. Ann Thorac Surg. 1985;39(2):105–111. doi: 10.1016/s0003-4975(10)62547-7. [DOI] [PubMed] [Google Scholar]
- Brewer R, Mentzer R, et al. An in vivo study of the dimensional changes of the aortic valve leaflets during the cardiac cycle. J Thorac Cardiovasc Surg. 1977;74:645–650. [PubMed] [Google Scholar]
- Butany J, Nair V, et al. Carpentier–Edwards Perimount valves—morphological findings in surgical explants. J Cardiac Surg. 2007;22(1):7–12. doi: 10.1111/j.1540-8191.2007.00336.x. [DOI] [PubMed] [Google Scholar]
- Christie GW. Computer modelling of bioprosthetic heart valves. Eur J Cardiothorac Surg. 1992;6(Suppl 1):S95–S100. [PubMed] [Google Scholar]
- Cooley DA, Ott DA, et al. Ionescu–Shiley bovine pericardial bioprostheses: clinical results in 2,701 patients. In: Bodnar E, Yacoub M, editors. Biologic and bioprosthetic valves. Yorke Medical Books; New York: 1986. p. 177. [Google Scholar]
- Dorfmann A, Ogden RW. A constitutive model for the Mullins effect with permanent set in particle-reinforced rubber. Int J Solids Struct. 2004;41(7):1855–1878. [Google Scholar]
- Fleisher AG, Lafaro RJ, et al. Immediate structural valve deterioration of 27-mm Carpentier–Edwards aortic pericardial bioprosthesis. Ann Thorac Surg. 2004;77(4):1443–1445. doi: 10.1016/S0003-4975(03)01253-0. [DOI] [PubMed] [Google Scholar]
- Food and Drug Administration. Draft guidance for industry and FDA staff. Heart valves-investigational device exemption (ide) and premarket approval (pma) applications. 2010 submitted for comment, January 2010. [Google Scholar]
- Fung YC. Biomechanics: mechanical properties of living tissues. Springer; New York: 1993. [Google Scholar]
- Gabbay S, Bortolotti U, et al. Fatigue-induced failure of the Ionescu–Shiley pericardial xenograft in the mitral position. In vivo and in vitro correlation and a proposed classification. J Thorac Cardiovasc Surg. 1984;87(6):836–844. [PubMed] [Google Scholar]
- Gabbay S, Bortolotti U, et al. Long-term follow-up of the Ionescu–Shiley mitral pericardial xenograft. J Thorac Cardiovasc Surg. 1984;88(5 Pt 1):758–763. [PubMed] [Google Scholar]
- Haziza F, Papouin G, et al. Tears in bioprosthetic heart valve leaflets without calcific degeneration. J Heart Valve Dis. 1996;5(1):35–39. [PubMed] [Google Scholar]
- International Organization for Standardization. Cardiovascular implants. Cardiac valve prostheses. 2005 ANSI/AAMI/ISO 5840. [Google Scholar]
- Kim H, Lu J, et al. Dynamic simulation of bioprosthetic heart valves using a stress resultant shell model. Ann Biomed Eng. 2008;36(2):262–275. doi: 10.1007/s10439-007-9409-4. [DOI] [PubMed] [Google Scholar]
- Krucinski S, Vesely I, et al. Numerical simulation of leaflet flexure in bioprosthetic valves mounted on rigid and expansile stents. J Biomech. 1993;26(8):929–943. doi: 10.1016/0021-9290(93)90055-j. [DOI] [PubMed] [Google Scholar]
- Machida H, Ishibashi-Ueda H, et al. A morphologic study of Carpentier–Edwards pericardial xenografts in the mitral position exhibiting primary tissue failure in adults in comparison with Ionescu–Shiley pericardial xenografts. J Thorac Cardiovasc Surg. 2001;122(4):649–655. doi: 10.1067/mtc.2001.116202. [DOI] [PubMed] [Google Scholar]
- Martin C, Sun W. Biomechanical characterization of aortic valve tissue in humans and common animal models. J Biomed Mater Res Part A. 2012;100A(6):1591–1599. doi: 10.1002/jbm.a.34099. [DOI] [PMC free article] [PubMed] [Google Scholar]
- Martin C, Sun W. Modeling of long-term fatigue damage of soft tissue with stress-softening and permanent set effects. Biomech Model Mechanobiol. 2013;12:645–655. doi: 10.1007/s10237-012-0431-6. [DOI] [PMC free article] [PubMed] [Google Scholar]
- Munt B, Webb J. Percutaneous valve repair and replacement techniques. Heart. 2006;92(10):1369–1372. doi: 10.1136/hrt.2005.067371. Epub 2005 Dec 9. [DOI] [PMC free article] [PubMed] [Google Scholar]
- Nistal F, Artinano E, et al. Primary tissue valve degeneration in glutaraldehyde-preserved porcine bioprostheses: Hancock I versus Carpentier–Edwards at 4- to 7-years' follow-up. Ann Thorac Surg. 1986;42(5):568–572. doi: 10.1016/s0003-4975(10)60586-3. [DOI] [PubMed] [Google Scholar]
- Nistal F, Garcia-Satue E, et al. Comparative study of primary tissue valve failure between Ionescu–Shiley pericardial and Hancock porcine valves in the aortic position. Am J Cardiol. 1986;57(1):161–164. doi: 10.1016/0002-9149(86)90972-0. [DOI] [PubMed] [Google Scholar]
- Reul GJ, Jr, Cooley DA, et al. Valve failure with the Ionescu–Shiley bovine pericardial bioprosthesis: analysis of 2680 patients. J Vasc Surg. 1985;2(1):192–204. [PubMed] [Google Scholar]
- Schoen FJ, Fernandez J, et al. Causes of failure and pathologic findings in surgically removed Ionescu–Shiley standard bovine pericardial heart valve bioprostheses: emphasis on progressive structural deterioration. Circulation. 1987;76(3):618–627. doi: 10.1161/01.cir.76.3.618. [DOI] [PubMed] [Google Scholar]
- Schoen FJ. Pathology of bioprostheses and other tissue heart valve replacements. In: Silver MD, editor. Cardiovascular pathology. 2nd. Churchill Livingstone; New York: 1991. pp. 1547–1605. [Google Scholar]
- Schoen FJ, Levy RJ. Tissue heart valves: current challenges and future research perspectives. J Biomed Mater Res. 1999;47(4):439–465. doi: 10.1002/(sici)1097-4636(19991215)47:4<439::aid-jbm1>3.0.co;2-o. [DOI] [PubMed] [Google Scholar]
- Simo JC. On a fully three-dimensional finite-strain viscoelastic damage model: formulation and computational aspects. Comput Methods Appl Mech Eng. 1987;60(2):153–173. [Google Scholar]
- Singhal P, Luk A, et al. Bioprosthetic heart valves: impact of implantation on biomaterials. ISRN Biomater. 2013:1–14. [Google Scholar]
- Smith DB, Sacks MS, et al. Fatigue-induced changes in bioprosthetic heart valve three-dimensional geometry and the relation to tissue damage. J Heart Valve Dis. 1999;8(1):25–33. [PubMed] [Google Scholar]
- Sun W. Biomechanical simulations of heart valve biomaterials Department of Bioengineering. University of Pittsburgh, Pittsburgh; Doctor of Philosophy: 2003. p. 240. [Google Scholar]
- Sun W, Abad A, et al. Simulated bioprosthetic heart valve deformation under quasi-static loading. J Biomech Eng. 2005;127(6):905–914. doi: 10.1115/1.2049337. [DOI] [PubMed] [Google Scholar]
- Sun W, Sacks MS. Finite element implementation of a generalized Fung-elastic constitutive model for planar tissues. Biomech Model Mechanobiol. 2005;4(2–3):190–199. doi: 10.1007/s10237-005-0075-x. [DOI] [PubMed] [Google Scholar]
- Sun W, Li K, et al. Simulated elliptical bioprosthetic valve deformation: implications for asymmetric transcatheter valve deployment. J Biomech. 2010;43(16):3085–3090. doi: 10.1016/j.jbiomech.2010.08.010. [DOI] [PubMed] [Google Scholar]
- Trowbridge EA, Roberts KM, et al. Pericardial heterografts. Toward quality control of the mechanical properties of the glutaraldehyde-fixed leaflets. J Thorac Cardiovasc Surg. 1986;92(1):21–28. [PubMed] [Google Scholar]
- Trowbridge EA, Crofts CE. Pericardial heterograft valves: an assessment of leaflet stresses and their implications for heart valve design. J Biomech Eng. 1987;9(4):345–355. doi: 10.1016/0141-5425(87)90084-7. [DOI] [PubMed] [Google Scholar]
- Vesely I. Features of a long-lived tissue valve. 2008–2011 Retrieved April 16, 2013, from http://www.valvexchange.com/patients/index.html.
- Vesely I. The evolution of bioprosthetic heart valve design and its impact on durability. Cardiovasc Pathol. 2003;12(5):277–286. doi: 10.1016/s1054-8807(03)00075-9. [DOI] [PubMed] [Google Scholar]
- Vyavahare N, Ogle M, et al. Mechanisms of bioprosthetic heart valve failure: fatigue causes collagen denaturation and glycosaminoglycan loss. J Biomed Mater Res. 1999;46:44–50. doi: 10.1002/(sici)1097-4636(199907)46:1<44::aid-jbm5>3.0.co;2-d. [DOI] [PubMed] [Google Scholar]
- Walley VM, Keon CA, et al. Ionescu–Shiley valve failure II: experience with 25 low-profile expiants. Ann Thorac Surg. 1992;54(1):117–122. doi: 10.1016/0003-4975(92)91155-3. [DOI] [PubMed] [Google Scholar]
- Webb J, Pasupati S, et al. Percutaneous transarterial aortic valve replacement in selected high-risk patients with aortic stenosis. Circulation. 2007;7(116):755–763. doi: 10.1161/CIRCULATIONAHA.107.698258. [DOI] [PubMed] [Google Scholar]