Abstract
We employed direct-current electric fields (dcEFs) to modulate the chemotaxis of lung cancer cells in a microfluidic cell culture device that incorporates both stable concentration gradients and dcEFs. We found that the chemotaxis induced by a 0.5 μM/mm concentration gradient of epidermal growth factor can be nearly compensated by a 360 mV/mm dcEF. When the effect of chemical stimulation was balanced by the electrical drive, the cells migrated randomly, and the path lengths were largely reduced. We also demonstrated electrically modulated chemotaxis of two types of lung cancer cells with opposite directions of electrotaxis in this device.
INTRODUCTION
Cell migration plays an essential role in a broad range of physiological and pathological processes, such as embryogenesis, wound healing, and cancer metastasis.1, 2, 3 Chemotaxis, directional cell migration along concentration gradients of soluble factors, is essential in tumour progression and metastasis.3, 4 Therefore, it has been focus of intense research for the past three decades. In addition, physical parameters, such as mechanical loads, matrix stiffness, and electric fields, can also influence or mediate the migration of various types of cells.5, 6, 7, 8, 9 To understand the interplay between the chemotaxis and physical property-induced cell migration is thus highly desirable in the studies on cancer metastasis.
Recently, the electrotaxis (also called galvanotaxis) of cancer and other types of cells has drawn a lot of attention. The electrotaxis in tumour microenvironment has been proposed as an important migration cue for cancer cells.10, 11 In tissues surrounding a tumour, concentration gradients of various cytokines as well as direct-current electric fields (dcEFs) might appear simultaneously in the same or opposite directions; and therefore, the cancer cells can experience multiple combinations of chemical and electrical migration mediating factors. Such complicated conditions make the mechanisms of metastasis difficult to elucidate by using conventional cell culture platforms. Precise spatial and temporal controls on these chemical and physical stimulations are essential for the analyses of cellular responses to the multiple types of environmental factors.
Microfluidic cell culture devices enable real-time observation of cell behaviours in controlled microenvironments. To generate stable concentration gradients is among the most essential functions of microfluidic cell culture devices.12, 13, 14, 15, 16, 17 There have also been a number of microfluidic devices used in the investigation of cell electrotaxis and other responses to dcEFs.5, 9, 18, 19, 20, 21, 22, 23 It is therefore straightforward to combine the concentration gradients and dcEFs into a single device for quantitative comparisons between the influences of these two stimulations on cancer cell migration. However, because the requirements in the fluidic fields for stable concentration gradients and dcEFs could be different, careful design of the microfluidic channels would be needed for such studies on multiple cues of cell guidance. Li et al. developed a microfluidic device for investigating the migration of T cells in co-existing chemokine gradients and multiple dcEFs.22 But detailed quantitative assays about the efficacy of chemical concentration gradients and dcEFs require delicate and independent controls on the two stimulations to cells. In the present work, we made a microfluidic device that integrated a dcEF microchannel with a concentration gradient-generating design through channels of two different heights. In comparison to the previous microdevice, our design provided better EF homogeneity, smaller flow fields in the observation region, improved temperature homogeneity, and structure simplicity. Our results showed that the chemotaxis induced by the concentration gradients of epidermal growth factor (EGF) and the electrotaxis of lung cancer cells co-existed in this device. We compared the migration guidance effects of various magnitudes of EGF gradients and dcEF strengths and demonstrated the control on cancer cell chemotaxis with square waveforms of dcEFs.
MATERIALS AND METHODS
Microfluidic device preparation and test
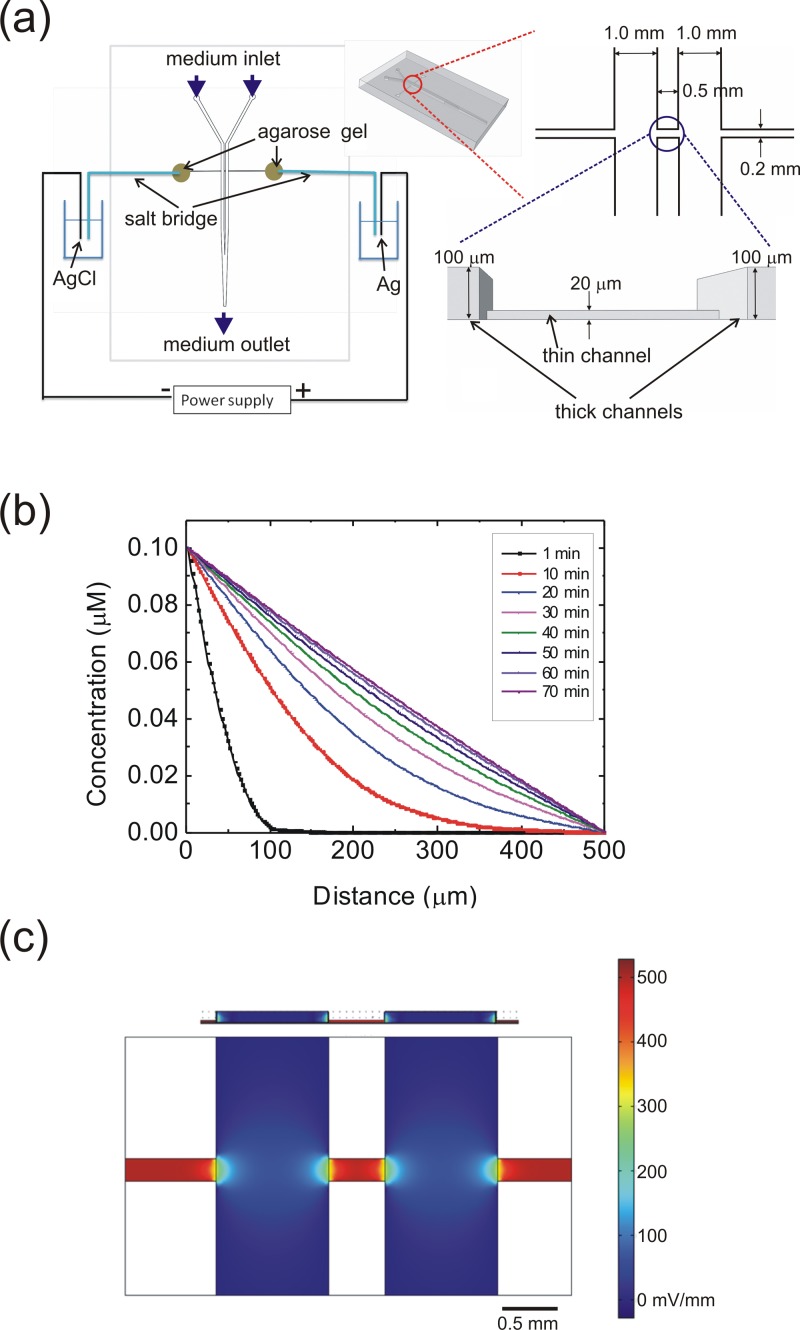
Figure 1a depicts the structure of the microfluidic device used in the present study. The whole device was made of polydimethylsiloxane (PDMS) by using standard soft-lithography microfabrication techniques with the master mold made of SU-8 negative photoresist. In order to establish stable concentration gradients in this device, we followed the two-layer channel design proposed by Saadi et al.13 The thin channel was defined by patterning a 20 μm layer of SU8-2025 and the two thick channels were defined by an additional 100 μm layer of SU8-2050. The PDMS replicas were made by casting PDMS over the SU-8 masters and then bonded on a glass slide with oxygen plasmas. The PDMS prepolymer (Sylgard 184, Dow Corning Co., Midland, MI) with a 1:10 (v/v) curing agent to base ratio was poured on the mold, de-gased in vacuum for 20–30 min, and then cured at 60 °C for 5 h. After curing, the PDMS layer was removed from the mold and bonded on a glass slide. The bonding was achieved by using oxygen plasma surface treatment (PX-250, Nordson MARCH Co., Concord, CA) at 90 W for 40 s. The flow rate of the oxygen was 60 sccm with a 0.3 torr base pressure. After bonding, the device was cured at 60 °C again for more than 2 h.
Figure 1.
(a) Setup and the detailed channel dimensions of the cell culture device used in the present study. (b) Simulated temporal evolution of the concentration along the thin channel after the injection of a 0.1 μM EGF into one of the thick channels at a flow rate of 100 μl/h. (c) Simulated EF strengths inside the channel with a driving current of 2.76 μA. Top, side view; bottom, bottom view of the channels. Because of the large difference in the channel cross section from the thick to the thin channel, most of the voltage drop and hence the EF occurs in the thin channel.
Because the concentration gradient as well as the uniform electric field were both applied inside the thin channel, the 0.5 mm × 0.2 mm area of the thin channel was used as the observation region in the experiments of cell migration. The cross sectional dimensions of the thin channel (20 μm high and 0.2 mm wide) were significantly smaller than those of the thick channels (100 μm high and 1.0 mm wide). Therefore, as we pumped a specific reagent into one of the thick channels, a stable concentration gradient would be established in the thin channel by diffusion. We also installed two electrode wells filled with agarose gel at the terminals of this thin channel such that a dcEF can be applied parallel to the direction of the concentration gradient. The dcEF was applied through an ion current established in two salt bridges connected to two bottles of phosphate buffered saline (PBS). The agarose concentration in the salt bridges was 1.5% in weight, dissolved in PBS. In the two PBS bottles, the anode was a silver (Ag) electrode, and the cathode was a AgCl electrode, both connected to a direct-current power supply (GPC-6030D, Good Will Instrument Co. Ltd., New Taipei City, Taiwan). When the power supply was turned on, the Cl- ions in the culture medium were moved from the AgCl cathode to the Ag anode, such that an ion current was formed.
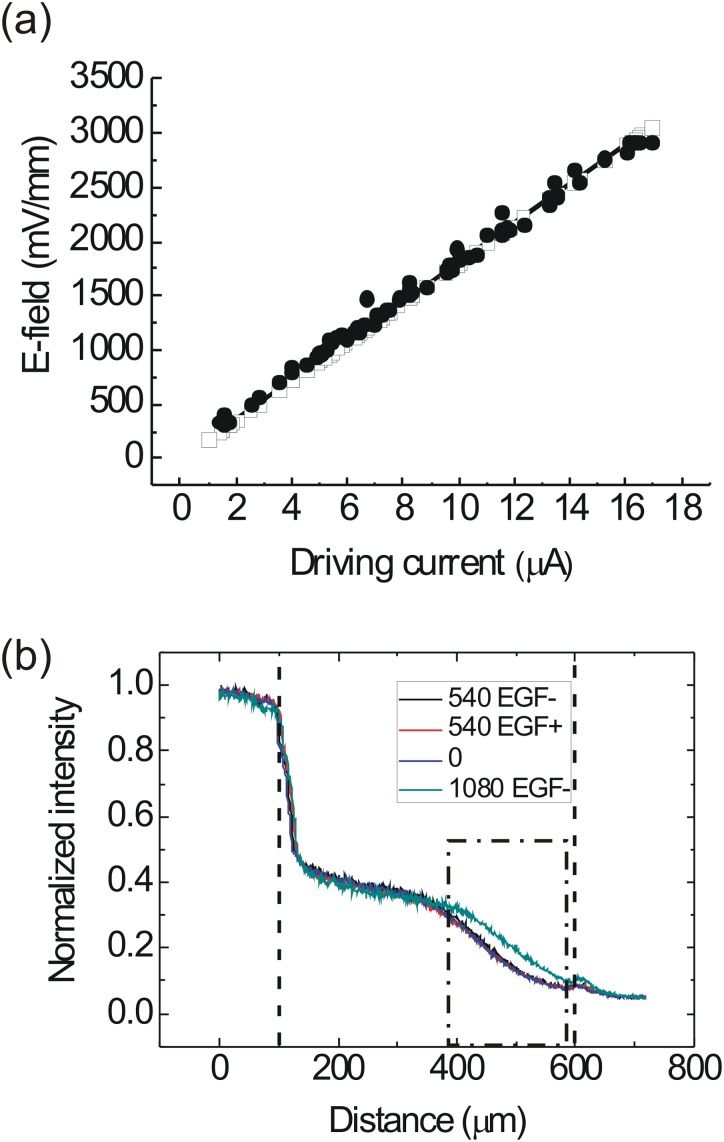
In order to estimate the concentration gradient and dcEF inside the thin channel, we conducted a finite element analysis by using COMSOL Multiphysics (COMSOL, Burlington, MA). In this simulation, the density of Dulbecco's Modified Eagle's Medium (DMEM) with supplements was set as 990 kg/m3, and the dynamic viscosity of DMEM was set as 10−3 kg/m/s, the same as that of water. We used the EGF diffusion constant as 1.66 × 10⁻⁶ cm2/s, reported by Thorne et al.24 Figures 1b, 1c show the calculated concentration gradient and electric field inside the thin channel. According to the simulation, a stable concentration gradient could be established ∼60 min after we injected a 0.1 μM EGF into one of the two thick channels at a volumetric flow rate of 100 μl/h. The simulation result in Fig. 1c shows that, within the 0.5 mm × 0.2 mm thin channel area, a uniform dcEF could exist when a 2.76 μA driving current was applied through the channel. The electric conductivity of the liquid used in this simulation was 1.38 S/m, the same as that of the culture medium used in the cellular experiments. In the simulation of dcEFs, we did not include the EGF because its concentration was only 0.1 μM in one of the two thick channels. The concentrations of most inorganic salts in the culture medium are on the order of 1–100 mM; and therefore, the addition of EGF would not cause a significant change of the electrical property of the culture medium. We also inserted two platinum electrodes into the observation area to measure the EFs by using the calibration procedures described in our previous work.21 The results in Fig. 2a measured in 8 devices confirmed the consistency between the simulation and experiments for the EF strength smaller than 3000 mV/mm.
Figure 2.
(a) Simulated (open square) and measured (solid circle) dcEF strength at various driving currents. The EFs were measured from 8 devices. (b) The concentration profiles of Alexa Fluor 488 EGF conjugate in the thin channel (between the two dashed lines) indicated by measured fluorescence intensity. The intensity measured in the whole observation region was normalized to the average intensity in the 100 μm high channel containing the EGF, measured in a 0.2 mm × 1.0 mm area close to the thin channel. In the plot legends, EGF+ represents that the anode was on the side of the EGF channel; while EGF- represents that the cathode was on the EGF side. The unit of EF is mV/mm. The distributions of EGF conjugate molecules were not affected by the EF until the EF strength was increased to 1080 mV/mm. In the cellular experiments, we only observed the migrating cells in the region within the dashed-dotted box, where the concentration gradients remained the same as the EF strength was smaller than 540 mV/mm.
In order to test if this device was suitable for the experiments with the dcEF and the concentration gradient simultaneously inside the observation area, we used Alexa Fluor 488 EGF conjugate (E13345, Molecular Probes, Life Technologies, Taipei, Taiwan) as the test reagent. EGF was selected because many reports suggest that it is closely related to various cellular responses to electrical stimulations.19, 21, 25, 26 However, because the isoelectric point of EGF is at pH 4.6,27 in the medium at pH ∼ 7, the EGF molecules could be negatively charged and tend to be attracted to the anode. Therefore, we directly measured the EGF concentration gradients with and without the application of the dcEFs. We injected 10 μM of the Alexa Fluor 488 EGF conjugate into one of the thick channels and the normal culture medium into the other, and then waited for at least 3 h before recording the fluorescence signal in the thin channel. The higher concentration of EGF used in this part of work was for a measurable fluorescence intensity within an acceptable exposure time. The media flowing into the two thick channels were stored in two syringes that were driven by the same pump of which the flow rate was set as 100 μl/h. The flow rate in the thick channels was one of the most critical parameters for this work. It controlled the length as well as the linearity of the region of a stable concentration gradient. A lower flow rate led to a large concentration plateau near the thick channel containing the EGF; while a higher flow rate produced a very sharp concentration gradient in a small region (<100 μm). Our measurements showed that a flow rate within 100 ± 20 μl/h was useful for achieving a stable and linear concentration gradient as shown in Fig. 2b. With the largest dcEF strength (540 mV/mm) used in the cellular experiments in the present work, the dcEF would not change the concentration gradients of EGF in the thin channel; no matter the EGF channel was on the anodal or the cathodal side. The concentration gradient remained the same even if the operation time was extended to 8 h. Therefore, we could compare the chemotaxis and electrotaxis of cancer cells by using this device with independent concentration gradient and dcEF settings. As we increased the dcEF to 1080 mV/mm and applied it on the thin channel for 8 h with the cathode and the EGF channel on the same side, the EGF molecules in the thin channel were more strongly attracted to the anode, and therefore the concentration gradient was flattened in comparison with the results with the 540 mV/mm dcEF. On the basis of the results in Fig. 2b, we could assume a linear concentration gradient of EGF while a dcEF smaller than 540 mV/mm existing in the thin channel of our device.
In comparison with the previous device for studying cell migration under both chemotactic and electrotactic effects reported by Li et al.,22 our device has the following improvements: (1) Better EF homogeneity: In the device in Ref. 22, the EF direction could make an angle as large as ∼45° to that of the chemical gradient in the observation region. In our device, the direction of EF was mostly parallel to that of the chemical gradient. Thus, the cell observation region had better EF homogeneity. (2) Smaller flow fields in the observation region: In the device in Ref. 22, the concentration gradient was provided by the lamellar flows established by two syringe pumps with a total flow rate 0.6 μl/min. In our device, the concentration gradient was generated by diffusion in the thin channel without an actively driven flow. Therefore, the flow field in the observation region was much smaller. A smaller flow field implicated smaller shear stress on the cells. (3) Improved temperature homogeneity: In Ref. 22, the major voltage drops were in the side channels, which were not used for cell observation. The relatively high EFs could induce unnecessary local joule heating. In our device, the major voltage drop occurred in coincidence with the observation region [as shown in Fig. 1c]. The side channels did not induce local joule heating. As a result, better temperature homogeneity could be expected. (4) Structure simplicity: In the device in Ref. 22, 20 side channels were used to help generate the dcEF. Our design used only two side channels, and hence it is much easier for scaling the whole device up or down.
Cell preparation
We cultured human lung adenocarcinoma cells CL1-5 in DMEM (11965, Gibco, Life Technologies, Taipei, Taiwan) supplemented with 10% fetal bovine serum and 1% antibiotic pen-strep-ampho. The CL1-5 cell line was selected based on its high invasion and migration abilities.28 In a previous work, we found that the CL1-5 cell tends to move toward the anode inside a microfluidic channel with dcEFs.18 Before being injected into the device, the cells were cultured at 37 °C in a 5% CO2 atmosphere incubator, and sub-cultured every 3–4 days. All experiments were performed with the CL1-5 cells that had undergone less than 30 passages. We replaced DMEM with Leibovitz L-15 medium (11415, Gibco, Life Technologies, Taipei, Taiwan) when conducting experiments in the microfluidic device to ensure a CO2-independent condition.
In the experiment of modulating cellular chemotaxis, we also employed the other type of lung cancer cell, A549, as a comparison. It has been shown that the A549 cell moves toward the cathode inside a dcEF;19 and therefore, this comparison could be intriguing for understanding responses of different types of cancer cells under multiple environmental stimulations. The culture medium of the A549 cell was Kaighn's modification of Ham's F-12 K Medium (21127, Gibco, Life Technologies, Taipei, Taiwan) with 10% fetal bovine serum and 1% antibiotic pen-strep-ampho.
Data analysis
The cells were observed by using a 10×, NA 0.25 objective installed on an inverted optical microscope. In the observation region, we selected only the cells well separated from others during the whole experiment as the targets for the migration analysis. The migration paths were recorded only when the cells were in the region of linear concentration gradients, marked as the region within the dashed-dotted box in Fig. 2b. The recording time for cell migration under each stimulation condition was 8 h. We captured one phase-contrast image of the cells every 5 min, and then plot the paths of migrating cells by using Chemotaxis and Migration Tool Ver. 2.0 (ibidi GmbH, Martinsried, Germany). For a clearer vision, in the path graphs, we show the positions of a cell with an interval of 20 min rather than 5 min. Typical migration paths of the cells are presented in Figs. 3a, 4a. The experimental data in Figs. 3b, 4b were obtained in more than three independent experiments. In each experiment, the migration paths of more than 15 cells were recorded.
Figure 3.
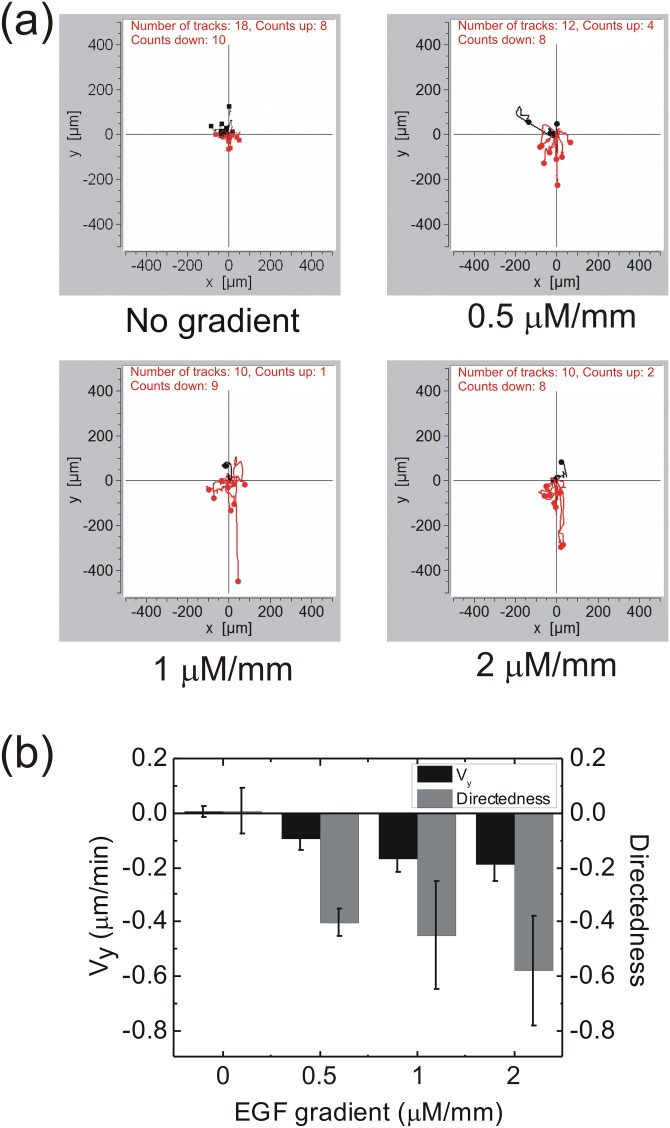
(a) CL1-5 cell migration paths under the influences of four EGF concentration gradients. The thick channel containing the EGF was in the negative y-direction. The black paths are those with the end in the positive y-axis region; while the red paths are those with the end in the negative y-axis region. (b) Directedness and Vy of cells under various EGF concentration gradients. Error bar, standard error of the mean.
Figure 4.
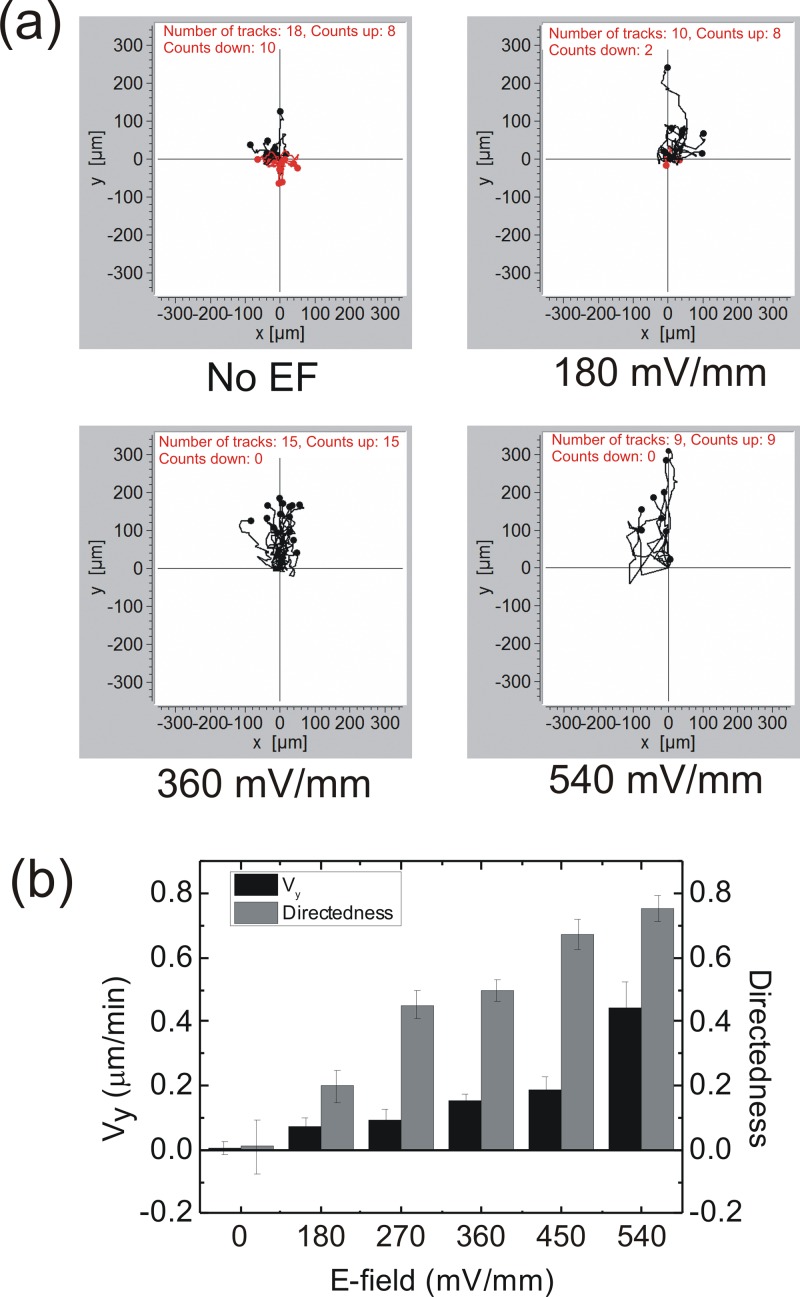
(a) CL1-5 cell migration paths under the influences of four dcEFs. The anode was in the positive y-direction. The black paths are those with the end in the positive y-axis region; while the red paths are those with the end in the negative y-axis region. (b) Directedness and Vy of cells under various strengths of dcEFs. Error bar, standard error of the mean.
For the analysis of the cell migration, we set the negative y-direction as the direction of the concentration gradient. We used two parameters to characterize the migration features under the chemical and electrical guidance: One is the directedness, defined as the displacement of a cell along the y-axis divided by the total displacement from the start to the end within the recording time. The other is the velocity along the y-axis (Vy), defined as the displacement along the y-axis divided by the recording duration.
RESULTS AND DISCUSSION
Independent chemotaxis and electrotaxis of the lung cancer cell
Figure 3b shows the migration directedness and Vy of CL1-5 cells under the influences of various concentration gradients of EGF. As the concentration gradient became larger, the directedness also increased, but Vy seemed to reach a maximum at ∼0.2 μm/min. We thus assume that the concentration gradient as a migration cue mainly affects the migration direction rather than the moving speed. Although the concentration gradients in the real device would be disturbed by the instability of flows in the thick channels, considering that the response time of cells could be several tens of minutes, we assume that instantaneous gradient variations would not cause significant influence on the directedness and Vy of the cell migration results.
Next, we characterized the electrotaxis of the CL1-5 cell in this device. In Fig. 4a, we show the cell migration toward the anode18, 29 under the stimulation of dcEFs in a range of 180–540 mV/mm. We used the EFs within this range because the strength of endogenous dcEFs in animal body is known to be 50–500 mV/mm.10, 11, 30 The activity of the cells in the device was not affected under a 540 mV/mm dcEF within 8 h. However, an EF strength larger than 900 mV/mm caused cell death in a few hours. Without the dcEF treatment, the migration of CL1-5 cells was random. With the increase in EF strengths, both the directedness and Vy of the CL1-5 cells increased, as shown in Fig. 4b. Therefore, we postulate that the dcEF actually enhances the directional migration of the CL1-5 cell. Together, the results in Figs. 34 suggest that the EGF concentration gradient mainly acts as a directional cue for cancer cell migration, while the dcEF has an additional effect on accelerating the migration speed up to 0.4 μm/min, at an EF strength of 540 mV/mm. Recently, Allen et al. reported a similar trend of the keratocyte migration speed accelerated with the EF strength, and conjectured that this effect could be related to the raise of medium temperature caused by the increased ion current.31
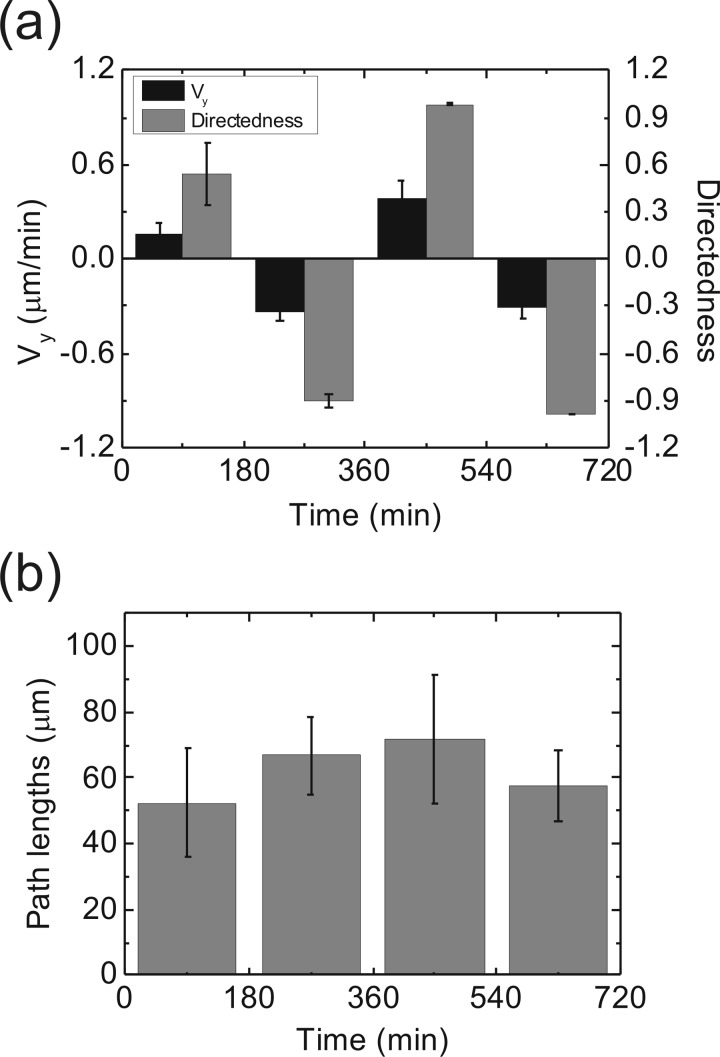
We also demonstrated the switching of migration direction and velocity by the dcEF. With a 360 mV/mm dcEF applied in the thin channel, we modulated the directedness and Vy of the CL1-5 cells in a consecutive way, as shown in Fig. 5. Each polarization condition was kept 3 h for a better visibility of the change in the migration characteristics. Experimentally we found that the migration direction of the cells could be reversed within ∼1 h. We also measured the total migration path lengths within 3 h along with the polarization switching [Fig. 5b] and confirmed that the changes of polarization did not reduce the cell migration ability, at least within the 12 h of observation in this experiment.
Figure 5.
(a) Directedness and Vy of CL1-5 cells under consecutive polarization reversions of a 360 mV/mm dcEF. Initially the anode was in the positive y-direction. The polarization was reversed at the 180th, 360th, and 540th min. Error bar, standard error of the mean. (b) Cell migration path lengths within 3 h while the polarization of the dcEF was reversed. The path lengths were not significantly changed by the polarization switching of the EF.
Cell migration in the presence of both the concentration gradient and the dcEF
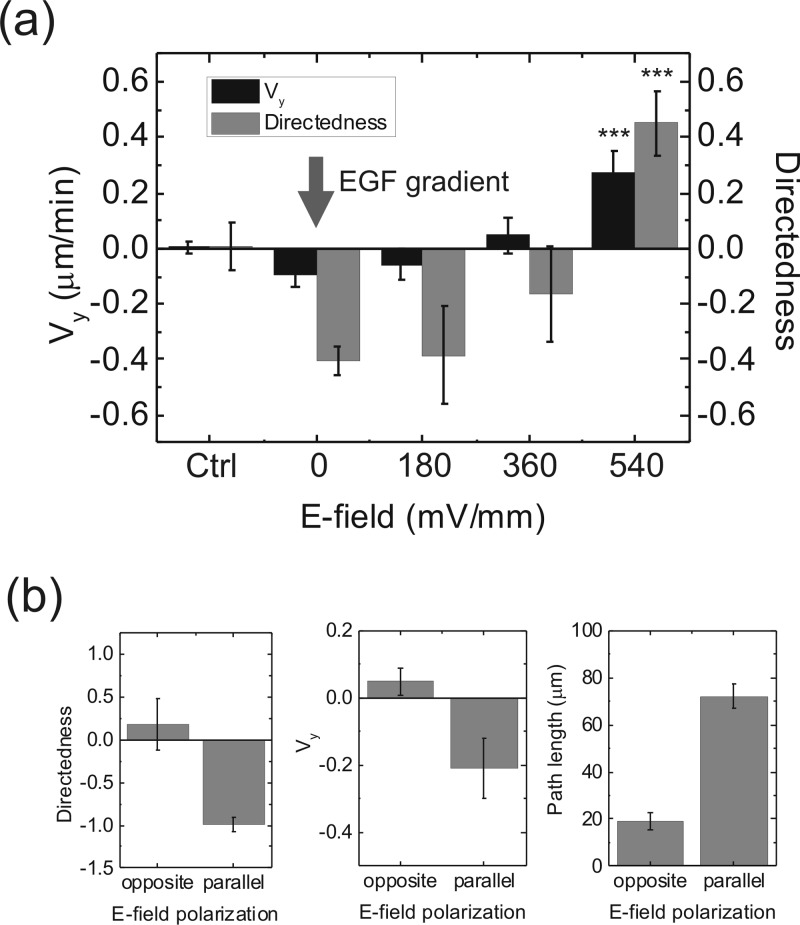
With the microfluidic device developed in the present work, we could quantify the strength of chemotaxis with the magnitudes of dcEFs. Figure 6a shows the directedness and Vy of the CL1-5 cells in a 0.5 μM/mm EGF concentration gradient and various dcEFs. We see that the chemotaxis induced by the EGF gradient is balanced by a 360 mV/mm dcEF in the opposite direction, and a 540 mV/mm dcEF completely overrides the chemotaxis. The p-values of the directedness and Vy between the EF = 0 and EF = 540 mV/mm groups were both smaller than 0.005. Because the CL1-5 cell exhibits anodal electrotaxis, we also analyzed their migration properties in a fixed EGF concentration gradient while the direction of the dcEF was reversed. The results in Fig. 6b show that, as the chemotaxis and electrotaxis are in the same direction (along the negative y-axis), the directedness and Vy were both enhanced, compared with those results with only one stimulation (Figs. 34). In contrast, the chemotactic behaviour induced by the EGF concentration gradient was largely suppressed when the electrotaxis was along the opposite direction. In addition, the total path lengths in the two conditions of dcEFs confirmed that the EF in the opposite direction indeed suppressed the migration ability inside the EGF concentration gradient, rather than just removing the directional guidance. However, this effect is reversible as long as the direction of the EF was switched to the parallel direction.
Figure 6.
(a) Directedness and Vy of CL1-5 cells under a 0.5 μM/mm EGF concentration gradient and various strengths of dcEFs. The EGF channel was in the negative y-direction; while the anode was in the positive y-direction. ***, p < 0.005 in comparison with the EF = 0 group. (b) Comparison of the migration directedness, Vy and path lengths of the cells under an EGF concentration gradient of 0.5 μM/mm and a dcEF of 360 mV/mm while the direction of EF polarization was reversed. Each direction of polarization was maintained for 8 h. Error bar, standard error of the mean.
It is known that EGF receptor molecules in the CL1-5 cell accumulate on the cathodal side of a cell under the dcEF stimulation, which is opposite to the direction of the electrotaxis.21 In a recent study, Tsai et al. further verified that the electrotaxis of the CL1-5 cell is independent of the EGF receptor-triggered pathways.29 But we were not sure if the concurrent effects of the EGF gradient and the dcEF could be superposed linearly. In Fig. 4, apparent electrotaxis was observed at a dcEF of 180 mV/mm. Nevertheless, in Fig. 6a, the directedness of the cells determined by the EGF gradient was not significantly changed until the dcEF reached 360 mV/mm. It seems that the EGF receptor-triggered cellular activities were not reduced by the dcEF. This result is consistent with the previous finding that the electrotaxis of the CL1-5 cell is independent of the EGF receptor-triggered pathways. In other words, the chemotaxis and electrotaxis can be regarded as two independent migration cues for the CL1-5 cell.
Modulating chemotaxis of cancer cells by using dcEF
Because the electric fields are easy to control and change, the information collected in the previous sections could be useful for modulating the chemotaxis of cancer cells. In addition, different types of cancer cells exhibit different electrotaxis behaviours, and the mechanisms governing the electrically induced responses may also be different. For example, the A549 lung cancer cell was found to migrate toward the cathode in a dcEF, and this property could be reduced by inhibitors of the EGF receptor.19 In contrast, the CL1-5 cell migrates toward the anode in a dcEF, and this behaviour is serum independent and EGF receptor independent.29 Therefore, the comparison between the migration properties of different types of cells would be valuable for the studies on electrotaxis.
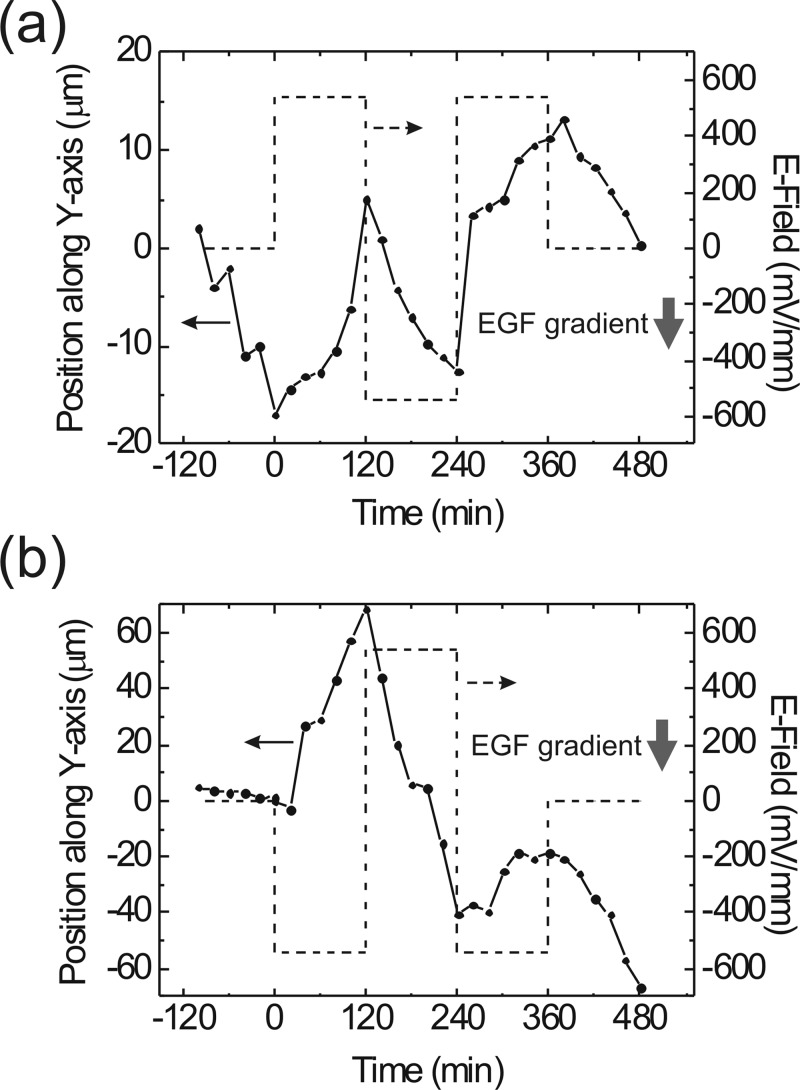
We established a 0.5 μM/mm EGF concentration gradient in the thin channel of this microfluidic device, and used a square-wave EF with a 540 mV/mm amplitude to modulate the chemotaxis of the CL1-5 cell and the A549 cell (see supplementary material).32 In order to identify the modulated motion trojectories from the cells' spontaneous movements, each polarization direction was maintained for 2 h. The direction of the EGF concentration gradient was toward the negative y-axis. Figure 7 shows the migration paths of these two types of cells. In Fig. 7a, a CL1-5 cell initially moved along the EGF concentration gradient, and then exhibited a clear directional change while the EF was turned on. Then the negative EF brought the cell back to the chemotaxis along the negative y-axis. We made the migration turn around again and then turned off the dcEF. Finally, the cell still exhibited chemotaxis along the EGF concentration gradient. For the A549 cell, we reversed the polarization of the EF square waveform, as shown in Fig. 7b. From the cell trajectory in Fig. 7b, we can tell that the chemotaxis of the A549 cell was not as significant as that of the CL1-5 cell. Therefore, the A549 cell migration was dominated by the EF waveform. Because the A549 cell in Fig. 7b experienced no EF at 0 min, its response to the −540 mV/mm EF bias was significant at the beginning of the electrical modulation. We noticed that this cell migrated for ∼110 μm from 120 to 240 min under the chemotaxis and electrotaxis in the same direction. Its directional migration behavior was much more obvious than that of the CL1-5 cell in Fig. 7a. Therefore, the reverse of the EF polarization at 240 min on this A549 cell could not result in an effective directional reverse with the same strength as that at 0 min.
Figure 7.
(a) Migrating trajectory of a CL1-5 cell in a 0.5 μM/mm EGF concentration gradient with the modulation of a 540 mV/mm EF in a square waveform. (b) Migrating trajectory of an A549 cell in the same conditions as those in (a). The CL1-5 cell exhibits an anodal electrotaxis, while the A549 cell migrates toward the cathode.
The results in Fig. 7 indicate that the electrical modulation on the chemotaxis of A549 cell could be more efficient than the case of the CL1-5 cell. Such a comparison will be useful for further understanding of electrical perturbations on the signalling pathways of chemotaxis in different types of cells.
CONCLUSION
In the present work, we built a microfluidic device for stimulating living cancer cells with both dcEFs and concentration gradients of EGF. This microfluidic device allowed long-term and real-time studies of cellular activities under the influences of the two migration cues. For lung cancer cells with high migration and invasion abilities, we quantified the migration directedness and velocity along the directions of both the concentration gradient and the dcEF separately. Then, we demonstrated the antagonism on cell migration guidance between the EGF concentration gradient and the dcEF in contrary directions. We found that a 0.5 μM/mm gradient of EGF can nearly be balanced by a 360 mV/mm dcEF. However, if we reversed the polarization of the dcEF, the chemotaxis induced by the EGF concentration gradient worked with the electrotaxis synergistically. Finally, we showed the chemotaxis of two types of lung cancer cells, CL1-5 and A549 cells, modulated by a square waveform of dcEFs.
With the rapid development of bio-compatible microelectronic technologies, the electrotaxis effects of cancer cells will play important roles in the control or therapy of metastatic tumours. The microfluidic devices incorporating the electrical stimulation with other migration cues, such as concentration gradients or substrate mechanical properties, will be very useful for the characterization of cancer cell motility in the tumour microenvironment filled with various physical and chemical stimulations. Other fields related to the cell migration and the environmental properties, e.g., neuronal development, could also benefit from such a device.
ACKNOWLEDGMENTS
This work was financially supported by the National Science Council of Taiwan (Contracts NSC 100-2112-M-001-022-MY3 and 101-2220-E-002-011).
References
- Muller A., Homey B., Soto H., Ge N., Catron D., Buchanan M. E., McClanahan T., Murphy E., Yuan W., Wagner S. N., Barrera J. L., Mohar A., Verastegui E., and Zlotnik A., Nature 410, 50 (2001). 10.1038/35065016 [DOI] [PubMed] [Google Scholar]
- Luster A. D., Alon R., and von Andrian U. H., Nat. Immunol. 6, 1182 (2005). 10.1038/ni1275 [DOI] [PubMed] [Google Scholar]
- Roussos E. T., Condeelis J. S., and Patsialou A., Nat. Rev. Cancer 11, 573 (2011). 10.1038/nrc3078 [DOI] [PMC free article] [PubMed] [Google Scholar]
- Joyce J. A. and Pollard J. W., Nat. Rev. Cancer 9, 239 (2009). 10.1038/nrc2618 [DOI] [PMC free article] [PubMed] [Google Scholar]
- Song B., Gu Y., Pu J., Reid B., Zhao Z., and Zhao M., Nat. Protocols 2, 1479 (2007). 10.1038/nprot.2007.205 [DOI] [PubMed] [Google Scholar]
- Wirtz D., Konstantopoulos K., and Searson P. C., Nat. Rev. Cancer 11, 512 (2011). 10.1038/nrc3080 [DOI] [PMC free article] [PubMed] [Google Scholar]
- Plotnikov S. V., Pasapera A. M., Sabass B., and Waterman C. M., Cell 151, 1513 (2012). 10.1016/j.cell.2012.11.034 [DOI] [PMC free article] [PubMed] [Google Scholar]
- Huang J.-W., Pan H.-J., Yao W.-Y., Tsao Y.-W., Liao W.-Y., Wu C.-W., Tung Y.-C., and Lee C.-H., Lab Chip 13, 1114 (2013). 10.1039/c2lc41050h [DOI] [PubMed] [Google Scholar]
- Song S., Han H., Ko U. H., Kim J., and Shin J. H., Lab Chip 13, 1602 (2013). 10.1039/c3lc41240g [DOI] [PubMed] [Google Scholar]
- Mycielska M. E. and Djamgoz M. B. A., J. Cell Sci. 117, 1631 (2004). 10.1242/jcs.01125 [DOI] [PubMed] [Google Scholar]
- McCaig C. D., Song B., and Rajnicek A. M., J. Cell Sci. 122, 4267 (2009). 10.1242/jcs.023564 [DOI] [PubMed] [Google Scholar]
- Lin F. and Butcher E. C., Lab Chip 6, 1462 (2006). 10.1039/b607071j [DOI] [PubMed] [Google Scholar]
- Saadi W., Rhee S. W., Lin F., Vahidi B., Chung B. G., and Jeon N. L., Biomed. Microdevices 9, 627 (2007). 10.1007/s10544-007-9051-9 [DOI] [PubMed] [Google Scholar]
- Cheng J.-Y., Yen M.-H., Kuo C.-T., and Young T.-H., Biomicrofluidics 2, 024105 (2008). 10.1063/1.2952290 [DOI] [PMC free article] [PubMed] [Google Scholar]
- Shamloo A., Ma N., Poo M.-m., Sohn L. L., and Heilshorn S. C., Lab Chip 8, 1292 (2008). 10.1039/b719788h [DOI] [PubMed] [Google Scholar]
- Hsu T.-H., Yen M.-H., Lia W.-Y., Cheng J.-Y., and Lee C.-H., Lab Chip 9, 884 (2009). 10.1039/b814405b [DOI] [PubMed] [Google Scholar]
- Huang Y., Agrawal B., Sun D., Kuo J. S., and Williams J. C., Biomicrofluidics 5, 013412 (2011). 10.1063/1.3555195 [DOI] [PMC free article] [PubMed] [Google Scholar]
- Huang C.-W., Cheng J.-Y., Yen M.-H., and Young T.-H., Biosens. Bioelectron. 24, 3510 (2009). 10.1016/j.bios.2009.05.001 [DOI] [PubMed] [Google Scholar]
- Yan X., Han J., Zhang Z., Wang J., Cheng Q., Gao K., Ni Y., and Wang Y., Bioelectromagnetics 30, 29 (2009). 10.1002/bem.20436 [DOI] [PubMed] [Google Scholar]
- Li J., Nandagopal S., Wu D., Romanuik S. F., Paul K., Thomsonc D. J., and Lin F., Lab Chip 11, 1298 (2011). 10.1039/c0lc00371a [DOI] [PubMed] [Google Scholar]
- Wang C.-C., Kao Y.-C., Chi P.-Y., Huang C.-W., Lin J.-Y., Chou C.-F., Cheng J.-Y., and Lee C.-H., Lab Chip 11, 695 (2011). 10.1039/c0lc00155d [DOI] [PubMed] [Google Scholar]
- Li J., Zhu L., Zhang M., and Lin F., Biomicrofluidics 6, 024121 (2012). 10.1063/1.4718721 [DOI] [PMC free article] [PubMed] [Google Scholar]
- Huang Y.-J., Samorajski J., Kreimer R., and Searson P. C., PLoS One 8, e59447 (2013). 10.1371/journal.pone.0059447 [DOI] [PMC free article] [PubMed] [Google Scholar]
- Thorne R. G., Hrabetová S., and Nicholson C., J. Neurophysiol. 92, 3471 (2004). 10.1152/jn.00352.2004 [DOI] [PubMed] [Google Scholar]
- Fang K. S., Ionides E., Oster G., Nuccitelli R., and Isseroff R. R., J. Cell Sci. 112, 1967 (1999). [DOI] [PubMed] [Google Scholar]
- Pu J., McCaig C. D., Cao L., Zhao Z., Segall J. E., and Zhao M., J. Cell Sci. 120, 3395 (2007). 10.1242/jcs.002774 [DOI] [PubMed] [Google Scholar]
- Taylor J. M., Mitchell W. M., and Cohen S., J. Biol. Chem. 247, 5928 (1972). [PubMed] [Google Scholar]
- Chu Y. W., Yang P. C., Yang S. C., Shyu Y. C., Hendrix M. J. C., Wu R., and Wu C. W., Am. J. Respirat. Cell Mol. Biol. 17, 353 (1997). 10.1165/ajrcmb.17.3.2837 [DOI] [PubMed] [Google Scholar]
- Tsai H.-F., Huang C.-W., Chang H.-F., Chen J. J. W., Lee C.-H., and Cheng J.-Y., PLoS One 8, e73418 (2013). 10.1371/journal.pone.0073418 [DOI] [PMC free article] [PubMed] [Google Scholar]
- Iglesia D. D. S. and Vanable J. W., Wound Rep. Reg. 6, 531 (1998). 10.1046/j.1524-475X.1998.60606.x [DOI] [PubMed] [Google Scholar]
- Allen G. M., Mogilner A., and Theriot J. A., Curr. Biol. 23, 560 (2013). 10.1016/j.cub.2013.02.047 [DOI] [PMC free article] [PubMed] [Google Scholar]
- See supplementary material at http://dx.doi.org/10.1063/1.4870401 for the time-lapse video of the CL1-5 cell chemotaxis under the EF modulations and for the time-lapse video of the A549 cell chemotaxis under the EF modulations.


