

Abstract
The interplay between chemical and mechanical signals plays an important role in cell biology, and integrin receptors are the primary molecules involved in sensing and transducing external mechanical cues. We used integrin-specific probes in molecular tension fluorescence microscopy to investigate the pN forces exerted by integrin receptors in living cells. The molecular tension fluorescence microscopy probe consisted of a cyclic Arg-Gly-Asp-D-Phe-Lys(Cys) (cRGDfK(C)) peptide tethered to the terminus of a polyethylene glycol polymer that was attached to a surface through streptavidin-biotin linkage. A fluorescence resonance energy transfer mechanism was used to visualize tension-driven extension of the polymer. Surprisingly, we found that integrin receptors dissociate streptavidin-biotin tethered ligands in focal adhesions within 60 min of cell seeding. Although streptavidin-biotin binding affinity is described as the strongest noncovalent bond in nature, and is ∼106 - 108 times larger than that of integrin-RGD affinity, our results suggest that individual integrin-ligand complexes undergo a marked enhancement in stability when the receptor assembles in the cell membrane. Based on the observation of streptavidin-biotin unbinding, we also conclude that the magnitude of integrin-ligand tension in focal adhesions can reach values that are at least 10 fold larger than was previously estimated using traction force microscopy-based methods.
Introduction
In multicellular organisms, the task of sensing and transducing mechanical signals across the lipid membrane is primarily mediated through the integrin family of receptors, which are heterodimeric proteins composed of α- and β-subunits spanning the cell membrane (1). There has been intense effort aimed at better understanding how these receptor molecules probe mechanical and chemical cues within the surrounding extracellular matrix (ECM) and convert molecular tension into chemical signals (2). In general, integrin activation results in recruitment of adaptor proteins, such as talin and vinculin, which link the filamentous actin (f-actin) cytoskeleton to integrin receptors and trigger the formation of supramolecular focal adhesion structures responsible for signaling to downstream effectors. Increased mechanical tension generally stimulates the growth and assembly of focal adhesions (3). However, tension can also lead to the disassembly of focal adhesions at the receding edge of a cell, thus allowing for processes such as cell migration (4). Therefore, integrins display complex mechanochemical responses and, in the absence of methods to directly image single molecule tension within integrin-ligand complexes, the interplay between chemical and physical signals will remain difficult to fully understand, particularly in light of recent evidence for oscillatory force behavior within focal adhesions (5), as well as the observation of a minimum force requirement for cell adhesions (6).
Two main methods are widely used to estimate the forces that cells generate against their surrounding matrix environment. The first, which is called traction force microscopy, relies on culturing cells on soft compliant polymer films (polyacrylamide gels, for example) that deform under tension (7). These deformations are then deconstructed using computational finite element analysis to calculate the lateral force vectors applied to micrometer elements. Using this method, the literature estimate for integrin tension within focal adhesions is approximately 2-3 pN per receptor (see Schwarz, et al. 49). This is a computationally intensive and challenging approach given the uncertainty of deformation in the regions between each element. A second approach uses arrays of polydimethylsiloxane polymer microneedles, with known spring constant, that bend in response to lateral cell forces (8). In these methods, optical microscopy tracks microscopic substrate deformations to generate lateral force maps across entire cells, thus enabling the vast majority of quantitative measurements of cell-matrix interactions. Nonetheless, quantifying substrate deformation is indirect and the inherent bulk nature of these probes obscures the molecular, temporal, and spatial details of integrin tension that underpin biochemical signaling. Given that tension is exerted through individual integrin receptors, molecular force sensors with pN sensitivity are needed to better characterize mechanotransduction pathways in living cells (9).
We recently invented a technique termed molecular tension-based fluorescence microscopy (MTFM) to image the forces exerted by cell surface receptors (10). MTFM uses a probe molecule composed of a discrete polyethylene glycol (PEG) linker flanked by a fluorophore and a quencher that undergo fluorescence resonance energy transfer (FRET), or nanosurface energy transfer, and thus report on the overall conformation of the PEG linker. The surface grafted PEG chain adopts a predictable and quantifiable mushroom conformation (11), and whereas one terminus is anchored to a surface, the other terminus is modified with a ligand that binds to a specific cell surface receptor. Consequently, the PEG chain will reversibly extend from its relaxed conformation in response to mechanical tension exerted by receptor molecules. In its initial proof-of-concept demonstration, the head of the MTFM PEG chain was conjugated to the epidermal growth factor, which was fluorescently tagged, whereas the PEG tail was anchored to a surface using biotin bound to quencher-modified streptavidin. Because the fluorophore concentration remains fixed and is nonmobile, FRET efficiency values are determined solely by the donor emission intensity in the presence and absence of acceptor. Therefore, only a conventional fluorescence microscope is needed to visualize the forces applied between a specific receptor and its cognate ligand. More recently, we demonstrated the flexibility of MTFM by tethering the probes to the surface of gold nanoparticles and employed nanosurface energy transfer readout to image integrin cell traction forces (12). To the best of our knowledge, MTFM (10) and recently reported variants (12, 13) provide the only reported method to visualize pN molecular forces exerted between cell surface receptors and their ligands.
Herein, we investigate the use of FRET-based MTFM to image integrin receptor-mediated tension in living cells (Fig. 1 a). By generating three different MTFM integrin probes and running an array of controls, we found that integrin receptors exert forces sufficient to dissociate streptavidin-biotin complexes, the highest affinity noncovalent interaction in nature (14). These findings are important because a), to the best of our knowledge, this is the first report of a protein-ligand interaction that is apparently stronger than the streptavidin-biotin association; b), it suggests that integrin receptors exert molecular forces much larger than had been predicted or reported previously; and c), these results show that isolated single molecule measurements can drastically diverge from results obtained using biomolecules within their native supramolecular environment. In general, these results underscore the need for using MTFM to study the diverse cellular and mechanoregulatory processes that occur at the cell membrane.
Figure 1.
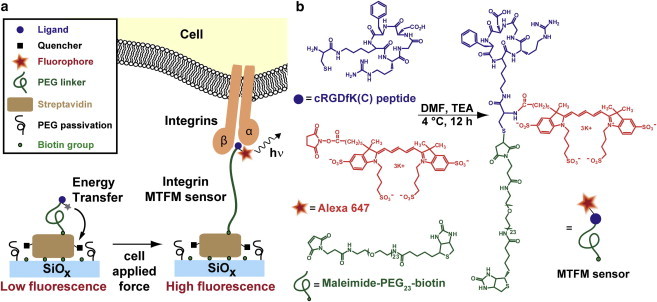
(a) Schematic of the MTFM integrin force sensor, which is composed of a PEG polymer flanked by a peptide and the fluorophore Alexa 647 at one terminus, and a quencher-modified streptavidin protein at the other terminus. In principle, we anticipated that mechanical tension applied through integrin receptors would extend the PEG linker and increase fluorescence. (b) Synthetic scheme showing the preparation of the cRGDfK(C)-A647-PEG23-biotin conjugate. To see this figure in color, go online.
Materials and Methods
Reagents
Unless otherwise stated, all starting materials and reagents were purchased from Sigma-Aldrich (St. Louis, MO) and used without further purification. All buffers were made with Nanopure water (18.2 MΩ) and passed through a 0.2 μm filtration system.
Synthesis of cRGDfK(C)-QSY21-PEG23-biotin and cRGDfK(C)-A647-PEG23-biotin
The cyclic Arg-Gly-Asp-D-Phe-Lys(Cys) (cRGDfK(C)) peptide was custom synthesized and reverse-phase HPLC (RP-HPLC) purified by Peptides International (Louisville, KY). Peptide purity was verified by electrospray ionization-mass spectrometry and reported to be 98.4% pure (based on HPLC). The QSY21 N-hydroxysuccinimidyl (NHS) ester and Alexa Fluor 647 NHS ester were obtained from Life Technologies (Carlsbad, CA). The biotin-PEG23-maleimide was obtained from Quanta Biodesign (Powell, OH). A 7 mM solution of Alexa 647-NHS ester (or QSY21-NHS ester) and biotin-PEG23-maleimide were typically reacted with a 1.4 mM solution of cRGDfK(C) in DMF (anhydrous grade; EMD Chemicals, Billerica, MA). A 1.5 molar excess of triethylamine (reagent grade, 99%; Fisher Scientific, Pittsburgh, PA) relative to the molar amount of cRGDfK(C) was added to maintain a basic pH, and this reaction was allowed to proceed overnight at r.t.
A RP-HPLC equipped with a binary pump system and a linear diode array detector (Agilent 1100) with monitoring at 220 and 647 or 660 nm was used to purify the final product (Fig. S1 and Fig. S2 in the Supporting Material). The reaction mixture was injected through a 5 μm, 4.6 × 250 mm C18 column at a flow rate of 1 ml/min with a linear gradient of 10–60% B over 50 min (A: aqueous 0.05% trifluoroacetic acid (HPLC grade, EMD Chemicals) buffer; B: 0.05% trifluoroacetic acid in acetonitrile (LC-MS Chromasolv, ≥99.9%; Fluka). This elution gradient was followed by a second gradient of 60–100% B over 10 min to collect the more hydrophobic fractions.
HPLC fractions were collected and analyzed by a matrix-assisted laser desorption/ionization time of flight (MALDI-TOF) mass spectrometer (Voyager-STR) to characterize the final product (Fig. S1 and Fig. S2). Fractions were mixed with a saturated 2,5-dihydroxybenzoic acid solution (1:1 ethanol:Nanopure water, 0.1% trifluoroacetic acid) at a 1:1 ratio by volume.
Streptavidin labeling
Recombinant streptavidin (Rockland Immunochemicals, Gilbertsville, PA) was labeled with either QSY21 or Alexa 647 by mixing 100 μg of the protein (1 mg/ml) in phosphate buffered saline (PBS) (10 mM phosphate buffer, 137 mM NaCl, 2.7 mM KCl, pH 7.4) with 10 μl of 1 M sodium bicarbonate (GR ACS, EMD Chemicals) and a fivefold molar excess of Alexa 647-NHS ester. The reaction was allowed to proceed for 25–30 min at r.t. on a rotating platform. Purification was performed by size-exclusion chromatography using Bio-Gel P4 resin (Bio-Rad, Hercules, CA) swollen with PBS, pH 7.4. The average labeling ratio of the final product was determined by UV-vis absorbance.
Biotin functionalization of glass substrates
The glass substrates were covalently functionalized with biotin following literature precedent (10,15). Briefly, glass coverslips (number 2, 25 mm diameter; VWR, Radnor, PA) were sonicated in Nanopure water for 15 min and etched in piranha (3:1 mixture of sulfuric acid (AR ACS, Macron Chemicals, Center Valley, PA) and 30% hydrogen peroxide) for 15 min. Warning: piranha is extremely corrosive and may explode if exposed to organics. The coverslips were thoroughly rinsed with Nanopure water and then placed into three successive wash beakers containing ethyl alcohol (200 proof, Decon Labs, King of Prussia, PA). Next, coverslips were placed into a beaker containing 43 mM silane solution in ethanol. To vary the surface density of terminal amines (Fig. S3), the surfaces were exposed to binary mixtures of silanes, 3-aminopropyltriethoxysilane (APTES), and CH3(CH2CH2O)9-12(CH2)3Si(OCH3)3 (mPEG, Gelest, Morrisville, PA). The molar ratios of the two silanes were 1:1, 1:10, 1:100, and 1:1000. Note that the total silane concentration remained constant at 43 mM. After 1 h immersion in the binary silane solution, slides were submerged in three separate beakers filled with ethanol, rinsed with additional ethanol, and then dried under a stream of ultrahigh purity N2. Substrates were then baked in an oven at ∼100°C for 15–30 min. After cooling, the slides were incubated with NHS-biotin (Thermo Fisher) at 2 mg/ml in DMSO overnight at r.t. Substrates were then rinsed with ethanol, dried under N2, and stored at r.t. until used for sensor preparation.
Surface density quantification
This procedure was adapted from Galush et al. (16) and is described in more detail in the Supporting Material (Methods and Fig. S4). Briefly, we synthesized an Alexa 647 1,2-di-(9Z-octadecenoyl)-sn-glycero-3-phosphoethanolamine (DOPE) conjugate (Avanti Polar Lipids, Alabaster, AL). A fluorescence surface density calibration was generated by measuring the intensity of known concentrations of Alexa 647-DOPE doped within a standard set of 1,2-dioleoyl-sn-glycero-3-phosphocholine (DOPC, Avanti Polar Lipids) supported lipid bilayers. This calibration plot was used to determine the streptavidin molecular density for glass slides that were prepared with binary mixtures of APTES:mPEG at ratios of 1:1, 1:10, 1:100, and 1:1000.
cRGDfK(C)-peptide conjugate immobilization with streptavidin-biotin
The biotin functionalized slides (described previously) were placed into cell chambers (attofluor chambers, Life Technologies), rinsed with 50 ml of Nanopure water, and then 50 ml of PBS, pH 7.4. To minimize nonspecific protein adsorption, surfaces were incubated with 100 μg/ml bovine serum albumin (BSA) (OmniPur BSA, Fraction V; EMD Chemicals) at r.t. for 1 h. The chamber was rinsed with 50 ml PBS, pH 7.4 and streptavidin conjugated with either QSY21 or Alexa 647 was added to a final concentration of 47 nM. After 1 h incubation, the chamber was rinsed with 50 ml PBS, pH 7.4, and the cRGDfK(C)-peptide conjugate was added at a concentration of 100 nM to the chamber and incubated for 1 h. The chamber was finally rinsed with 50 ml of PBS before imaging and plating cells.
Synthesis of cRGDfK α-thioester, 1
Synthesis of 1 was based upon the solid-phase synthesis of cyclic RGD derivatives reported by Xiao et al. (17). The resulting peptide thioester 1 was then purified by RP-HPLC and characterized by MALDI-TOF MS (data not shown).
Synthesis of fluorescein-PEG24-biotin conjugate, 2
This precursor was generated using solid-phase peptide synthesis and on-resin dye labeling. The sensor was cleaved from the resin with 95% trifluoroacetic acid with triisopropylsilane as a scavenger. Compound 2 was characterized by RP-HPLC and MALDI-TOF MS (data not shown).
Conjugation of 1 and 2 to generate cRGDfK-Alexa 647-PEG24-fluorescein-biotin, 4
Native chemical ligation was used to conjugate 1 and 2 by mixing 5 mM of 1 and 10 mM of 2 in 20 mM sodium phosphate buffer (pH 7.5) containing 5 mM betaine and 30 mM sodium 2-mercaptoethanesulfonic acid (MPAA) (Fig. S5). The reaction mixture was incubated for 24 h at room temperature to form compound 3. Finally, the Alexa 647-maleimide was coupled to the cysteine thiol group in 3 through Michael addition. The reaction mixture was incubated in DMF with N,N-diisopropylethylamine for 6 h. The product 4 was then purified by RP-HPLC and analyzed by MALDI-TOF MS (Fig. S6).
Covalent conjugation of cRGDfK(C)-A647-PEG24 to substrate
This procedure was adapted from Ha et al. (18) and Roy et al. (19). Briefly, glass coverslips were functionalized with 100% APTES (as described previously). They were then incubated in a PBS solution containing 5% w/v of methoxy capped PEG-NHS ester (MW: 2000, Nanocs, New York, NY), 0.2% w/v NHS-PEG24-maleimide (Quanta Biodesign), and 0.1 M NaHCO3 to adjust the pH. After 3 h, slides were thoroughly rinsed with Nanopure water followed by neat ethanol and dried under N2. A 20 μM solution of the cRGDfK(C)-A647 peptide in PBS (pH 7.4) was then incubated on the surface and allowed to react with the maleimide-presenting PEG polymer for 3 h. Slides were rinsed with Nanopure water and used with live cells within 24 h of functionalization.
Cell culture
HCC 1143 cells were cultured in RPMI 1640 medium (Mediatech, Manassas, VA) supplemented with 10% fetal bovine serum (FBS) (Mediatech), HEPES (10 mM, Sigma), sodium pyruvate (1 mM, Sigma), L-glutamine (2.5 mM, Mediatech), penicillin G (100 IU/ml, Mediatech), and streptomycin (100 μg/ml, Mediatech). NIH 3T3 fibroblasts were cultured in Dulbecco’s modified Eagle’s medium (Mediatech) supplemented with 10% Cosmic Calf serum (Mediatech), L-glutamine (2.5 mM, Mediatech), penicillin G (100 IU/ml, Mediatech), and streptomycin (100 μg/ml, Mediatech). HEK 293 cells were cultured in EMEM (Mediatech) supplemented with 10% FBS (Mediatech), nonessential amino acids (1%), penicillin G (100 IU/ml, Mediatech), and streptomycin (100 μg/ml, Mediatech). All cells were incubated at 37°C with 5% CO2 and passaged at 70–80% confluency.
Live cell fluorescence microscopy imaging
The plated cells were maintained at 37°C during imaging by using a warming apparatus consisting of a sample warmer and an objective warmer (Warner Instruments 641674D and 640375). An Eclipse Ti microscope driven by the Elements software package (Nikon) was used for all imaging experiments. The microscope features an Evolve electron multiplying charge-coupled device (EMCCD; Photometrics), an Intensilight epifluorescence source (Nikon), a CFI Apo 100 (numerical aperture (NA) = 1.49) objective (Nikon), and a total-internal reflection fluorescence (TIRF) launcher with two laser lines (Coherent): 488 nm (10 mW) and 640 nm (20 mW). This microscope also includes the Nikon Perfect Focus System, an interferometry-based focus lock that allowed the capture of multipoint and time-lapse images without loss of focus. The microscope was equipped with the following Chroma filter sets: TIRF 488, TIRF 640, Cy5, TRITC, and reflection interference contrast microscopy (RICM).
Immunostaining protocols
Cells were fixed with 4% paraformaldehyde for 12 min, treated with 0.1% Triton X for 5 min, and rinsed with 1% BSA in PBS, pH 7.4. Cells were left in BSA blocking for 4 h or overnight at 4°C and then immunostained with FITC-conjugated mouse antivinculin monoclonal antibody (clone hVIN-1, Sigma) according to manufacturer’s protocol. A final rinse of 5 mL of 1% BSA in PBS, pH 7.4 was performed three times before imaging.
Results and Discussion
Design and synthesis of MTFM sensor
To measure mechanical tension across the integrin receptor, we synthesized and characterized an integrin-specific MTFM sensor (Fig. 1 a). First, a cRGDfK(C) peptide, a common motif in ECM proteins, which shows high affinity (KD ∼nM) toward the αVβ3 integrin receptor (αVβ3 >> α5β1, αVβ5) (20,21) was custom synthesized to include a cysteine residue bound to the ε-amine of lysine. Addition of the cysteine allowed orthogonal conjugation of a 23 unit PEG-biotin through a maleimide group via Michael addition and an Alexa 647 fluorescent dye via standard NHS ester chemistry (Fig. 1 b). The cRGDfK(C)-A647-PEG23-biotin final product was purified and characterized by RP-HPLC and MALDI-TOF (Fig. S1). Of importance, this general strategy may be used for orthogonal and site-specific conjugation of a vast array of peptide and small molecule ligands, thus allowing one to investigate biophysical forces exerted by many receptors of interest.
Surface characterization and density calibration
Given that a sufficient ligand density is required for receptor clustering and activation (22), and polymer density influences the MTFM sensor conformation (and thus sensor response), it was important that we first measure and tune the surface density of the cRGDfK(C) MTFM sensors. To measure the donor only and donor-acceptor intensity from identical surfaces, we synthesized a cRGDfK(C)-QSY21-PEG23-biotin conjugate (Fig. S2) and anchored this to a streptavidin-Alexa 647 monolayer that was immobilized onto a standard glass coverslip (Fig. S3). The peptide surface density was controlled by modifying glass coverslips with binary mixtures of APTES and mPEG, where the terminal amine group of APTES was reacted with an NHS-ester biotin to capture streptavidin-Alexa 647, whereas the mPEG passivates the surface against nonspecific protein adsorption. To confirm the strength of binding between streptavidin and the biotinylated MTFM probes, the koff of biotin dissociation in the presence of free biotin was measured (Fig. S7) and was found to be similar to that reported in the literature. (23,24). Moreover, we determined that nonspecific binding of streptavidin and the PEG ligand contributed <0.5% of total bound MTFM probes (Fig. S8), thus confirming that the MTFM sensor was immobilized specifically through streptavidin-biotin interactions. To quantify the molecular surface density, we calibrated the Alexa 647 fluorescence intensity using a standard set of supported lipid membranes (Fig. S4 and Methods) (16,25). Based on this quantitative fluorescence calibration, we found that APTES:mPEG ratios of 1:0, 1:1, 1:10, 1:100, and 1:1000 resulted in streptavidin surface densities of 5300, 4600, 4400, 520, and 17 molecules/μm2, respectively (Fig. 2 a). Note that on average streptavidin was conjugated to approximately one cRGDfK(C) peptide force sensor when estimated to the nearest integer value using a quantitative fluorescence calibration (Methods in the Supporting Material).
Figure 2.
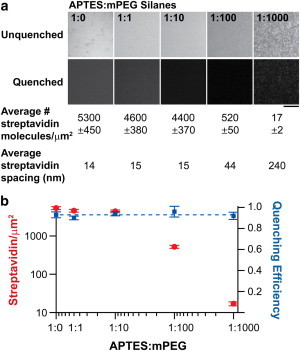
(a) Representative fluorescence images of MTFM sensor surfaces generated with a range of densities and the corresponding mean streptavidin intermolecular distance. Scale bar is 10 μm. (b) Plot showing the measured streptavidin surface density and the cRGD-peptide quenching efficiency as a function of the molar ratio of APTES/mPEG silane. To see this figure in color, go online.
Because the dynamic range and sensitivity of the MTFM probe, and its affinity to the integrin receptor depends on its average equilibrium conformation on the surface, we measured the average fluorophore-quencher distance (polymer extension) using the FRET relation. For these experiments, we synthesized cRGDfK(C)-PEG23 probes that lacked the quencher (donor only), and compared surface fluorescence intensity to that of the tension sensor modified surfaces (donor and acceptor) (Fig. 2 a). We found that the average quenching efficiency was 0.93 ± 0.02 (Fig. 2 b), thus indicating that the fluorophore-quencher distance ranges from 4.2 to 4.7 nm based on two independent methods that estimate R0 at 6.4 ± 0.2 nm and 7.2 ± 0.2 nm (Methods and Fig. S9 and Fig. S10) and assuming a κ2 value of 2/3. This fluorophore-quencher distance is in agreement with the predicted Flory radius of a 23-unit PEG (Flory radius is calculated to be 2.3 nm) (11), in addition to the radius of streptavidin (radius ∼2 nm, as estimated from the crystal structure (PDB:3ry1)). Based on theoretical models and experimental force spectroscopy measurements of PEG, the dynamic range of this integrin tension sensor is expected to be ∼1–30 pN for FRET efficiency values ranging from 0.9 to 0.1 (26–28). Moreover, the surface density measurements validate the FRET-determined polymer conformation, and indicate that the average distance (ranging from 14 to 240 nm) between streptavidin molecules is larger than the Flory radius. Taken together, the data indicate that the cRGDfK(C)-QSY21-PEG23-biotin probe adopts the relaxed mushroom conformation on these surfaces, remains highly quenched (>0.9), and is predicted to support cell binding and focal adhesion formation for APTES:mPEG ratios of 1:0, 1:1, 1:10, and 1:100.
Integrin forces lead to MTFM sensor dissociation
In initial experiments, we incubated HCC 1143 immortalized breast cancer cells on surfaces that contained quencher-modified streptavidin and the cRGDfK(C)-A647-PEG23-biotin peptide conjugate. Previously, our work has shown that cells do not engage or spread when streptavidin-modified surfaces lack RGD or other cell adhesion ligands (10,12). Cells were incubated on the higher density peptide surfaces (4400 ± 370 streptavidin molecules/μm2) for ∼60 min at 37°C and 5% CO2, and then imaged using brightfield, RICM, and fluorescence microscopy. Unexpectedly, we found that the fluorescence signal intensity under the perimeter of most cells was negative (Fig. 3 a) and colocalized with vinculin, a focal adhesion marker (Fig. S11). This observation was also confirmed on cRGDfK(C)-A647-PEG23-biotin surfaces that lacked the quencher (Fig. 3 b), suggesting that the dark areas were not related to the presence of the quencher or to polymer conformation. To verify that the PEG ligand was intact, the MTFM sensor was redesigned such that the termini of the polymer were tagged with a dye pair (fluorescein and Alexa 647) that undergoes FRET (Fig. 3, c–d). This was achieved by generating the sensor using solid-phase peptide synthesis, which was then purified and characterized by RP-HPLC and MALDI-TOF (Fig. S5 and Fig. S6). Cells incubated on these surfaces generally revealed areas of reduced fluorescence in both the donor and the acceptor channels. In contrast to the donor-quencher system (Fig. 3 a), some regions of a subset of cells displayed a positive fluorescence signal in the donor channel (Fig. 3 d), which typically corresponded to the proximal side of the cell perimeter. The slight increase (∼10%) in donor intensity is likely due to extension of the polymer, and this signal may be more readily observed due to the FRET sensitivity when the dyes are directly conjugated to the PEG chain, rather than randomly tagged to streptavidin. In the acceptor channel (Fig. 3 d), the decrease in fluorescence signal is similar to that observed in Fig. 3, a and b. In all cases, we start observing a net reduction in fluorescence intensity at the edges of this epithelial cell type by the 30 min time point, thus suggesting biotin dissociation. This could occur through dissociation of the streptavidin complex from the surface or dissociation of the biotinylated PEG tension probe from immobilized streptavidin. Further experiments indicated that under these conditions streptavidin remains immobilized, whereas the biotinylated PEG tension probes are dissociated from the surface (vide infra).
Figure 3.
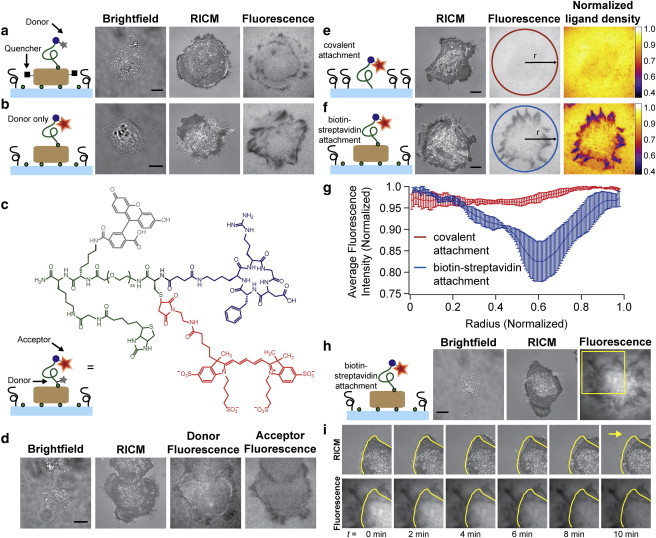
Cells incubated on the biotin-immobilized MTFM sensors exhibit negative signal suggesting streptavidin-biotin dissociation. Representative brightfield, RICM, and fluorescence images of a cell incubated on a streptavidin-biotin functionalized surface with a donor-quencher construct (a) and donor only construct (b). A decrease in donor signal is observed under the cell perimeter in both (a) and (b). (c) Schematic and chemical structure of the dual-tagged FRET MTFM sensor. (d) Cells incubated on this dual-tagged FRET surface generally showed a decrease in fluorescence intensity in both the donor and acceptor channels. A slight increase in donor emission at the proximal side of the cell perimeter was observed. (e and f) Representative RICM and fluorescence images of cells incubated on surfaces with ligands that are covalently anchored (e), or immobilized with streptavidin-biotin (f). Pseudocolored images represent the normalized ligand density, and highlight the fraction of ligand lost under each cell within 1 h of cell seeding. (g) Radial distribution functions of fluorescence under cells that were seeded on covalently anchored ligand surfaces (red, such as e), and tethered via streptavidin-biotin linkage (blue, such as f). Error bars represent the standard deviation of signals averaged from three cells. (h) Representative brightfield, RICM, and fluorescence images of HCC1143 cells adhered to cRGDfK(C)-A647-PEG23-biotin peptide anchored to the surface by streptavidin. (i) Time-lapse images of the cell region highlighted in yellow (h). Outline of initial cell position (yellow) reveals the migration of the cell over time (yellow arrow indicates direction of cell motion). Note the negative signal remains constant despite the translocation of cell edge. All scale bars represent 10 μm. To see this figure in color, go online.
In some cases, fluorophores display spectral shifts and changes in quantum yield as a result of integrin receptor binding (29). To measure this contribution to the fluorescence emission intensity, we generated cRGDfK(C)-A647-PEG24 surfaces that were covalently attached to the substrate. We rationalized that changes to the dye emission intensity on these surfaces would be due to integrin binding. In these experiments, the mean fluorescence intensity of the surface under each cell showed a ∼3% decrease when compared to the background (Fig. 3 e). This decrease was uniform across the entire cell contact region. In contrast, streptavidin-biotin anchored ligands showed a decrease of ∼30 to 60% at the cell perimeter, which could be clearly visualized when fluorescence images were normalized and displayed as heat maps that represented the fraction of MTFM ligand removed (Fig. 3 f). The ligand loss appeared to occur in regions that resembled focal adhesion contacts. The fluorescence intensity of the regions under cells where the ligand was covalently attached or attached via streptavidin-biotin was plotted as a radial distribution function from the cell center (Fig. 3 g). The results indicate that the fluorescence intensity under cells incubated on surfaces with ligand anchored by streptavidin-biotin attachment is 10- to 20-fold lower than that observed on surfaces with covalently tethered ligand.
Further evidence of biotin dissociation is revealed by the irreversible nature of the observed negative signal. We collected time-lapse images of a single cell after 90 min of incubation on a streptavidin-biotin surface containing only the donor cRGDfK(C)-A647-PEG23-biotin conjugate (Fig. 3 h). As the cell moves toward the right corner of the image and outside the field of view, the negative signal remains unchanged (Fig. 3 i and Movie S1). This experiment suggests that loss of donor intensity is irreversible. Controls using pharmacological inhibitors of f-actin and myosin show that biotin dissociation is dependent on the cytoskeleton. We found that cells pretreated with the nonmuscle myosin inhibitor blebbistatin for 15 min adhered to the surface, but completely failed to dissociate the streptavidin-anchored MTFM sensor (Fig. S12). Cells treated with latrunculin B (LatB), an f-actin inhibitor, 30 min after adhering to a surface failed to show any reversibility in signal (Fig. S12). Furthermore, cells treated with soluble cRGD peptide dissociate from the surface but the negative signal remains despite the absence of the cell (Fig. S13). Taken together, these results unambiguously show that the majority of the signal decrease is due to irreversible, cytoskeleton-dependent, and focal-adhesion-dependent biotin dissociation.
Integrin driven biotin dissociation is unexpected given that the streptavidin-biotin interaction is often described as the strongest noncovalent association in nature with an absolute free energy of binding of ∼−18 kcal/mol (30,31). In support of this, experimentally measured rupture forces for streptavidin-biotin were reported at ∼260 pN using atomic force microscopy (31). It should be noted, however, that rupture forces are dependent on the loading rate and temperature. For example, mean streptavidin-biotin rupture forces (at 25°C) have been recorded at ∼120 pN and ∼200 pN at loading rates of 198, and 2300 pN/s, respectively (32). Given this remarkable stability, streptavidin-biotin association is commonly used in the field of single molecule biophysics to measure the rupture force and bond lifetime between receptors and their ligands (33,34), including cell surface integrins and ligands derived from the ECM (35). It is of interest to note that one report described streptavidin-biotin dissociation at low force regimes (∼5 pN), but this was shown to occur due to brief (μs-ms) molecular encounters that do not allow the interaction to reach equilibrium (36,37). In our experiments, the biotin-tagged ligand is incubated with streptavidin for ∼1 h during MTFM sensor preparation and is therefore at, or near, equilibrium.
The free energy binding of αvβ3 integrins with the linear GRGDSP peptide was measured at −3.10 kcal/mol (38). Accordingly, single molecule rupture force for integrin-ligand associations have been reported in the range of ∼40 to 90 pN depending on the loading rate, the type of ligand (using RGD peptides and various fibronectin fragments), the type of integrin receptor (αvβ3 or α5β1), and the activation state (conformation) of the receptor (39,40). Therefore, literature precedent indicates that integrin-ligand interactions are more likely to dissociate under mechanical load when compared to streptavidin-biotin.
To quantify the likelihood of streptavidin-biotin dissociation over integrin-ligand dissociation when the two bonds are in series, we used published values of koff for both bonds (23,24), and applied the analysis developed by Neuert et al. (41) (Methods in the Supporting Material). Assuming that both bonds in the series have similar potential widths (Δx), we found that the probability of streptavidin-biotin dissociation under integrin-mediated tension is ∼2.8 × 10⁻⁵. If Δx of streptavidin-biotin is greater than that of the integrin-ligand bond (which is likely), the analysis becomes more complex, as the change in koff becomes loading rate and force dependent. Nonetheless, the koff values differ by orders of magnitude and the streptavidin-biotin bond should survive under integrin-mediated forces.
One of the molecular mechanisms that may contribute to the observed integrin-ligand bond strengthening includes force-induced stabilization of the high-affinity state of integrin receptors (42,43). Kong et al. (44) observed that the α5β1 integrin-ligand bond lifetime can be enhanced by 100-fold upon application of cyclic forces, and termed this phenomenon cyclic mechanical reinforcement. This is likely important given that recent work reported the existence of low frequency (∼0.1 Hz) traction force oscillations within focal adhesions (5). Moreover, integrin clustering and focal adhesion maturation leading to the formation of parallel and multivalent ligand-receptor bonds may also contribute to increasing the effective lifetime of the integrin-ligand interaction (45). These supramolecular complexes only form at ECM-integrin interfaces that allow for clustering (22). Therefore, single-molecule force spectroscopy experiments performed on the surface of living cells are unable to recapitulate the ligand-receptor stabilization mechanisms that likely occur within focal adhesions. Consequently, the stabilization of integrin-ligand bonds over streptavidin-biotin may not be present in typical single-molecule force-extension experiments. Further evidence supporting our observation of enhanced integrin-ligand affinity comes from a recent report showing that focal adhesion formation requires integrin ligands that can withstand ∼50–60 pN of tension (as defined by the rupture force under steady-state tension over a duration of <2 s) (6). Our own recent MTFM work also shows that integrin receptors can apply 15 pN of tension within some focal adhesions (12). Therefore, integrin-ligand association must be sufficiently stabilized to withstand these large mechanical loads for extended durations, suggesting a mechanism of integrin-ligand affinity enhancement within functional cell adhesions. Interestingly, these reported magnitudes of tension are likely sufficient to dissociate streptavidin-biotin associations in our experiments. For example, based on the Bell model, loading rates of ∼0.1 pN/s at 37°C would lead to a mean streptavidin-biotin rupture force of ∼57 pN (32,46) and the average lifetime of streptavidin-biotin association is on the order of 102 s when placed under 40 pN of constant tension (36,50). Therefore, it is feasible that biotin dissociates from streptavidin under the integrin-mediated tension; however, the enhanced stability of the integrin-ligand interaction remains unexpected and is likely related to focal adhesion formation.
Imaging integrin force dynamics
Given that integrin tension may lead to polymer extension as well as biotin dissociation, the MTFM sensor was redesigned such that both events result in a positive turn-on fluorescence signal. In this design, the quencher was conjugated to the ligand, whereas the streptavidin was labeled with the Alexa 647 fluorophore (Fig. 4 a). Moreover, we expected that upon dissociation this signal would be irreversible, remaining even after dampening of the mechanical load.
Figure 4.
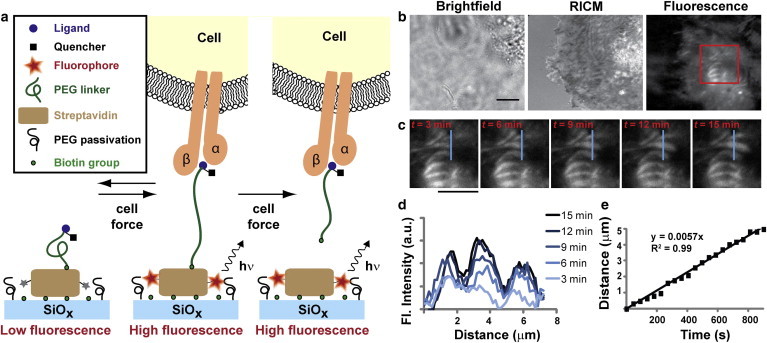
Integrin tension imaging in cells incubated on the redesigned MTFM sensor surface. (a) Schematic description showing the response of the redesigned MTFM integrin sensor and its corresponding fluorescence intensity. Integrin tension that is below ∼30 pN is expected to lead to reversible extension of the MTFM sensor (within 1 h of cell seeding). In contrast, larger forces are expected to lead to irreversible dissociation of biotin from the immobilized streptavidin. Since the fluorophore is conjugated to streptavidin, both force regimes lead to an increase in signal intensity. (b) Representative brightfield, RICM, and integrin MTFM response for a cell that is spreading over the surface (density = 4600 streptavidin/μm2). (c) A time lapse series of images from the noted region of interest (red box) (t represents the start of imaging). (d) Line scans represent profiles through the indicated region in (c) as a function of time. (e) Plot showing the translocation of the force region as a function of time. Scale bars represent 10 μm. To see this figure in color, go online.
Fluorescence images of cells adhered to surfaces coated with this version of the sensor show subcellular regions with increased fluorescence intensity. This observation indicates that integrin-mediated mechanical tension leads to cRGDfK(C)-QSY21-PEG23-biotin polymer extension and unbinding from streptavidin (Fig. 4, b and c). Some of the areas appear punctate, whereas others show highly elongated, fiber-like structures that generally run parallel to each other, in agreement with typical chemical staining of focal adhesions (47). However, due to the irreversibility of the MTFM probe signal, these structures may represent elongated, mature focal adhesions or punctate adhesions that have translocated. Time-lapse total-internal reflection fluorescence microscopy imaging collected over a 15 min time duration revealed the rate of growth of regions of high integrin tension (Fig. 4, c–e, and Movie S2). The linear rate of integrin tension over this region was ∼340 nm/min, which is in agreement, within an order of magnitude, with the reported rate of focal adhesion elongation in NIH 3T3 cells (Fig. 4 e) (48). These images also reveal that biotin unbinding occurs primarily between the sensor and streptavidin rather than at the streptavidin-glass interface. Dissociation of the fluorophore-modified streptavidin from the surface would result in dark regions, which are not observed under these conditions. This is likely due to the high surface density of biotin, which provides multivalent attachment for streptavidin. Low-density biotin surfaces, though, may present streptavidin that is primarily anchored through single biotin attachment, and thus may be prone to surface dissociation. We are unable to verify this, however, due to the low fluorescence signal on surfaces presenting low biotin densities.
Generality of integrin-driven biotin dissociation and relationship to focal adhesions
To verify that the MTFM signal (and streptavidin-biotin dissociation) is applicable beyond the HCC 1143 cell line and that integrin tension was correlated with focal adhesion formation, HEK 293 cells (Fig. 5 a) and NIH 3T3 fibroblasts (Fig. 5 b) were incubated on sensor surfaces for 60 min and then fixed and immunostained for vinculin, a common component of focal adhesion complexes. An overlay of the immunostained images with the MTFM response showed that tension and biotin dissociation is colocalized to focal adhesion formation. It is also important to note that a portion of the tension signal is not directly colocalized with vinculin, likely due to the irreversibility of the signal. For example, some of the observed MTFM signal represents areas where cells engaged the substrate and dissociated ligand molecules before imaging. Moreover, if allowed to incubate on the MTFM sensor surface for long durations (5 h), large regions of fluorescence increase were observed under nearly all cells on the surface (Fig. S14). Therefore, these data confirm that the MTFM sensor can be used to observe tension applied by a broad range of cell types.
Figure 5.
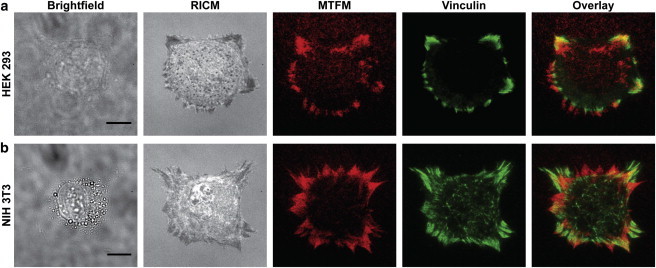
Cells immunostained for focal adhesion markers. Representative HEK 293 (a), and NIH 3T3 (b) cells are imaged using brightfield, RICM, MTFM (red), and immunostained for vinculin (green). The final panel shows an overlay of both fluorescence channels (MTFM and vinculin). Scale bar is 10 μm. To see this figure in color, go online.
Conclusion
In conclusion, we found that streptavidin-biotin tethered integrin ligand molecules dissociate from the surface due to cell-driven forces. This finding indicates that single molecule measurements almost certainly underestimate the stability of integrin-ligand interactions within functional focal adhesions. Many mechanoregulatory processes in the cell involve multiprotein complexes, and thus kinetic and thermodynamic parameters derived from single molecule techniques applied to individual ligand-receptor pairs may not accurately depict the biological context of the crowded cell environment. Furthermore, we conclude that integrin-ligand tension is likely one to two orders of magnitude larger than had previously been estimated using microscopic averaging methods, such as traction force microscopy (8). Our force estimate is derived from experiments and calculations that indicate that a steady state tension of ∼10-20 pN is needed to reduce the biotin-streptavidin bond lifetime to approximately 103 seconds (50,36). Interestingly, Dunn and colleagues recently reported the development of a recombinant protein-based tension probe to investigate integrin forces within focal adhesions (13). These probes employ streptavidin-biotin to tether the force sensor, and the results indicate that integrin-generated forces are approximately 1-5 pN per receptor. While our tension estimates are significantly greater than these reported values, it is plausible that the linear RGD peptide used in the recombinant probes sustains lower forces than the cyclized RGD peptide used in our system. Moreover, spikes in integrin-generated forces may be transient in nature.
Overall, our results are significant because the streptavidin-biotin association is widely used to display small molecules and peptides to screen for cues that trigger cell signaling pathways (51). Therefore, these results suggest that more robust immobilization strategies are needed to exclude the possibility of cell-based dissociation of surface ligands and remodeling of the surface, which may obscure results.
MTFM is technically facile; however, due to the unexpected dissociation of streptavidin-biotin, the signal presented by the sensor is not easily interpreted as an average force. Instead, it provides lower bound estimates of integrin-driven tension and this lower bound estimate vastly exceeds what has previously been predicted. We anticipate that the next generation of covalently immobilized MTFM force probes will address existing gaps in our understanding of mechanotransduction pathways during cellular processes such as migration, mitosis, and wound healing.
Acknowledgments
K.S. is grateful for support from the NIH (R01-GM097399), the Alfred P. Sloan Research Fellowship, and the Army Research Office (62570EGII). Research reported in this publication was supported in part by the NIH/NCI under award number P30CA138292. The content is solely the responsibility of the authors and does not necessarily represent the official views of the National Institutes of Health. The authors thank Drs. Jin-Tang Dong, Jeremy Boss, and Michael Davis of the Emory School of Medicine for the HCC 1143 cells, the NIH 3T3 fibroblasts, and the HEK 293 cells, respectively.
Supporting Material
References
- 1.Hynes R.O. Integrins: bidirectional, allosteric signaling machines. Cell. 2002;110:673–687. doi: 10.1016/s0092-8674(02)00971-6. [DOI] [PubMed] [Google Scholar]
- 2.Puklin-Faucher E., Sheetz M.P. The mechanical integrin cycle. J. Cell Sci. 2009;122:179–186. doi: 10.1242/jcs.042127. [DOI] [PMC free article] [PubMed] [Google Scholar]
- 3.Riveline D., Zamir E., Bershadsky A.D. Focal contacts as mechanosensors: externally applied local mechanical force induces growth of focal contacts by an mDia1-dependent and ROCK-independent mechanism. J. Cell Biol. 2001;153:1175–1186. doi: 10.1083/jcb.153.6.1175. [DOI] [PMC free article] [PubMed] [Google Scholar]
- 4.Grashoff C., Hoffman B.D., Schwartz M.A. Measuring mechanical tension across vinculin reveals regulation of focal adhesion dynamics. Nature. 2010;466:263–266. doi: 10.1038/nature09198. [DOI] [PMC free article] [PubMed] [Google Scholar]
- 5.Plotnikov S.V., Pasapera A.M., Waterman C.M. Force fluctuations within focal adhesions mediate ECM-rigidity sensing to guide directed cell migration. Cell. 2012;151:1513–1527. doi: 10.1016/j.cell.2012.11.034. [DOI] [PMC free article] [PubMed] [Google Scholar]
- 6.Wang X., Ha T. Defining single molecular forces required to activate integrin and notch signaling. Science. 2013;340:991–994. doi: 10.1126/science.1231041. [DOI] [PMC free article] [PubMed] [Google Scholar]
- 7.Sabass B., Gardel M.L., Schwarz U.S. High resolution traction force microscopy based on experimental and computational advances. Biophys. J. 2008;94:207–220. doi: 10.1529/biophysj.107.113670. [DOI] [PMC free article] [PubMed] [Google Scholar]
- 8.Tan J.L., Tien J., Chen C.S. Cells lying on a bed of microneedles: an approach to isolate mechanical force. Proc. Natl. Acad. Sci. USA. 2003;100:1484–1489. doi: 10.1073/pnas.0235407100. [DOI] [PMC free article] [PubMed] [Google Scholar]
- 9.Dufrêne Y.F., Evans E., Müller D.J. Five challenges to bringing single-molecule force spectroscopy into living cells. Nat. Methods. 2011;8:123–127. doi: 10.1038/nmeth0211-123. [DOI] [PubMed] [Google Scholar]
- 10.Stabley D.R., Jurchenko C., Salaita K.S. Visualizing mechanical tension across membrane receptors with a fluorescent sensor. Nat. Methods. 2012;9:64–67. doi: 10.1038/nmeth.1747. [DOI] [PubMed] [Google Scholar]
- 11.de Gennes P.G. Conformations of polymers attached to an interface. Macromolecules. 1980;13:1069–1075. [Google Scholar]
- 12.Liu Y., Yehl K., Salaita K. Tension sensing nanoparticles for mechano-imaging at the living/nonliving interface. J. Am. Chem. Soc. 2013;135:5320–5323. doi: 10.1021/ja401494e. [DOI] [PMC free article] [PubMed] [Google Scholar]
- 13.Morimatsu M., Mekhdjian A.H., Dunn A.R. Molecular tension sensors report forces generated by single integrin molecules in living cells. Nano. Lett. 2013;13:3985–3989. doi: 10.1021/nl4005145. [DOI] [PMC free article] [PubMed] [Google Scholar]
- 14.Green N.M. Avidin and streptavidin. Methods Enzymol. 1990;184:51–67. doi: 10.1016/0076-6879(90)84259-j. [DOI] [PubMed] [Google Scholar]
- 15.Clack N.G., Salaita K., Groves J.T. Electrostatic readout of DNA microarrays with charged microspheres. Nat. Biotechnol. 2008;26:825–830. doi: 10.1038/nbt1416. [DOI] [PMC free article] [PubMed] [Google Scholar]
- 16.Galush W.J., Nye J.A., Groves J.T. Quantitative fluorescence microscopy using supported lipid bilayer standards. Biophys. J. 2008;95:2512–2519. doi: 10.1529/biophysj.108.131540. [DOI] [PMC free article] [PubMed] [Google Scholar]
- 17.Xiao J., Chen R., Tolbert T.J. Targeting a homogeneously glycosylated antibody Fc to bind cancer cells using a synthetic receptor ligand. J. Am. Chem. Soc. 2009;131:13616–13618. doi: 10.1021/ja9045179. [DOI] [PubMed] [Google Scholar]
- 18.Ha T., Rasnik I., Chu S. Initiation and re-initiation of DNA unwinding by the Escherichia coli Rep helicase. Nature. 2002;419:638–641. doi: 10.1038/nature01083. [DOI] [PubMed] [Google Scholar]
- 19.Roy R., Hohng S., Ha T. A practical guide to single-molecule FRET. Nat. Methods. 2008;5:507–516. doi: 10.1038/nmeth.1208. [DOI] [PMC free article] [PubMed] [Google Scholar]
- 20.Englund E.A., Wang D., Appella D.H. Programmable multivalent display of receptor ligands using peptide nucleic acid nanoscaffolds. Nat Commun. 2012;3:614. doi: 10.1038/ncomms1629. [DOI] [PMC free article] [PubMed] [Google Scholar]
- 21.Schottelius M., Laufer B., Wester H.-J. Ligands for mapping αvβ3-integrin expression in vivo. Acc. Chem. Res. 2009;42:969–980. doi: 10.1021/ar800243b. [DOI] [PubMed] [Google Scholar]
- 22.Huang J., Grater S.V., Spatz J.P. Impact of order and disorder in RGD nanopatterns on cell adhesion. Nano Lett. 2009;9:1111–1116. doi: 10.1021/nl803548b. [DOI] [PMC free article] [PubMed] [Google Scholar]
- 23.Deng L., Kitova E.N., Klassen J.S. Dissociation kinetics of the streptavidin-biotin interaction measured using direct electrospray ionization mass spectrometry analysis. J. Am. Soc. Mass Spectrom. 2013;24:49–56. doi: 10.1007/s13361-012-0533-5. [DOI] [PubMed] [Google Scholar]
- 24.Klumb L.A.C., Chu V., Stayton P.S. Energetic roles of hydrogen bonds at the ureido oxygen binding pocket in the streptavidin-biotin complex. Biochemistry. 1998;37:7657–7663. doi: 10.1021/bi9803123. [DOI] [PubMed] [Google Scholar]
- 25.Narui Y., Salaita K. Dip-pen nanolithography of optically transparent cationic polymers to manipulate spatial organization of proteolipid membranes. Chem. Sci. 2012;3:794–799. [Google Scholar]
- 26.Marko J.F., Siggia E.D. Bending and twisting elasticity of DNA. Macromolecules. 1994;27:981–988. [Google Scholar]
- 27.Bouchiat C., Wang M.D., Croquette V. Estimating the persistence length of a worm-like chain molecule from force-extension measurements. Biophys. J. 1999;76:409–413. doi: 10.1016/s0006-3495(99)77207-3. [DOI] [PMC free article] [PubMed] [Google Scholar]
- 28.Kienberger F., Pastushenko V.P., Hinterdorfer P. Static and dynamical properties of single poly(ethylene glycol) molecules investigated by force spectroscopy. Single Mol. 2000;1:123–128. [Google Scholar]
- 29.Shi H., Liu J., Liu B. Specific detection of integrin αvβ3 by light-up bioprobe with aggregation-induced emission characteristics. J. Am. Chem. Soc. 2012;134:9569–9572. doi: 10.1021/ja302369e. [DOI] [PubMed] [Google Scholar]
- 30.General I.J., Dragomirova R., Meirovitch H. Absolute free energy of binding of avidin/biotin, revisited. J. Phys. Chem. B. 2012;116:6628–6636. doi: 10.1021/jp212276m. [DOI] [PMC free article] [PubMed] [Google Scholar]
- 31.Moy V.T., Florin E.L., Gaub H.E. Intermolecular forces and energies between ligands and receptors. Science. 1994;266:257–259. doi: 10.1126/science.7939660. [DOI] [PubMed] [Google Scholar]
- 32.Yuan C., Chen A., Moy V.T. Energy landscape of streptavidin-biotin complexes measured by atomic force microscopy. Biochemistry. 2000;39:10219–10223. doi: 10.1021/bi992715o. [DOI] [PubMed] [Google Scholar]
- 33.Smith S.B., Finzi L., Bustamante C. Direct mechanical measurements of the elasticity of single DNA molecules by using magnetic beads. Science. 1992;258:1122–1126. doi: 10.1126/science.1439819. [DOI] [PubMed] [Google Scholar]
- 34.Hohng S., Zhou R., Ha T. Fluorescence-force spectroscopy maps two-dimensional reaction landscape of the Holliday junction. Science. 2007;318:279–283. doi: 10.1126/science.1146113. [DOI] [PMC free article] [PubMed] [Google Scholar]
- 35.Yu C.H., Law J.B.K., Sheetz M.P. Early integrin binding to Arg-Gly-Asp peptide activates actin polymerization and contractile movement that stimulates outward translocation. Proc. Natl. Acad. Sci. USA. 2011;108:20585–20590. doi: 10.1073/pnas.1109485108. [DOI] [PMC free article] [PubMed] [Google Scholar]
- 36.Pincet F., Husson J. The solution to the streptavidin-biotin paradox: the influence of history on the strength of single molecular bonds. Biophys. J. 2005;89:4374–4381. doi: 10.1529/biophysj.105.067769. [DOI] [PMC free article] [PubMed] [Google Scholar]
- 37.Merkel R., Nassoy P., Evans E. Energy landscapes of receptor-ligand bonds explored with dynamic force spectroscopy. Nature. 1999;397:50–53. doi: 10.1038/16219. [DOI] [PubMed] [Google Scholar]
- 38.Choi Y., Kim E., Kang I.-C. Site-specific inhibition of integrin α v β 3-vitronectin association by a ser-asp-val sequence through an Arg-Gly-Asp-binding site of the integrin. Proteomics. 2010;10:72–80. doi: 10.1002/pmic.200900146. [DOI] [PubMed] [Google Scholar]
- 39.Lehenkari P.P., Horton M.A. Single integrin molecule adhesion forces in intact cells measured by atomic force microscopy. Biochem. Biophys. Res. Commun. 1999;259:645–650. doi: 10.1006/bbrc.1999.0827. [DOI] [PubMed] [Google Scholar]
- 40.Li F., Redick S.D., Moy V.T. Force measurements of the α5β1 integrin-fibronectin interaction. Biophys. J. 2003;84:1252–1262. doi: 10.1016/S0006-3495(03)74940-6. [DOI] [PMC free article] [PubMed] [Google Scholar]
- 41.Neuert G., Albrecht C.H., Gaub H.E. Predicting the rupture probabilities of molecular bonds in series. Biophys. J. 2007;93:1215–1223. doi: 10.1529/biophysj.106.100511. [DOI] [PMC free article] [PubMed] [Google Scholar]
- 42.Friedland J.C., Lee M.H., Boettiger D. Mechanically activated integrin switch controls α5β1 function. Science. 2009;323:642–644. doi: 10.1126/science.1168441. [DOI] [PubMed] [Google Scholar]
- 43.Kong F., García A.J., Zhu C. Demonstration of catch bonds between an integrin and its ligand. J. Cell Biol. 2009;185:1275–1284. doi: 10.1083/jcb.200810002. [DOI] [PMC free article] [PubMed] [Google Scholar]
- 44.Kong F., Li Z., Zhu C. Cyclic mechanical reinforcement of integrin-ligand interactions. Mol. Cell. 2013;49:1060–1068. doi: 10.1016/j.molcel.2013.01.015. [DOI] [PMC free article] [PubMed] [Google Scholar]
- 45.Schoen I., Pruitt B., Vogel V. The yin-yang of rigidity sensing: how forces and mechanical properties regulate the cellular response to materials. Annu. Rev. Mater. Res. 2013;43:6.1–6.30. [Google Scholar]
- 46.Bell G.I. Models for the specific adhesion of cells to cells. Science. 1978;200:618–627. doi: 10.1126/science.347575. [DOI] [PubMed] [Google Scholar]
- 47.Singer I.I. Association of fibronectin and vinculin with focal contacts and stress fibers in stationary hamster fibroblasts. J. Cell Biol. 1982;92:398–408. doi: 10.1083/jcb.92.2.398. [DOI] [PMC free article] [PubMed] [Google Scholar]
- 48.Stricker J., Aratyn-Schaus Y., Gardel M.L. Spatiotemporal constraints on the force-dependent growth of focal adhesions. Biophys. J. 2011;100:2883–2893. doi: 10.1016/j.bpj.2011.05.023. [DOI] [PMC free article] [PubMed] [Google Scholar]
- 49.Schwarz U.S., Balaban N.Q., Safran S.A. Calculation of forces at focal adhesions from elastic substrate data: the effect of localized force and the need for regularization. Biophys. J. 2002;83:1380–1394. doi: 10.1016/S0006-3495(02)73909-X. [DOI] [PMC free article] [PubMed] [Google Scholar]
- 50.Tabard-Cossa V., Wiggin M., Marziali A. Single-molecule bonds characterized by solid-state nanopore force spectroscopy. ACS Nano. 2009;3:3009–3014. doi: 10.1021/nn900713a. [DOI] [PMC free article] [PubMed] [Google Scholar]
- 51.Klim J.R., Fowler A.J., Kiessling L.L. Small-molecule-modified surfaces engage cells through the αvβ3 integrin. ACS Chem. Biol. 2012;7:518–525. doi: 10.1021/cb2004725. [DOI] [PMC free article] [PubMed] [Google Scholar]
- 52.Yun C.S., Javier A., Strouse G.F. Nanometal surface energy transfer in optical rulers, breaking the FRET barrier. J. Am. Chem. Soc. 2005;127:3115–3119. doi: 10.1021/ja043940i. [DOI] [PubMed] [Google Scholar]
- 53.Clegg R.M., Murchie A.I.H., Lilley D.M.J. Observing the helical geometry of double-stranded DNA in solution by fluorescence resonance energy transfer. Proc. Natl. Acad. Sci. USA. 1993;90:2994–2998. doi: 10.1073/pnas.90.7.2994. [DOI] [PMC free article] [PubMed] [Google Scholar]
- 54.Norman D.G., Grainger R.J., Lilley D.M.J. Location of cyanine-3 on double-stranded DNA: importance for fluorescence resonance energy transfer studies. Biochemistry. 2000;39:6317–6324. doi: 10.1021/bi992944a. [DOI] [PubMed] [Google Scholar]
- 55.Goldmann W.H. Kinetic determination of focal adhesion protein formation. Biochem. Biophys. Res. Commun. 2000;271:553–557. doi: 10.1006/bbrc.2000.2653. [DOI] [PubMed] [Google Scholar]
- 56.Jamali Y., Jamali Y., Mofrad R.R.K. An agent based model of integrin clustering: exploring the role of ligand clustering, integrin homo-oligomerization, integrin-ligand affinity, membrane crowdedness and ligand mobility. J. Comp. Phys. 2013;244:264–278. [Google Scholar]
Associated Data
This section collects any data citations, data availability statements, or supplementary materials included in this article.