

Abstract
Background and Purpose
The hippocampal cell line HT22 is an excellent model for studying the consequences of endogenous oxidative stress. Extracellular glutamate depletes cellular glutathione by blocking the glutamate/cystine antiporter system xc−. Glutathione depletion induces a well-defined programme of cell death characterized by an increase in reactive oxygen species and mitochondrial dysfunction.
Experimental Approach
We compared the mitochondrial shape, the abundance of mitochondrial complexes and the mitochondrial respiration of HT22 cells, selected based on their resistance to glutamate, with those of the glutamate-sensitive parental cell line.
Key Results
Glutamate-resistant mitochondria were less fragmented and displayed seemingly contradictory features: mitochondrial calcium and superoxide were increased while high-resolution respirometry suggested a reduction in mitochondrial respiration. This was interpreted as a reverse activity of the ATP synthase under oxidative stress, leading to hydrolysis of ATP to maintain or even elevate the mitochondrial membrane potential, suggesting these cells endure ineffective energy metabolism to protect their membrane potential. Glutamate-resistant cells were also resistant to oligomycin, an inhibitor of the ATP synthase, but sensitive to deoxyglucose, an inhibitor of hexokinases. Exchanging glucose with galactose rendered resistant cells 1000-fold more sensitive to oligomycin. These results, together with a strong increase in cytosolic hexokinase 1 and 2, a reduced lactate production and an increased activity of glucose-6-phosphate dehydrogenase, suggest that glutamate-resistant HT22 cells shuttle most available glucose towards the hexose monophosphate shunt to increase glutathione recovery.
Conclusions and Implications
These results indicate that mitochondrial and metabolic adaptations play an important role in the resistance of cells to oxidative stress.
Linked Articles
This article is part of a themed issue on Mitochondrial Pharmacology: Energy, Injury & Beyond. To view the other articles in this issue visit http://dx.doi.org/10.1111/bph.2014.171.issue-8
Keywords: oxidative stress, glycolysis, cell death, mitochondria, fusion/fission, oxidative phosphorylation
Introduction
Increased mitochondrial production of reactive oxygen species (ROS) is a key pathophysiological feature in many acute and chronic neurodegenerative disorders such as Alzheimer's and Parkinson's diseases as well as stroke and brain trauma. Under physiological conditions, cellular antioxidant defence mechanisms involving superoxide dismutase, catalase, glutathione (GSH), peroxidases and thioredoxin-2 counterbalance free radical formation and thereby maintain cellular redox homeostasis (Drechsel and Patel, 2010; Kudin et al., 2012). The tripeptide GSH, composed of the amino acids glutamate, cysteine and glycine, is present in millimolar quantities in cells and serves as an important antioxidant and redox molecule. In its reduced state, GSH serves as an electron donor to detoxify ROS and is thereby oxidized to glutathione disulfide (GSSG). The recovery of GSH from GSSG is mediated by GSH reductase under NADPH consumption (Dringen, 2000). NADPH can be generated by non-mitochondrial routes of energy production such as enhanced flux of glucose through both the glycolytic pathway and the hexose monophosphate shunt (HMS), which have previously been shown to be cytoprotective in oxidative stress (Soucek et al., 2003). However, excitotoxic activation of glutamate receptors can switch the neuronal metabolism towards an increased rate of glycolysis and a reduced HMS resulting in oxidative damage and neuronal cell death (Rodriguez-Rodriguez et al., 2012), suggesting that activation of the HMS and not increased glycolysis might confer protection.
Endogenous oxidative stress caused by a lack of cellular antioxidative mechanisms can be excellently studied in vitro by treating cells with glutamate, which inhibits cystine uptake through the glutamate/cystine antiporter system xc− (see Alexander et al., 2013a). Within the cell, cystine is rapidly converted to cysteine, the rate-limiting amino acid for GSH synthesis. Cystine deprivation then causes secondary GSH depletion and a programmed cell death by oxytosis or oxidative glutamate toxicity, which is clearly distinct from apoptosis, necrosis and cell death associated with autophagy. A well-established model system for oxytosis is glutamate-induced cell death in the hippocampal cell line HT22, which has been extensively used to clarify the cascade leading to cell death and to identify antioxidant pathways and proteins (reviewed in Albrecht et al., 2010). In this system, GSH depletion leads to an exponential increase in ROS, which mostly originates from mitochondrial complex I activity (Tan et al., 1998), and is accompanied by a gradual disruption of the mitochondrial membrane potential (ΔΨm), as measured with JC-1, a lipophilic, cationic dye that can selectively enter mitochondria (Landshamer et al., 2008; Pallast et al., 2009; Noack et al., 2012). After approximately 6 h of glutamate exposure, the lipid-oxidizing enzyme 12/15-lipoxygenase is activated and generates 12-and 15-hydroxyeicosatetraenoic acids (Li et al., 1997) that directly damage mitochondria (Pallast et al., 2009), which is followed or accompanied by translocation of the pro-apoptotic BCL-2 family member BID (BH3-interacting domain death agonist) to mitochondria and release of apoptosis-inducing factor from mitochondria (Landshamer et al., 2008). Therefore, mitochondria and energy metabolism appear to be important factors in the susceptibility of cells to endogenous oxidative stress.
Taken together, mitochondria and energy metabolism play an important role in the mechanisms of neuronal susceptibility to oxidative stress. In the present study, we focused on morphological, physiological and molecular adaptations of glutamate-resistant HT22 cells (R). These cells were generated by repeated exposure to glutamate (Lewerenz et al., 2006) and are similarly resistant to other cellular stressors, such as endoplasmic reticulum stress caused by the N-glycosylation inhibitor tunicamycin or overexpression of the pro-apoptotic mitochondrial protein Bax (Dittmer et al., 2008). We examined mitochondrial shape, the relative abundance of mitochondrial complexes and mitochondrial respiration in these cells compared with the glutamate-sensitive parental cell line. We obtained evidence that chronic oxidative stress and acquired resistance in glutamate-resistant R cells have profound effects on mitochondrial physiology and shift the cellular energy metabolism away from oxidative phosphorylation and most probably towards the hexose monophosphate shunt.
Methods
Cell culture
The glutamate-sensitive S and the glutamate-resistant R mouse hippocampal HT22 cell lines were cultured in DMEM high glucose (PAA Laboratories, Pasching, Austria or Gibco, Paisley, UK) supplemented with 5% (v v-1) fetal calf serum (FCS, Thermo Scientific, Cramlington, UK) and 100 U·mL−1 penicillin and 100 μg·mL−1 streptomycin (Gibco) in a humidified incubator with 5% CO2 and 95% air at 37°C. The R cell medium was supplemented with 10 mM glutamate.
Cell viability and growth assays
HT22 cells were seeded in 96-well plates at a density of 5000 cells per well. Twenty four hours after being seeded, cell death inducing reagents were added at the indicated concentrations and cell viability was quantified using the CellTiter-Blue (CTB) reagent (Promega, Madison, WI, USA) 22–24 h later. The fluorescent signal was measured at 562/590 nm (excitation/emission) using an Infinite M200 Pro reader (Tecan, Maennedorf, Switzerland).
Growth curves were prepared by plating the cells every 4 days at a density of 10 000 cells·cm−2 into 6-well plates (95 000 cells per well). The number of cells at each step for each well was calculated as the average cell number at the former step divided by the number of seeded cells multiplied by the current cell number.
Five thousand S and R cells were seeded in 96-well plates. R cells were cultivated in the presence of 10 mM glutamate. After 24 h, the medium was replaced by 100 μL PBS with 2 mM EDTA at different time points, and the plate was shaken directly after addition of PBS without EDTA to control wells. Six replicates were performed in parallel for every condition. After the cells had been shaken, PBS or PBS/EDTA was removed and cells were washed with 100 μL medium to remove detached cells. The remaining cells were quantified by the MTT assay as previously reported (Lewerenz et al., 2003).
Quantification of mitochondrial morphology
HT22 cells were seeded onto cover slips and treated 24 h later with 0.2 μM MitoTracker Red CMXRos (Invitrogen, Eugene, OR, USA) in serum-free medium for 15 min under growth conditions. After removal of the staining solution, cells were washed once with DPBS (Gibco) and incubated for another 15 min in complete growth medium. Cells were fixed with 4% PFA/PBS, permeabilized with 0.2% (v v-1) Triton X-100 in PBS and cell nuclei were stained with DAPI. Cover slips were mounted onto microscope slides using Immu-Mount (Thermo Scientific) and mitochondrial morphology was categorized by observers, blinded to the different treatments, on an Olympus BX51 fluorescence microscope using a 60× oil immersion objective. Representative pictures were taken with the confocal microscope TCS SP5 from Leica using a 63× oil immersion objective.
Enzymatic measurements of total cellular GSH and glucose-6-phosphate dehydrogenase (G6PDH) activity
Total cellular GSH content (Lewerenz et al., 2006) and G6PDH activity (Soucek et al., 2003) were quantified enzymatically as described. The EGFP-G6PDH construct used as a positive control was a kind gift from Juan Bolanos (García-Nogales et al., 2003).
Subcellular fractionation
Differential centrifugation was performed to obtain mitochondrial and cytosolic fractions. HT22 cells were grown in 175 cm2 flasks. Cells were harvested and centrifuged at 1000× g for 6 min before cell pellets were resuspended in 200 μL mitochondria isolation buffer (200 mM mannitol, 100 mM sucrose, 10 mM HEPES, 1 mM EGTA, 5 mM MgCl2, pH 7.4) containing mini complete protease inhibitor cocktail (Roche, Mannheim, Germany). With 50 strokes of a Dounce homogenizer, cells were disrupted and homogenates were separated from nuclei and unbroken cells by a centrifugation at 1000× g for 10 min. Mitochondria-enriched pellets were obtained following centrifugation of the post-nuclear supernatants at 16 000× g for 30 min. All steps were performed at 4°C.
Immunoblotting
Primary antibodies were anti-hexokinase 1 mAB (1:200; Cell Signaling Technology, Cambridge, UK), anti-hexokinase 2 mAB (1:200; Cell Signaling Technology), anti-mitochondrial heat shock protein 70 mAB (1:1000; Affinity BioReagents), anti-S6 (1:1000; Cell Signaling Technology), anti-p-S6 pSer241/244 (1:1000; Cell Signaling Technology), anti-S6K (1:1000; Cell Signaling Technology), anti-p-S6K pThr421/pSer424 (1:1000; Cell Signaling Technology), MitoProfile total OXPHOS rodent WB antibody cocktail (1:250; MitoSciences, Eugene, OR, USA), rabbit anti-actin (1:500; Sigma, St Louis, MO, USA) or anti-actin mAB (1:2000; Chemicon, Darmstadt, Germany). For visualization, membranes were incubated with an infrared fluorescence IRDye 680 (800)-conjugated anti-mouse (rabbit) IgG secondary antibody (1:30 000; Li-Cor Biosciences, Königstein, Germany) for 1 h at room temperature and detected with the Odyssey Infrared Imaging System (Li-Cor).
Measurement of mitochondrial oxygen consumption
A phosphorylation control protocol was carried out to measure mitochondrial oxygen consumption of HT22 cells using the high-resolution respirometer Oxygraph-2k (Oroboros Instruments, Innsbruck, Austria). Intact HT22 cells were monitored in two glass chambers under continuous stirring at 750 r.p.m. at 37°C in 2 mL growth medium at a density of 1 × 10⁶ cells·mL−1. After routine respiration had been recorded, 2 μg·mL−1 of oligomycin were added to inhibit the ATP synthase and measure leak respiration. The electron transfer system (ETS) capacity was evaluated by titration of the protonophore carbonyl cyanide 4-(trifluoromethoxy) phenylhydrazone (FCCP) in 0.5 μM steps until a maximum flow was reached. Respiration was inhibited by application of 0.5 μM rotenone and 2.5 μM antimycin A to determine non-mitochondrial residual oxygen consumption (ROX).
A mitochondrial substrate-uncoupler-inhibitor-titration protocol was performed to analyse oxidative phosphorylation in permeabilized cells. Measurements were carried out at a density of 1 × 10⁶ cells·mL−1 in 2 mL mitochondrial respiration medium MiR05 (Pesta and Gnaiger, 2012) at 750 r.p.m. and 37°C in the Oxygraph-2k. After recording routine respiration, 2 mM malate (M) and 10 mM glutamate (G) were added, which allows complex I-supported respiration, followed by the addition of 5 μg digitonin per 106 cells for permeabilization and measurement of the leak state GMN (no adenylates added, N). The addition of 2 mM ADP initiated respiration and allowed the recording of state GMP (OXPHOS capacity state, P). Adding 10 mM succinate (S) induced respiration with convergent electron input of complexes I and II; this was followed by the addition of 2 mM ADP to measure state GMSP at saturating ADP concentrations. The intactness of the outer mitochondrial membrane was verified with 10 μM cytochrome c (c). Inhibition of ATP synthase was induced by 2 μg·mL−1 oligomycin and the leak state GMSL (leak state, L) was recorded. FCCP was titrated (0.5 μM steps) to evaluate the maximum ETS capacity state GMSE (ETS capacity state, E). Afterwards, complex I was inhibited by 0.5 μM of rotenone to measure the ETS state S(Rot)E. The addition of 2.5 μM antimycin A allowed the determination of ROX. All substrates and inhibitors used were obtained from Sigma.
Oxygen concentration and oxygen flow 10−6 cells were recorded in 2 s intervals using the DatLab Software 5.1 (Oroboros Instruments). In order to compare mitochondrial respiratory states, all values measured were corrected for ROX. All experiments were performed using instrumental background correction and after calibration of the polarographic oxygen sensors.
Mitochondrial superoxide production and matrix Ca2+ content
One day after seeding cells into 6-well plates, cells were stained in HBSS with 5 μM MitoSOX (Invitrogen) or with 2 μM Rhod2-AM (ABD Bioquest, Sunnyvale, CA, USA) for 10 min. Cells were then washed twice before the mean red fluorescence intensity was analysed on a FACSCalibur flow cytometer (BD Biosciences, Franklin Lakes, NJ, USA).
Measurement of extracellular lactate concentrations
In total, 3 x 10⁵ cells per well were seeded into 6-well plates and the medium changed 24 h later. After 24 h, the growth medium was collected, cells removed by centrifugation (1200× g, 5 min), and the lactate concentration determined enzymatically in the central diagnostic laboratory of the University Medical Center Mainz of the Johannes Gutenberg University.
Statistical analysis
Data are presented as mean ± SD or SEM and the statistical significance of differences between results was assessed using two-way anova followed by the Bonferroni's post hoc test or two-tailed t-tests. A P < 0.05 was considered to be statistically significant.
Results
Hippocampal cells resistant to oxidative stress are similarly resistant to inhibition of mitochondrial ATP synthase
Mouse hippocampal HT22 cells do not express ionotropic glutamate receptors and succumb to high concentrations of glutamate by endogenous oxidative stress caused by inhibition of the glutamate/cystine antiporter system xc−, which results in depletion of the cellular antioxidant glutathione (recently reviewed in Albrecht et al., 2010). Glutamate-resistant HT22 (R) cells were generated by repetitive exposure of the original clone (S cells) (Maher and Davis, 1996) to glutamate (Lewerenz et al., 2006) and are protected against oxidative glutamate toxicity, a model of endogenous oxidative stress (Figure 1A). R cells were recently demonstrated to also possess an increased mitochondrial membrane potential, which suggests an involvement of mitochondria in the resistant phenotype (Noack et al., 2012). We therefore tested whether these cells were similarly resistant to a mitochondrial toxin and treated S and R cells for 24 h with oligomycin, an inhibitor of the mitochondrial complex V, the ATP synthase. This proved that R cells were similarly resistant to a direct mitochondrial assault being 1000-fold less receptive to oligomycin than S cells (Figure 1B). To evaluate whether these cells were altered in their growth characteristics and their dependence on growth factors, we determined their proliferation rate with and without serum. Both cell lines had an identical proliferation rate in the presence of serum (Figure 1C). Glutamate-sensitive cells, in contrast, did not grow at all under serum deprivation (Figure 1C). This was, however, not caused by an increased susceptibility to starvation but rather to a less adherent phenotype. When we treated S and R cells with 2 mM EDTA, which inhibits the divalent cation-dependent substrate adhesion, more R cells remained attached after EDTA-treatment compared to S cells irrespective of the duration of EDTA treatment. After 20 min of EDTA-treatment, 1.7-fold more R cells adhered to their culture substrate compared to S cells (Figure 1D). Selection for resistance to oxidative stress therefore also results in resistance to a mitochondrial toxin without altering the general cellular growth characteristics.
Figure 1.
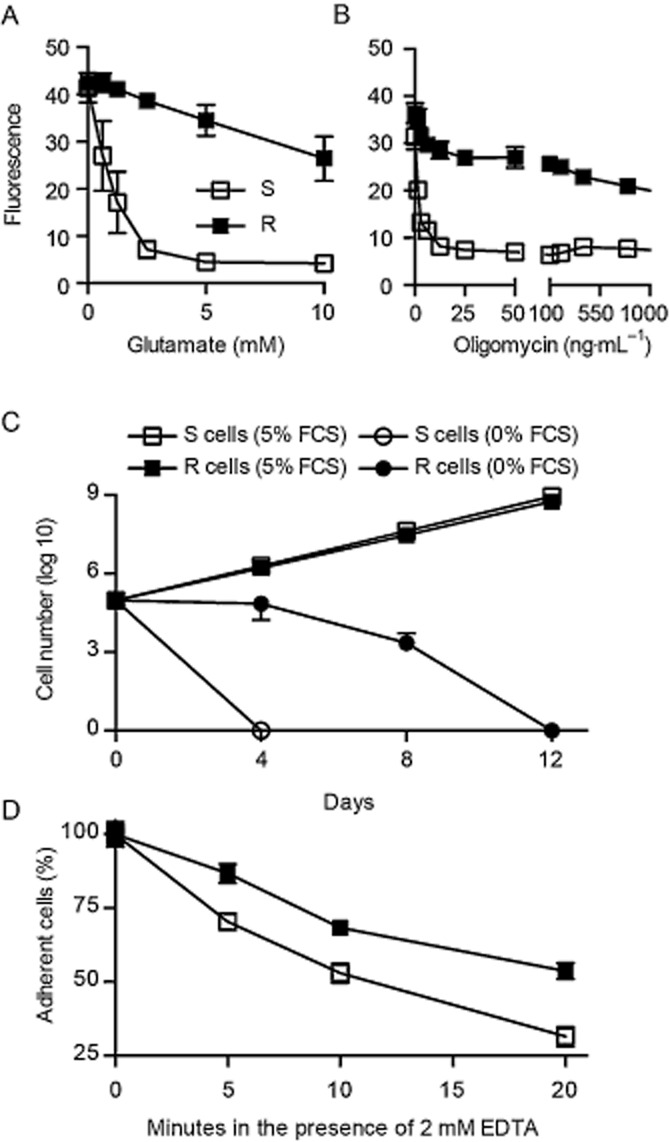
Hippocampal cells resistant to oxidative stress are similarly resistant to inhibition of the mitochondrial ATP synthase. (A, B) 5 x 10³ glutamate-sensitive and glutamate-resistant S and R cells were seeded into 96-well plates and subjected to the indicated concentrations of (A) glutamate or (B) oligomycin 24 h later. Viability was quantified 22 h after addition of glutamate and 24 h after the beginning of the oligomycin treatment with the CellTiter Blue reagent. Fluorescence values (mean ± SD) of five replicates obtained in three independent experiments were plotted against the glutamate and oligomycin concentrations respectively. (C) Growth curves in medium containing the indicated concentrations of FCS were obtained by plating the cells every 4 days at a density of 1 x 10⁴ cells cm-2 into 6-well plates. The number of cells at each step for each well was calculated as the average cell number at the previous step divided by the number of seeded cells multiplied by the current cell number. (D) 5 x 10³ S and R cells were seeded in 96-well plates. Twenty-four hours later, the medium was replaced by 100 μL PBS with 2 mM EDTA at different time points, and the plate was shaken directly after addition of PBS without EDTA to control wells. Six replicates were performed in parallel for every condition. After being shaken, PBS or PBS/EDTA were aspired, and cells were washed with 100 μL medium to remove detached cells. The remaining cells were quantified by a cell death assay.
Altered mitochondrial shape and relative abundance of mitochondrial OXPHOS complexes in glutamate-resistant cells
Mitochondria constantly fuse and divide, resulting in distinct shapes ranging from tubular to fragmented. These processes are highly dynamic and important for mitochondrial bioenergetics and cellular survival [reviewed in (Westermann, 2010)]. Glutamate toxicity was previously shown to cause mitochondrial fragmentation and perinuclear accumulation (Grohm et al., 2010; Kumari et al., 2012). Therefore, we first investigated the mitochondrial shape in S and R cells by staining the cells with the mitochondrial-targeted dye MitoTracker. After fixation, the mitochondrial shape was analysed by fluorescence microscopy and 100 cells for each condition categorized. Categories were defined as aggregated, fragmented, vesicular, tubular or mixed (Figure 2A). This analysis revealed a less fragmented shape for mitochondria in R cells (Figure 2B).
Figure 2.
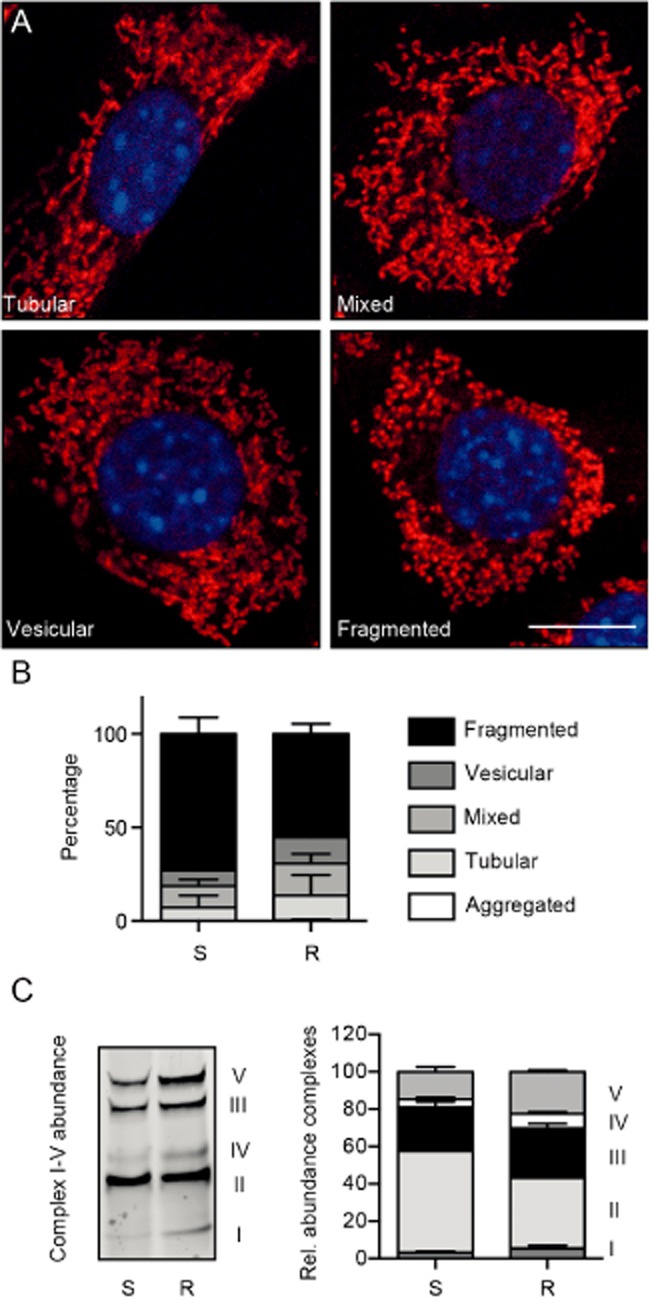
Altered mitochondrial shape and stoichiometry of mitochondrial respiratory chain complexes in glutamate-resistant cells. (A) The mitochondrial morphology of S and R cells was analysed by fluorescence microscopy. Cells were stained with MitoTracker Red and DAPI, and categorized by their mitochondrial morphology as aggregated (not shown), tubular, mixed, vesicular or fragmented. Cells exhibiting a mixed category had tubular as well as fragmented mitochondria while cells with a vesicular phenotype showed mainly fragmented and only a few tubular mitochondria. Representative pictures of each category are shown. Scale bar represents 10 µM. (B) The quantification of changes in mitochondrial shape revealed a reduced number of R cells in the fragmented mitochondrial category. Data were collected by two blinded observers from three independent experiments and are shown as the mean ± SEM. (C) Immunoblot with mitochondrial fractions from glutamate-sensitive (S) and glutamate-resistant (R) HT22 cells probed with an antibody mix against mitochondrial complex proteins and the quantification of three immunoblots. Data are shown as mean ± SEM.
We next investigated the effect of glutamate resistance on the composition and abundance of mitochondrial OXPHOS complexes using a mixture of antibodies specific to proteins for each of the five OXPHOS complexes. Three independent blots were quantified and the overall abundance of the complexes was set to 100%. This analysis indicated a relative increase in subunit abundance of complexes V, IV and III at the expense of complex II in R cells (Figure 2C), suggesting changes in the mitochondrial energy production in glutamate-resistant cells.
Reduced mitochondrial respiratory activity in intact glutamate-resistant cells
Because of the differences seen in the expression levels of the mitochondrial complexes, we used high-resolution respirometry to determine whether the cell lines differ in their mitochondrial respiration. R cells were maintained under a 10 mM glutamate treatment to sustain their glutamate-resistant phenotype. Representative recordings measuring the oxygen consumption of intact S and R cells are shown in Figure 3A. After recording cellular routine respiration of intact cells at basal activity in culture medium, the ATP synthase (complex V) was inhibited by the addition of oligomycin, which induces non-phosphorylating leak respiration and the leak oxygen flux (L) compensating for proton leak, proton slip, electron slip and cation cycling (Ca2+, K+) was measured (Pesta and Gnaiger, 2012). By titration of the uncoupler and protonophore FCCP, the oxygen consumption was stimulated to determine the ETS capacity state (E) at the optimum FCCP concentration and maximum oxygen flux, a state of maximum non-coupled respiration (Pesta and Gnaiger, 2012). To correct routine, leak and ETS for non-mitochondrial oxygen consumption, rotenone and antimycin A were added, which inhibit complexes I and III respectively. The inhibition of respiration allows the recording of ROX, which can be explained mainly by non-mitochondrial oxygen consumption of auto-oxidation reactions as well as many cellular oxygen-consuming enzymes such as oxidase and peroxidase (Pesta and Gnaiger, 2012). Oxygen flow per cells at routine respiration was significantly reduced in R cells (Figure 3B). The non-phosphorylating leak respiration after inhibition of ATP synthase was comparable in both cell lines, while R cells showed a significantly lower ETS capacity state (Figure 3B). Thus, R cells apparently display reduced maximal mitochondrial respiratory capacity.
Figure 3.
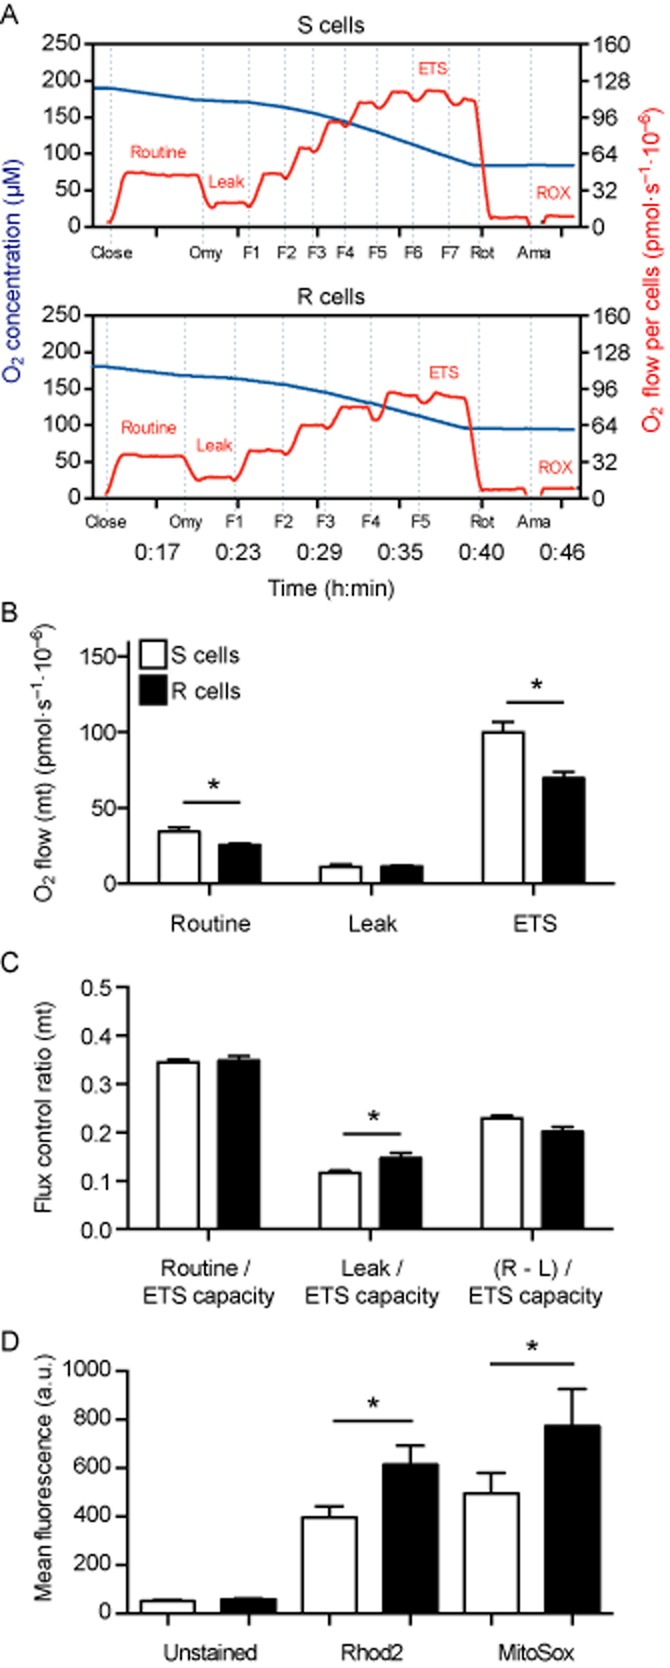
Reduced mitochondrial respiratory activity in intact glutamate-resistant cells. (A) Representative traces measured by high-resolution respirometry showing oxygen concentration (blue line) and oxygen flow per cells (red line) of intact S and R cells. The addition of oligomycin (Omy), FCCP (F), rotenone (Rot) and antimycin A (Ama) is indicated. Sections reflecting routine respiration, leak respiration induced by inhibition of ATP synthase using oligomycin, ETS capacity at maximum FCCP concentration and oxygen flow, followed by ROX through inhibition of complex I (rotenone) and complex III (antimycin A) are indicated. (B) Oxygen flow per cells corrected for ROX at the indicated mitochondrial respiration state. Basal cellular routine respiration and ETS capacity were reduced in glutamate-resistant R cells while leak respiration was comparable in both cell lines. (C) Calculated mitochondrial (mt) flux control ratios show basal cellular routine respiration (R), leak respiration (L) and fraction of respiration (netR = R-L) used for ATP production normalized to ETS capacity. The leak oxygen flux ratio is enhanced in R cells whereas the basal routine respiration relative to ETS capacity as well as the fraction used for phosphorylating respiration [netR/E as (R-L)/ETS capacity] was comparable in both cell lines. The bar graphs in (B) and (C) show the mean O2 flow per cell ± SEM or flux control ratios ± SEM of three independent experiments performed in duplicate. (D) S and R cells were stained with Rhod2-AM (mitochondrial Ca2+) and MitoSox (mitochondrial superoxide) and analysed by flow cytometry. The bar graphs show the mean fluorescence intensity ± SEM of three independent experiments performed in triplicate. Statistical significance was calculated in all experiments using Student's two-tailed t-test and P < 0.05 is indicated by an asterisk.
Nevertheless, the expression of mitochondrial respiration relative to the maximum ETS capacity state (E) (Figure 3C) showed that the routine respiration relative to E was similar in both cell lines, whereas the leak control ratio (L/E) was significantly higher in R cells. Therefore, in R cells, leak oxygen flux, which compensates for proton leak and slip, electron slip as well as cation cycling, is closer to the upper limit of the ETS capacity. However, the fraction used for phosphorylating respiration and consequently for ATP production (netR/E) was comparable in both cell lines. We concluded from these results that glutamate resistance correlates with reduced respiratory activity.
Increased mitochondrial Ca2+ content and superoxide production in glutamate-resistant cells
The mitochondrial matrix [Ca2+] stimulates Krebs cycle dehydrogenases and can therefore be considered as a surrogate marker of mitochondrial function [reviewed in (Hajnóczky et al., 2006)]. We quantified the mitochondrial Ca2+ content by flow cytometry using the mitochondrial dye Rhod2-AM and surprisingly found a statistically significant increase in the mean fluorescence intensity of R cells (Figure 3D). This correlated with a similar increase in mitochondrial superoxide production in R cells quantified in parallel experiments with the dye MitoSox (Figure 3D). Together with the results from high-resolution respirometry, we interpreted these data by assuming that the mitochondrial respiratory activity is inhibited at later stages of oxidative phosphorylation and that an electron slip induces superoxide production in these cells.
Increased oxidative phosphorylation capacity in permeabilized glutamate-resistant cells
We further investigated the different respiratory states of mitochondria in permeabilized HT22 cells to gain a deeper understanding of the respiratory control mechanisms in S and R cells and to test the hypothesis that the mitochondrial respiratory activity is attenuated at the phosphorylation step in R cells. These results are shown in Figure 4. Routine endogenous respiration, which is still dependent on intracellular substrates, was reduced in R cells in line with the results obtained in intact cells (Figure 3B). After addition of glutamate, malate and the permeabilizing agent digitonin, comparable leak states GMN were determined in S and R cells. Application of 2 mM ADP allowed the quantification of the OXPHOS state GMP, which is dependent on electron supply into the respiratory system through complex I (NADH-UQ oxidoreductase). Then, succinate, the substrate of complex II, was added to record the OXPHOS state GMSP with convergent electron input of complexes I and II into the Q-junction. The second addition of ADP after succinate did not elicit any significant increase in respiration, indicating that the GMSP state was quantified at saturating ADP supply. GMP and GMSP oxygen flow per cells were both increased in R cells implying an increased and not decreased OXPHOS capacity, which was not expected from the results from intact cells. The intactness of the outer mitochondrial membrane was confirmed by the application of cytochrome c, which caused an elevation of less than 15% in the experiments used for this analysis. The respiratory states GMSL (after oligomycin-induced inhibition of complex V) and the ETS state GMSE (after titration of the uncoupler FCCP) were comparable in S and R cells. The stimulation by FCCP indicates that the mitochondrial respiration is limited by the phosphorylating part, ATP synthase. Then, the ETS state S(Rot)E, which reflects only the respiratory capacity dependent on complex II and its substrate succinate, was induced by adding rotenone, which was again significantly higher in R cells. At the end of the SUIT protocol, antimycin A was added to quantify ROX, which was used as a correction to allow the comparison of mitochondrial-dependent oxygen consumption.
Figure 4.
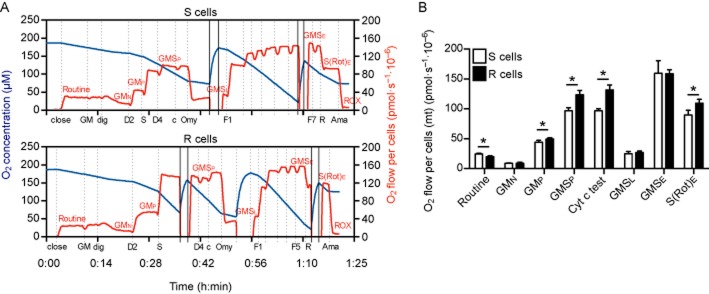
Increased oxidative phosphorylation capacity in permeabilized glutamate-resistant cells. Representative traces measured by high-resolution respirometry showing oxygen concentration (blue line) and oxygen flow per cells (red line) of digitonin-permeabilized S and R cells. The addition of glutamate (G), malate (M), digitonin (dig), ADP (D), succinate (S), cytochrome c (c), oligomycin (Omy), FCCP (F), rotenone (R) and antimycin A (Ama) is indicated with dotted lines while re-oxygenation and closing of the chambers are marked with continuous lines. Sections reflecting certain respiratory states are labelled. After measurement of routine endogenous cell respiration and addition of glutamate, malate and permeabilization by digitonin, the leak state GMN with no adenylates added (N) was recorded. Mitochondrial respiration was stimulated by ADP (D2), which led to the OXPHOS capacity state (P) GMP, while the addition of succinate and ADP (D4) to a final concentration of 4 mM allowed the recording of the OXPHOS capacity state GMSP with convergent input of electrons via complexes I and II into the respiratory system. The intactness of the mitochondrial membrane was tested by the application of cytochrome c (Cyt c test). The leak state GMSL was induced by oligomycin-dependent inhibition of the ATP synthase. The ETS capacity state (E) at maximum oxygen flow per cells, reflecting ETS state GMSE, was determined through titration of FCCP. Inhibition of complex I by rotenone allowed the measurement of the ETS state S(Rot)E, which is dependent only on electron input via complex II. ROX was measured by the antimycin A-induced inhibition of complex III. (B) Oxygen flow per cells corrected for ROX at the indicated mitochondrial respiration state. Endogenous routine respiration was reduced in glutamate-resistant R cells, while the OXPHOS capacity GMP and GMSP were increased as well as the complex II-dependent ETS capacity S(Rot)E in the glutamate-resistant R cells in comparison to S cells. The bar graphs show the mean O2 flow per cells ± SD of four independent experiments performed in duplicate. Statistical significance was calculated using Student's two-tailed t-test and P < 0.05 is indicated by an asterisk.
Therefore, mitochondria of glutamate-resistant cells have a reduced functioning of the respiratory system only in intact cells and in cells in mitochondrial respiratory medium before permeabilization that still rely on intracellular substrates. This implies that the reduction in respiratory capacity in intact cells is caused by lack of or alternative use of substrates, suggesting that R cells rely on other pathways to generate the energy necessary to sustain their metabolic processes.
Glutamate-resistant cells are susceptible to inhibition of glycolysis
We inhibited an alternative energy-producing pathway, glycolysis, with deoxyglucose, a glucose that cannot be converted by hexokinases and quantified cell survival. In these assays, S and R cells were similarly vulnerable to inhibition of glycolysis (Figure 5A). Exchanging glucose with galactose, another sugar that cannot be metabolized by hexokinases (Marroquin et al., 2007), caused a reduction in growth that was more pronounced in R cells and rendered both cell lines more susceptible to deoxyglucose-mediated cell death (Figure 5B). Both deoxyglucose and galactose also abolished the 1000-fold increase in oligomycin resistance observed in R cells (compare Figures 1B and 5C).
Figure 5.
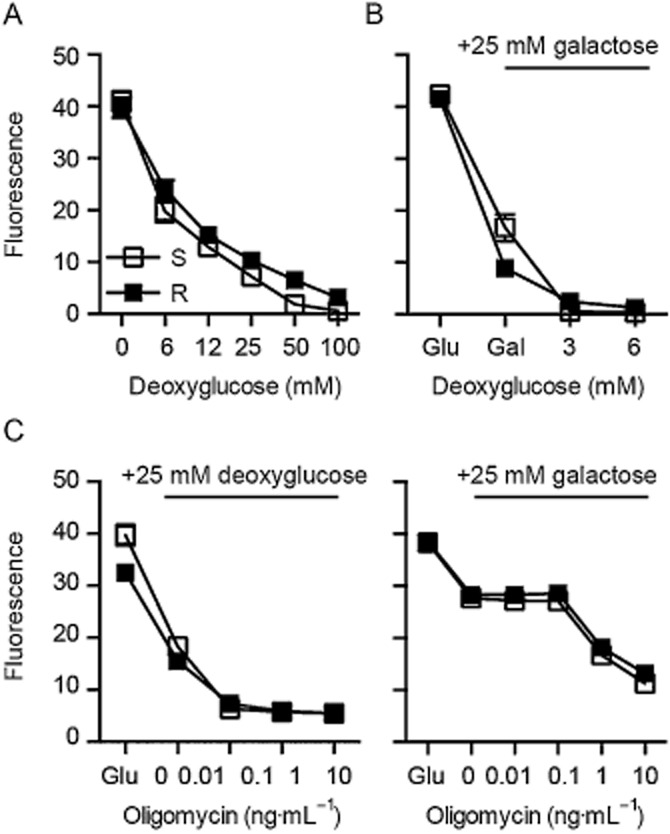
Glutamate-resistant cells are susceptible to inhibition of glycolysis. Glutamate-sensitive and glutamate-resistant S and R cells (5 x 10³) were seeded into 96-well plates and subjected to the indicated concentrations of (A, B) deoxyglucose or (C) oligomycin in the presence of the indicated sugars. Viability was quantified in (A) and (B) after 72 h and in (C) after 24 h with CellTiter Blue reagent. Mean ± SD fluorescence values of quintuplicate results obtained in three independent experiments were plotted against various concentrations of the indicated compounds.
These results suggest that R cells use non-mitochondrial pathways of energy production. Such a shift from oxidative phosphorylation to non-mitochondrial pathways of energy production, especially glycolysis despite sufficient oxygen supply, is one of the most common phenotypes of cancer cells and known as the Warburg effect, defined as elevated glycolysis in the presence of oxygen. Pedersen and colleagues showed that in tumours exhibiting the Warburg effect, the hexokinase isoform hexokinase-2 (HK-2) is up-regulated and binds to the voltage-dependent anion channel of the mitochondrial outer membrane. In contrast to cytosolic hexokinases, mitochondrial bound HK-2 is not inhibited by its product glucose-6-phosphate and gains preferential access to ATP synthesized by the ATP synthase located in the inner mitochondrial membrane, which results in increased HK-2 activity (Pedersen, 2007).
Increased expression of cytosolic hexokinase 1 and 2 in glutamate-resistant R cells
In order to clarify whether the Warburg effect plays a role in glutamate resistance, we investigated the abundance of hexokinases in immunoblots with mitochondria-enriched and cytosolic cell fractions. Since HK-2 is not very abundant, we also included its homologue HK-1, which is more prominent in neurons. Immunoblots were additionally probed with antibodies against β-actin and the mitochondrial marker heat shock protein 70 (HSP70) to allow normalization and quantification of expression levels. Typical immunoblots are shown in the upper panels of Figure 6. Both hexokinases were observed in cytosolic and mitochondrial fractions of both cell lines. Quantification of three blots revealed that both hexokinases HK-1 and HK-2 were up-regulated in R cells but were predominantly located in the cytosol (Figure 6A,B). Thus, glutamate-resistant cells do not show an increased mitochondrial localization of these cytosolic enzymes that is a signature of cancer cells.
Figure 6.
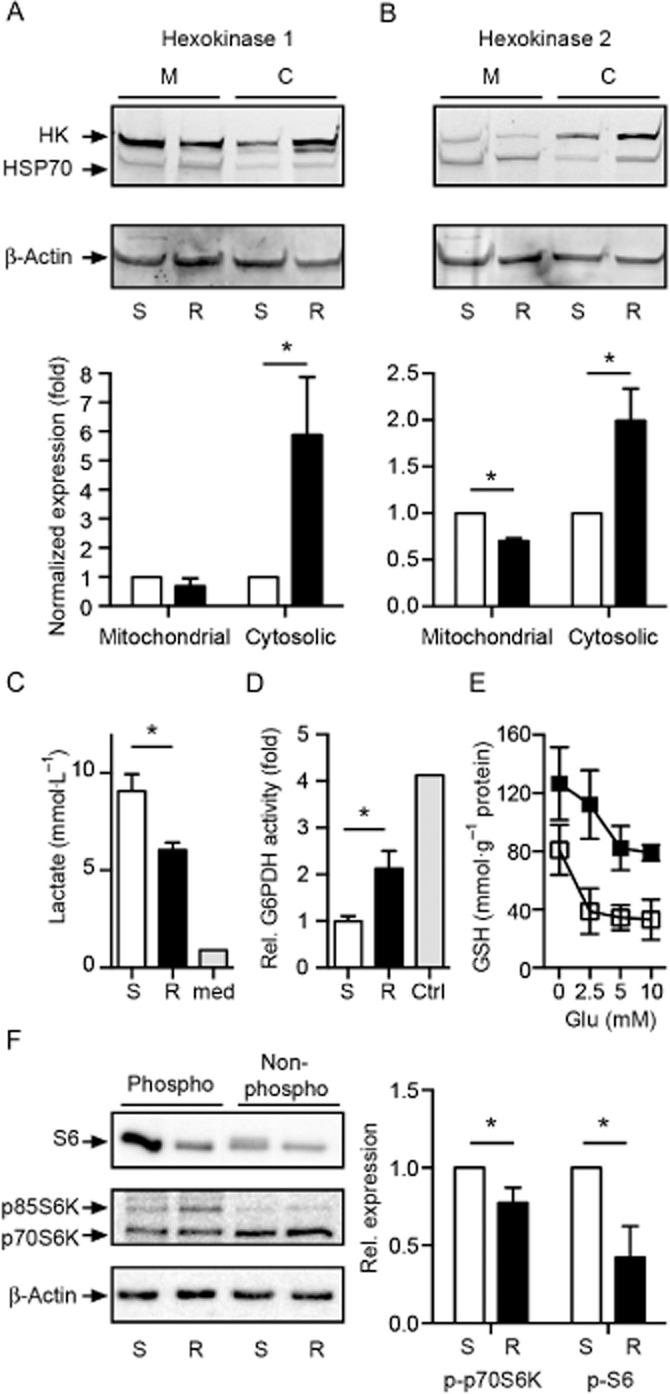
Increased expression of cytosolic hexokinase 1 and 2 and activity of glucose-6-phosphate dehydrogenase in glutamate-resistant R cells. Immunoblot with mitochondrial and cytosolic fractions of glutamate-sensitive (S) and glutamate-resistant (R) HT22 cells. The blot was probed with antibodies against (A) hexokinases HK-1 and (B) HK-2, β-actin and the mitochondrial marker HSP70. To quantify the results, HK-1 and HK-2 expression was normalized to HSP70 and β-actin expression before the ratio between mitochondria-bound and cytosolic hexokinases was determined. (C) One day after seeding, the growth medium was changed and analysed enzymatically 24 h later for its lactate content. Data obtained from two independent experiments in duplicate are shown as mean ± SD and were analysed using two-tailed t-tests. The lactate concentration in fresh growth medium was 0.9 mmol·L−1. (D) The activity of G6PDH was quantified enzymatically in S and R cells and in S cells transfected with either empty vector or EGFP-G6PDH as control. The values of three independent experiments were normalized to the values obtained from S (and vector-transfected cells – which were identical) and are shown as mean ± SEM. (E) Total cellular GSH content was enzymatically quantified in cells treated with the indicated amount of glutamate for 8 h. Data are shown as mean ± SEM and were collected from three independent experiments in duplicate. (F) Immunoblot analysis of S and R cell lysates using anti-phospho-S6 (p-S6) or anti-phospho S6 kinase (p-p70S6K, p-p85S6K) antibodies. Band intensities were normalized to total S6 or total S6 kinase and compared with actin. Representative immunoblots and quantifications of four (p-S6) or five (p-S6K) independent experiments are shown. Statistical significance was calculated using Student's t-test, *P < 0.05.
Less lactate production and increased glutathione content suggest a predominance of the hexose monophosphate shunt in glutamate-resistant cells
The susceptibility of glutamate-resistant cells to deoxyglucose and the prominent up-regulation of both hexokinases nevertheless suggested increased glucose metabolism which, however, did not seem to be directed towards glycolysis. Indeed, when we quantified the end product of glycolysis, lactate, in medium conditioned by these cell lines, we observed a significant reduction in R cells (Figure 6C). We therefore hypothesize that these cells direct glucose metabolites towards the hexose monophosphate shunt, which generates NADPH that can subsequently be used to reduce oxidized glutathione. This is in line with the upregulation of G6PDH activity, which catalyses the first rate-limiting step in the HMS (Figure 6D), and the markedly elevated GSH content in these cells not only at baseline but also during glutamate exposure (Figure 6E).
No involvement of the mammalian target of rapamycin in the phenotype of glutamate-resistant cells
Activation of mTORC1, a protein complex harbouring the mammalian target of rapamycin complex 1 (mTOR; Alexander et al., 2013b), Raptor and mLST8 as core components, can stimulate specific metabolic pathways including glycolysis and the HMS (Düvel et al., 2010). Thus, enhanced mTOR signalling may account for a shift in energy metabolism away from oxidative phosphorylation as observed in R cells. To analyse the activity of the mTORC1 signalling pathway in R and S cells, we measured the phosphorylation of two targets of this pathway, ribosomal protein S6 and S6 kinase (S6K), by immunoblot experiments. The phosphorylated forms of both S6 and the 70 kDa isoform of S6K (p70S6K) were, however, significantly lower in R cells than in S cells (Figure 6F), indicating that the shift in energy metabolism away from oxidative phosphorylation in R cells is not due to enhanced mTOR signalling.
Discussion and conclusion
Under physiological conditions, cellular energy demands are mainly met by mitochondrial oxidative phosphorylation. ROS are released as by-products and are readily detoxified by mechanisms that become challenged under conditions of oxidative stress. In agreement with our previous studies, we found that glutamate-resistant R cells have an increased cellular GSH content that serves as a major antioxidant. NADPH is essential in the regeneration of reduced GSH. It is well known that the HMS leads to reduction of NADP+ to NADPH, and an antioxidant function of the HMS has been demonstrated in several laboratories (Ben-Yoseph et al., 1996; García-Nogales et al., 2003; Vaughn and Deshmukh, 2008). Our data show increased survival of R cells in the presence of the ATP synthase inhibitor oligomycin compared with S cells. Since these data indicate that R cells are less dependent on oxidative phosphorylation than S cells, we studied glycolysis and the HMS, the major non-mitochondrial pathways of energy metabolism. R cells produced less lactate, suggesting that glycolysis plays a minor role for energy metabolism. In contrast, increased cytosolic abundance of hexokinase 1 and 2 in R cells suggested that these cells predominantly utilize the HMS. We therefore hypothesize that R cells show an increased flux of glucose through the HMS and that the resulting synthesis of NADPH(H+) contributes to maintain elevated GSH in R cells in addition to an increased synthesis mediated by an up-regulation of the glutamate/cystine antiporter system and its specific subunit xCT (Lewerenz et al., 2006).
Three transcription factors could mediate these alterations: activating transcription factor 4 (ATF4), nuclear factor-erythroid 2-related factor-2 (Nrf2) and the mTORC1 signalling complex (Düvel et al., 2010) (which was effectively ruled out in this study). R cells have increased levels of ATF4 caused by a 13 base pair (bp) deletion in the upstream open reading frame of ATF4, which almost abolishes eIF2α-mediated suppression of ATF4 translation (Lewerenz et al., 2012). Others have shown that ATF4 induces enzymes involved in amino acid biosynthesis and transport, ultimately providing precursor amino acids for glutathione biosynthesis (Endo et al., 2009). ATF4 is required to maintain elevated levels of GSH and thereby serves as an antioxidant and cytoprotectant in oxidative stress, especially in this model system (Lewerenz and Maher, 2009). ATF4 has, however, not yet been shown to be involved in the regulation of cellular metabolism. In addition to ATF4-induced genes, many antioxidant genes contain an antioxidant response element in the promoter region that is transactivated by Nrf2. Nrf2 ameliorates glutamate-induced oxidative stress in HT22 cells (Lewerenz et al., 2009; Albrecht et al., 2012) but plays a negligible role in the phenotype of glutamate-resistant cells (Lewerenz et al., 2012). Studies in Nrf2-knockout mice, however, revealed that Nrf2 indeed regulates several genes encoding enzymes in the HMS (Wu et al., 2011). ATF4 and, to a lesser extent, Nrf2 are therefore important in the protective phenotype of R cells and it is possible that they also contribute to the effects on metabolism observed here.
We were also puzzled by the apparent contradiction of the lower dependency of R cells on oxidative phosphorylation with the findings of an increased mitochondrial membrane potential (Noack et al., 2012), increased mitochondrial superoxide production and elevated mitochondrial calcium levels, which were expected to increase the oxidative phosphorylation system. Although it is widely suggested that mitochondrial calcium leads to an enhancement of respiration and ATP production (Brookes et al., 2004), others observed an increased mitochondrial calcium uptake under glucose stimulation with Ehrlich ascites tumour cells, which inhibited the ATP synthase (Evtodienko et al., 1994). We, however, assume a different regulation of glucose utilization and energy production system in R cells as an explanation for these findings. We investigated mitochondrial respiration with high-resolution respirometry in intact HT22 cells and found reduced basal respiration (routine respiration) and maximum ETS capacity in growth medium. Interestingly, the leak respiration was, considering the absolute values, comparable in both cell lines, but in the case of a proportionally reduced respiration and maximum ETS capacity in R cells, the fraction used for phosphorylating respiration, calculated as the netR/E ratio [as (Routine – Leak)/ETS capacity] did not differ. Due to the comparable leak respiration and the decreased ETS capacity, the leak control ratio L/E was elevated in R cells, although the absolute values of leak respiration were not significantly different. This may suggest a higher fraction of non-phosphorylating respiration being used under basal activity in R cells and a reverse activity of the ATP synthase under energy depletion conditions, leading to hydrolysis of ATP to maintain or even elevate the mitochondrial membrane potential, which is important for the morphological integrity and transport processes of the inner mitochondrial membrane (Faccenda and Campanella, 2012). This hypothesis suggests that under these conditions the cells tolerate energy loss and ineffective energy metabolism to protect the membrane potential. A higher membrane potential also explains the relatively higher leak respiration in R cells, which compensates for proton slip, electron slip, proton leak and cation cycling (Pesta and Gnaiger, 2012). The potentially elevated electron slip would provide the basis for enhanced mitochondrial superoxide production, being completely in line with the findings of this study. Interestingly, the OXPHOS states based on the respiratory activity of complex I and combined complexes I + II were significantly higher in permeabilized R cells with exogenous supply of substrates in comparison to S cells. With the permeabilization of the cells, substrates for the complexes I + II as well as ADP were added in excess, thereby effectively abolishing the substrate limitation of cellular respiration in intact R cells reflecting mitochondrial respiration close to cell culture conditions. We therefore hypothesize that cellular respiration in intact cells is limited by the availability of substrates that might be preferentially utilized in alternative pathways of energy metabolism such as the HMS.
In summary, our results indicate that mitochondrial and metabolic adaptations play an important role in the resistance of cells to oxidative stress.
Acknowledgments
This work was supported by the Else Kröner-Fresenius-Stiftung (P28/10//A39/10) and the Deutsche Forschungsgemeinschaft (SFB1080). We thank Darragh O'Neill for excellent proofreading. This publication is part of a doctoral thesis of Annika Pfeiffer, who is affiliated with the Department of Biology of the Johannes Gutenberg-University Mainz.
Glossary
- E
ETS capacity state
- ETS
electron transfer system
- HMS
hexose monophosphate shunt
- L
leak state
- P
OXPHOS capacity state
- ROX
residual oxygen consumption
Conflict of interest
None.
References
- Albrecht P, Lewerenz J, Dittmer S, Noack R, Maher P, Methner A. Mechanisms of oxidative glutamate toxicity: the glutamate/cystine antiporter system xc− as a neuroprotective drug target. CNS Neurol Disord Drug Targets. 2010;9:373–382. doi: 10.2174/187152710791292567. [DOI] [PubMed] [Google Scholar]
- Albrecht P, Bouchachia I, Goebels N, Henke N, Hofstetter HH, Issberner A, et al. Effects of dimethyl fumarate on neuroprotection and immunomodulation. J Neuroinflammation. 2012;9:163. doi: 10.1186/1742-2094-9-163. [DOI] [PMC free article] [PubMed] [Google Scholar]
- Alexander SPH, Benson HE, Faccenda E, Pawson AJ, Sharman JL, Spedding M, et al. The concise guide to pharmacology 2013/2014. Transporters. Br J Pharmacol. 2013a;170:1706–1796. doi: 10.1111/bph.12450. [DOI] [PMC free article] [PubMed] [Google Scholar]
- Alexander SPH, Benson HE, Faccenda E, Pawson AJ, Sharman JL, Spedding M, et al. The concise guide to pharmacology 2013/2014. Enzymes. Br J Pharmacol. 2013b;170:1797–1867. doi: 10.1111/bph.12451. [DOI] [PMC free article] [PubMed] [Google Scholar]
- Ben-Yoseph O, Boxer PA, Ross BD. Assessment of the role of the glutathione and pentose phosphate pathways in the protection of primary cerebrocortical cultures from oxidative stress. J Neurochem. 1996;66:2329–2337. doi: 10.1046/j.1471-4159.1996.66062329.x. [DOI] [PubMed] [Google Scholar]
- Brookes PS, Yoon Y, Robotham JL, Anders MW, Sheu S-S. Calcium, ATP, and ROS: a mitochondrial love-hate triangle. Am J Physiol Cell Physiol. 2004;287:C817–C833. doi: 10.1152/ajpcell.00139.2004. [DOI] [PubMed] [Google Scholar]
- Dittmer S, Sahin M, Pantlen A, Saxena A, Toutzaris D, Pina A-L, et al. The constitutively active orphan G-protein-coupled receptor GPR39 protects from cell death by increasing secretion of pigment epithelium-derived growth factor. J Biol Chem. 2008;283:7074–7081. doi: 10.1074/jbc.M704323200. [DOI] [PubMed] [Google Scholar]
- Drechsel DA, Patel M. Respiration-dependent H2O2 removal in brain mitochondria via the thioredoxin/peroxiredoxin system. J Biol Chem. 2010;285:27850–27858. doi: 10.1074/jbc.M110.101196. [DOI] [PMC free article] [PubMed] [Google Scholar]
- Dringen R. Metabolism and functions of glutathione in brain. Prog Neurobiol. 2000;62:649–671. doi: 10.1016/s0301-0082(99)00060-x. [DOI] [PubMed] [Google Scholar]
- Düvel K, Yecies JL, Menon S, Raman P, Lipovsky AI, Souza AL, et al. Activation of a metabolic gene regulatory network downstream of mTOR complex 1. Mol Cell. 2010;39:171–183. doi: 10.1016/j.molcel.2010.06.022. [DOI] [PMC free article] [PubMed] [Google Scholar]
- Endo J, Sano M, Katayama T, Hishiki T, Shinmura K, Morizane S, et al. Metabolic remodeling induced by mitochondrial aldehyde stress stimulates tolerance to oxidative stress in the heart. Circ Res. 2009;105:1118–1127. doi: 10.1161/CIRCRESAHA.109.206607. [DOI] [PubMed] [Google Scholar]
- Evtodienko YV, Teplova VV, Duszyński J, Bogucka K, Wojtczak L. The role of cytoplasmic [Ca2+] in glucose-induced inhibition of respiration and oxidative phosphorylation in Ehrlich ascites tumour cells: a novel mechanism of the Crabtree effect. Cell Calcium. 1994;15:439–446. doi: 10.1016/0143-4160(94)90108-2. [DOI] [PubMed] [Google Scholar]
- Faccenda D, Campanella M. Molecular regulation of the mitochondrial F(1)F(o)-ATPsynthase: physiological and pathological significance of the inhibitory factor 1 (IF(1) Int J Cell Biol. 2012;2012:367934. doi: 10.1155/2012/367934. [DOI] [PMC free article] [PubMed] [Google Scholar]
- García-Nogales P, Almeida A, Bolaños JP. Peroxynitrite protects neurons against nitric oxide-mediated apoptosis. A key role for glucose-6-phosphate dehydrogenase activity in neuroprotection. J Biol Chem. 2003;278:864–874. doi: 10.1074/jbc.M206835200. [DOI] [PubMed] [Google Scholar]
- Grohm J, Plesnila N, Culmsee C. Bid mediates fission, membrane permeabilization and peri-nuclear accumulation of mitochondria as a prerequisite for oxidative neuronal cell death. Brain Behav Immun. 2010;24:831–838. doi: 10.1016/j.bbi.2009.11.015. [DOI] [PubMed] [Google Scholar]
- Hajnóczky G, Csordás G, Das S, Garcia-Perez C, Saotome M, Sinha Roy S, et al. Mitochondrial calcium signalling and cell death: approaches for assessing the role of mitochondrial Ca2+ uptake in apoptosis. Cell Calcium. 2006;40:553–560. doi: 10.1016/j.ceca.2006.08.016. [DOI] [PMC free article] [PubMed] [Google Scholar]
- Kudin AP, Augustynek B, Lehmann AK, Kovács R, Kunz WS. The contribution of thioredoxin-2 reductase and glutathione peroxidase to H(2)O(2) detoxification of rat brain mitochondria. Biochim Biophys Acta. 2012;1817:1901–1906. doi: 10.1016/j.bbabio.2012.02.023. [DOI] [PubMed] [Google Scholar]
- Kumari S, Mehta SL, Li PA. Glutamate induces mitochondrial dynamic imbalance and autophagy activation: preventive effects of selenium. Plos ONE. 2012;7:e39382. doi: 10.1371/journal.pone.0039382. [DOI] [PMC free article] [PubMed] [Google Scholar]
- Landshamer S, Hoehn M, Barth N, Duvezin-Caubet S, Schwake G, Tobaben S, et al. Bid-induced release of AIF from mitochondria causes immediate neuronal cell death. Cell Death Differ. 2008;15:1553–1563. doi: 10.1038/cdd.2008.78. [DOI] [PMC free article] [PubMed] [Google Scholar]
- Lewerenz J, Maher P. Basal levels of eIF2alpha phosphorylation determine cellular antioxidant status by regulating ATF4 and xCT expression. J Biol Chem. 2009;284:1106–1115. doi: 10.1074/jbc.M807325200. [DOI] [PMC free article] [PubMed] [Google Scholar]
- Lewerenz J, Letz J, Methner A. Activation of stimulatory heterotrimeric G proteins increases glutathione and protects neuronal cells against oxidative stress. J Neurochem. 2003;87:522–531. doi: 10.1046/j.1471-4159.2003.02019.x. [DOI] [PubMed] [Google Scholar]
- Lewerenz J, Klein M, Methner A. Cooperative action of glutamate transporters and cystine/glutamate antiporter system Xc-protects from oxidative glutamate toxicity. J Neurochem. 2006;98:916–925. doi: 10.1111/j.1471-4159.2006.03921.x. [DOI] [PubMed] [Google Scholar]
- Lewerenz J, Albrecht P, Tien M-LT, Henke N, Karumbayaram S, Kornblum HI, et al. Induction of Nrf2 and xCT are involved in the action of the neuroprotective antibiotic ceftriaxone in vitro. J Neurochem. 2009;111:332–343. doi: 10.1111/j.1471-4159.2009.06347.x. [DOI] [PubMed] [Google Scholar]
- Lewerenz J, Sato H, Albrecht P, Henke N, Noack R, Methner A, et al. Mutation of ATF4 mediates resistance of neuronal cell lines against oxidative stress by inducing xCT expression. Cell Death Differ. 2012;19:847–858. doi: 10.1038/cdd.2011.165. [DOI] [PMC free article] [PubMed] [Google Scholar]
- Li Y, Maher P, Schubert D. A role for 12-lipoxygenase in nerve cell death caused by glutathione depletion. Neuron. 1997;19:453–463. doi: 10.1016/s0896-6273(00)80953-8. [DOI] [PubMed] [Google Scholar]
- Maher P, Davis JB. The role of monoamine metabolism in oxidative glutamate toxicity. J Neurosci. 1996;16:6394–6401. doi: 10.1523/JNEUROSCI.16-20-06394.1996. [DOI] [PMC free article] [PubMed] [Google Scholar]
- Marroquin LD, Hynes J, Dykens JA, Jamieson JD, Will Y. Circumventing the Crabtree effect: replacing media glucose with galactose increases susceptibility of HepG2 cells to mitochondrial toxicants. Toxicol Sci. 2007;97:539–547. doi: 10.1093/toxsci/kfm052. [DOI] [PubMed] [Google Scholar]
- Noack R, Frede S, Albrecht P, Henke N, Pfeiffer A, Knoll K, et al. Charcot-Marie-Tooth disease CMT4A: GDAP1 increases cellular glutathione and the mitochondrial membrane potential. Hum Mol Genet. 2012;21:150–162. doi: 10.1093/hmg/ddr450. [DOI] [PubMed] [Google Scholar]
- Pallast S, Arai K, Wang X, Lo EH, van Leyen K. 12/15-Lipoxygenase targets neuronal mitochondria under oxidative stress. J Neurochem. 2009;111:882–889. doi: 10.1111/j.1471-4159.2009.06379.x. [DOI] [PMC free article] [PubMed] [Google Scholar]
- Pedersen PL. Warburg, me and hexokinase 2: multiple discoveries of key molecular events underlying one of cancers' most common phenotypes, the ‘Warburg effect’, i.e., elevated glycolysis in the presence of oxygen. J Bioenerg Biomembr. 2007;39:211–222. doi: 10.1007/s10863-007-9094-x. [DOI] [PubMed] [Google Scholar]
- Pesta D, Gnaiger E. High-resolution respirometry: OXPHOS protocols for human cells and permeabilized fibers from small biopsies of human muscle. Methods Mol Biol. 2012;810:25–58. doi: 10.1007/978-1-61779-382-0_3. [DOI] [PubMed] [Google Scholar]
- Rodriguez-Rodriguez P, Fernandez E, Almeida A, Os JPBN. Excitotoxic stimulus stabilizes PFKFB3 causing pentose-phosphate pathway to glycolysis switch and neurodegeneration. Cell Death Differ. 2012;19:1582–1589. doi: 10.1038/cdd.2012.33. [DOI] [PMC free article] [PubMed] [Google Scholar]
- Soucek T, Cumming R, Dargusch R, Maher P, Schubert D. The regulation of glucose metabolism by HIF-1 mediates a neuroprotective response to amyloid beta peptide. Neuron. 2003;39:43–56. doi: 10.1016/s0896-6273(03)00367-2. [DOI] [PubMed] [Google Scholar]
- Tan S, Sagara Y, Liu Y, Maher P, Schubert D. The regulation of reactive oxygen species production during programmed cell death. J Cell Biol. 1998;141:1423–1432. doi: 10.1083/jcb.141.6.1423. [DOI] [PMC free article] [PubMed] [Google Scholar]
- Vaughn AE, Deshmukh M. Glucose metabolism inhibits apoptosis in neurons and cancer cells by redox inactivation of cytochrome c. Nat Cell Biol. 2008;10:1477–1483. doi: 10.1038/ncb1807. [DOI] [PMC free article] [PubMed] [Google Scholar]
- Westermann B. Mitochondrial fusion and fission in cell life and death. Nat Rev Mol Cell Biol. 2010;11:872–884. doi: 10.1038/nrm3013. [DOI] [PubMed] [Google Scholar]
- Wu KC, Cui JY, Klaassen CD. Beneficial role of Nrf2 in regulating NADPH generation and consumption. Toxicol Sci. 2011;123:590–600. doi: 10.1093/toxsci/kfr183. [DOI] [PMC free article] [PubMed] [Google Scholar]