

Abstract
Background
Reliable blood-oxygen-level-dependent (BOLD) fMRI phenotypic biomarkers of Alzheimer's disease (AD) or mild cognitive impairment (MCI) are likely to emerge only from a systematic, quantitative, and aggregate examination of the functional neuroimaging research literature.
Methods
A series of random-effects, activation likelihood estimation (ALE) meta-analyses were conducted on studies of episodic memory encoding operations in AD and MCI samples relative to normal controls. ALE analyses were based upon a thorough literature search for all task-based functional neuroimaging studies in AD and MCI published up to January 2010. Analyses covered 16 fMRI studies, which yielded 144 distinct foci for ALE meta-analysis.
Results
ALE results indicated several regional task-based BOLD consistencies in MCI and AD patients relative to normal controls across the aggregate BOLD functional neuroimaging research literature. Patients with AD and those at significant risk (MCI) showed statistically significant consistent activation differences during episodic memory encoding in the medial temporal lobe (MTL), specifically parahippocampal gyrus, as well superior frontal gyrus, precuneus, and cuneus, relative to normal controls.
Conclusions
ALE consistencies broadly support the presence of frontal compensatory activity, MTL activity alteration, and posterior midline “default mode” hyperactivation during episodic memory encoding attempts in the diseased or prospective pre-disease condition. Taken together these robust commonalities may form the foundation for a task-based fMRI phenotype of memory encoding in AD.
Indexing Terms: Alzheimer's Disease, Mild Cognitive Impairment, fMRI, Episodic Memory, Activation Estimation Likelihood (ALE), Meta-analysis
Introduction
Associated with the discovery of the blood-oxygen-level-dependent (BOLD) magnetic resonance (MR) effect, the past two decades are witness to an explosion in research regarding the functional neuroanatomical correlates of normal memory function. Less abundant, however, are functional imaging studies examining memory dysfunction in populations of patients such as those with Alzheimer's disease dementia (hereafter referred to as AD) and those at higher risk for AD [e.g., mild cognitive impairment (MCI; [1, 2]). To date, a modest but growing number of AD-related functional magnetic resonance imaging (fMRI) studies have been conducted tapping episodic memory [3-19], semantic memory [20-22], implicit memory [6, 12], executive processes [5, 23, 24], and visuospatial abilities [25, 26]. Also, see Albert et al., 2003 [27]and Lee et al., 2003 [28] for reviews on the general use of fMRI in MCI. Nevertheless, gleaning a firm consensus within any particular cognitive domain above has proven difficult due to study-wise differences in imaging methodologies, task paradigms, and subject characteristics.
Critically, such study-wise differences have contributed to apparently contradictory results in the research literature. For example, possible MTL compensatory cortical activity during episodic encoding has been observed in some AD and MCI participant groups relative to controls [18], yet subsequent researchers have found decreased MTL activation in similar cortical regions [29]. This discrepancy speaks less to a fundamental problem in our understanding of the functional MRI (fMRI) correlates of AD and more to the variance in fMRI task methodologies and subject sample differences across studies. While these methodological variances are practically unavoidable due to the heterogeneity in study designs, there may be robust commonalities in task-related fMRI results that reveal spatially-relevant patterns of brain activation and deactivation. These commonalities may then be thought of as task-related phenotypic brain activity patterns. This notion of functional imaging-related phenotypes, while relatively new to the field of age-related disease research, has been described by researchers within such fields involving disorders of thought [30, 31], executive control [32-34], and neurodevelopment [35-37]. Establishing putative MCI- /AD-associated phenotypes via meta-analytic techniques, such as those employed here, may eventually allow for more targeted intermediate phenotype (endophenotype) detection, facilitating genetic discovery and streamlining clinical trial subject selection.
The goal of the current analysis was to determine if such phenotypes could be established by detectable and consistently robust fMRI patterns. To this end, we chose to focus upon a cognitive domain tapped by the majority of AD and MCI fMRI studies to date. Episodic memory encoding, a central function of the declarative memory system [38], represents the cognitive process involved when an individual is attending to a specific set of novel, event- or item-based information for memory consolidation and storage for subsequent retrieval or recognition. Individuals diagnosed with AD and, to a lesser extent, MCI, show notable changes in episodic memory abilities relative to cognitively normal peers (for a comprehensive review, see [39]). Deficits in episodic memory encoding and consolidation are thought to be the primary bases of memory impairment noted in AD and its associated incipient states [40-42]. The severity of deficits in encoding and consolidation tend to track closely with the burden of AD-related pathology in the MTL [43]. Thus the MTL has been fairly well characterized as the primary regional neuroanatomical correlate of episodic memory dysfunction in AD. What is less clear is if there are additional regions of dysfunction in AD and whether consistent spatial patterns of memory-related brain dysfunction across studies may provide a fMRI BOLD phenotype of AD.
To address these questions, we exhaustively researched the available literature for pertinent task-based, episodic memory fMRI studies and compared their patient versus normal control contrast differences using a set of activation likelihood estimation (ALE 2.0; [44]) analyses. ALE is a permutation-based, meta-analytic imaging approach for interrogating the likelihood of brain activation pattern overlap from a group of similar functional imaging study contrasts, and, with the advent of newer iterations of the ALE procedure [45], statistically significant regional ALE consistencies may be broadly generalized to populations of interest (i.e., random-effects data analysis). Any statistically significant spatial patterns to arise from our ALE meta-analyses are hypothesized to reflect aggregate empirical support for brain regions associated with episodic memory encoding attempts in MCI and AD patients relative to normal controls, thus providing an example of a consistent and robust phenotype of task-based BOLD activity in MCI and AD. In sum, the current analysis extends prior research by using a random-effects, coordinate-based, spatial activation estimation analysis (ALE), providing a rigorous, conservative empirical examination of common regions of fMRI/BOLD activation in MCI and AD patients relative to normal elder controls.
Methods
An initially broad and thorough literature search was conducted focusing on studies that employed functional neuroimaging in MCI and AD participant groups. The literature search was conducted on the Medline/PubMed databases using the following National Library of Medicine MesH term algorithm: [(Magnetic Resonance Imaging OR positron emission tomography) AND (Alzheimer Disease OR Amnesia OR Cognition Disorders) AND (Humans) AND (middle age OR aged OR (aged, 80 and over)]. This search was confined to articles published between 1980/01/01 and 2009/12/31, which yielded 2719 unique research or review manuscripts. From these research articles we examined and considered only those that had group-related task contrasts tapping aspects of declarative memory in AD and MCI patient samples relative to normal elderly participants, which significantly narrowed the original pool to 81 studies. Divided by imaging modality, 62 of these studies were conducted using fMRI, and the remaining 19 used positron emission tomography (PET) during performance of a cognitive task paradigm. For the current meta-analyses, only articles that reported fMRI contrasts of task components involving episodic memory encoding (i.e., face-name encoding, novel vs. familiar encoding, etc.) were considered for analysis – yielding a total of 38 studies published between 2003 - 2009. For entry into the planned ALE meta-analyses [44, 45], a procedure successfully implemented in several recent functional imaging reviews of episodic memory function [46-48], it was also necessary that studies referenced significant group-wise contrast results in a standardized neuroanatomical spatial coordinate system, either Talairach or MNI space. Ten studies from the pool of 38 were excluded due to lack of reported brain atlas coordinates. Studies were also excluded if subjects were healthy but only genetically at-risk for Alzheimer's disease (e.g., APOEε4) and did not evince cognitive symptoms (7 studies), or if the studies primarily involved pharmacological fMRI effects, without baseline comparisons of MCI or AD patients (5 studies). A final set of 16 studies remained with a publication date range from 2003 to 2009 (see Table 1).
Table 1.
Reported fMRI studies with episodic memory encoding group contrasts involving AD patients or MCI persons relative to elder controls.
| Functional Imaging Study | Participants | Functional Magnetic Resonance Imaging (fMRI) Task Paradigm | Encoding Contrast | Group Comparison | # of Foci | |||||
|---|---|---|---|---|---|---|---|---|---|---|
| AD | MCI | Controls | ||||||||
|
|
|
|
||||||||
| n | MMSE (s.d.) | n | MMSE (s.d.) | n | MMSE (s.d.) | |||||
| Celone et al. (2006) [3] | - | - | 15 | 29.3 (0.9) | 15 | 29.5 (0.5) | Face/name paired-associative learning task | Encoding component (ICA data) | MCI > Controls 1 | 4 |
|
| ||||||||||
| Golby et al. (2005) [6] | 7† | 20.8 (2.0) | - | - | 7 | 29.4 (0.5) | Novel versus repeated scenes task | Novel > Repeated Stimuli | AD < Controls | 7 |
|
| ||||||||||
| Gould et al. (2005) [7] | 12† | 26.3 (2.1) | - | - | 12 | 29.1 (0.9) | Visuospatial paired-associative learning for subsequent recognition task | Encoding > Baseline | AD > Controls | 6 |
| Encoding > Baseline | AD < Controls | 5 | ||||||||
| Remembered > Forgotten | AD > Controls | 2 | ||||||||
| Remembered > Forgotten | AD < Controls | 3 | ||||||||
|
| ||||||||||
| Hamalainen et al. (2007) [77] | 15† | 21.7 (3.7) | 14 | 25.6 (3.1) | 21 | 27.7 (2.0) | Visual object encoding for subsequent recognition task | Encoding > Baseline | MCI < Controls | 1 |
| Encoding > Baseline | MCI > Controls | 13 | ||||||||
| Encoding > Baseline | AD < Controls | 5 | ||||||||
| Encoding > Baseline | AD > Controls | 2 | ||||||||
|
| ||||||||||
| Johnson et al. (2006) [10] | - | - | 14† | 28.6 (1.5) | 14 | 29.4 (0.8) | Novel versus familiar line-drawings task | Novel > Repeated Stimuli | MCI < Controls | 4 |
|
| ||||||||||
| Johnson et al. (2007) [9] | - | - | 9 | 26.2 (3.1) | 12 | 29.5 (1.0) | Spatial location encoding / learning task | Encoding > Baseline | MCI < Controls | 1 |
|
| ||||||||||
| Kircher et al. (2007) [11] | - | - | 21 | 26.6 (1.4) | 29 | 28.8 (1.2) | Visual encoding of printed words for subsequent recognition task | Remembered > Forgotten | MCI > controls | 4 |
|
| ||||||||||
| Machulda et al. (2009) [78] | - | - | 19 | - | 29 | - | Visual Scene encoding for subsequent recognition task | Encoding > Baseline | MCI < Controls | 7 |
|
| ||||||||||
| Pariente et al. (2005) [13] | 12 | 25.1 (1.8) | - | - | 17 | 29.0 (1.0) | Face/name paired-associative learning for subsequent recognition task | Remembered > Forgotten | AD < Controls | 2 |
| Remembered > Forgotten | AD > Controls | 4 | ||||||||
|
| ||||||||||
| Peters et al. (2009) [79] | 16† | 23.4 (1.7) | - | - | 16 | - | Auditory encoding of words for subsequent recognition task | Encoding > Baseline | AD < Controls | 5 |
|
| ||||||||||
| Petrella et al. (2006) [14] | - | - | 20 | 26.7 (1.5) | 20 | 28.4 (1.4) | Face/name paired-associative learning task | Novel > Repeated Stimuli | MCI < Controls | 5 |
|
| ||||||||||
| Petrella et al. (2007) [70] | 13 | 24.6 (2.4) | - | - | 28 | 28.2 (1.4) | Face/name paired-associative learning task | Novel > Repeated Stimuli | AD < Controls | 8 |
| AD > Controls | 10 | |||||||||
|
| ||||||||||
| Remy et al. (2005) [16] | 8t | 21.2 (6.4) | - | - | 11 | 29.4 (0.5) | Visual encoding of printed words for subsequent recognition task | Encoding > Baseline | AD < Controls | 12 |
| Encoding > Baseline | AD > Controls | 3 | ||||||||
|
| ||||||||||
| Sperling et al. (2003) | 7 | 22.6 (2.2) | - | - | 10 | - | Face/name paired-associative learning task | Encoding > Baseline | AD < Controls | 4 |
| Novel > Repeated Stimuli | AD < Controls | 1 | ||||||||
| Encoding > Baseline | AD > Controls | 6 | ||||||||
| Novel > Repeated Stimuli | AD > Controls | 9 | ||||||||
|
| ||||||||||
| Trivedi et al. (2008) [19] | - | - | 16 | 26.3 (2.3) | 23 | 28.8 (1.2) | Visual object encoding for subsequent recognition task | Encoding > Baseline | MCI < Controls | 6 |
| Remembered > Forgotten | MCI < Controls | 2 | ||||||||
| Remembered > Forgotten | MCI > Controls | 1 | ||||||||
MCI-subtype characterized by low clinical dementia rating (CDR) sum of boxes (SB) score (e.g., CDR-SB 1.1 ± 0.4).
portion of participants noted as being on acetylcholinesterase inhibitors at the time of neuroimaging.
One hundred and forty-four distinct spatial foci from 30 different group-wise episodic memory encoding contrasts served as the primary data for the planned series of ALE metaanalyses [44]. Four separate ALE analyses were conducted to interrogate the directionality of episodic memory encoding activity differences in MCI and AD patients relative to controls. AD-related ALE analyses examined contrast foci associated with greater encoding-related activation in AD patients relative to elder controls (8 contrasts, 42 foci) and reduced activation in AD patients relative to controls (10 contrasts, 52 foci); while MCI analyses examined contrast foci associated with greater activation in MCI participants relative to elder controls (4 contrasts, 22 foci) and less activation in MCI than controls (8 contrasts, 28 foci). Group comparisons and task paradigms with corresponding foci are presented in Table 1.
Task paradigms with episodic memory encoding components of varied somewhat across the included studies. Of the 16 studies analyzed, eight different types of paradigms were represented (N.B., the “fMRI Task Paradigm” column in Table 1 denotes the task type used to obtain group-wise comparison of episodic memory encoding activity). One particularly prevalent paradigm among the studies identified is a face/name paired-associative learning task adapted from Sperling et al. [49]. In this task, participants are shown blocks of stimuli in which a novel or familiar face is paired with a name. In a later run, participants are again shown the stimuli and asked whether the correct name is matched with the correct face. In some of the studies participants were asked to give an initial subjective determination of whether the name “fit” the face. Other studies (Table 1, nos. 4 and 12) did not use a name component but simply presented unfamiliar faces and asked participants to encode them for later recall during a subsequent recognition task [8, 17]. Other variants of discrimination between novel and repeated stimuli were represented in the selected studies. Golby and colleagues asked participants to remember whether or not they had previously viewed a particular visual scene [6], while Kircher et al. used verbal rather than visual stimuli and instructed participants to encode words that would be recalled in a subsequent memory test [11].
In addition to task variation, the studies included in the current ALE analyses differed in their classification methods for MCI or AD. All AD patients from the included studies were classified as having probable AD of mild to mild-to-moderate severity based on NINCDS-ADRDA diagnostic criteria [50]. Most studies relied upon Clinical Dementia Rating scale (CDR; [51] or the Mini-mental Status Exam (MMSE; [52]) scores as the primary measures of functional and cognitive decline, respectively. Although these measures were not the sole criterion for diagnostic classification, they provide a general indication of the extent of cognitive impairment among the participants in the included studies. AD patients in the included studies had mean MMSE scores ranging from 20.8 to 26.33, while the range of mean MMSE scores among the MCI participants was characteristically higher (i.e., 25.3 to 28.4; see Table 1). CDR totals were consistent with suggested guidelines for functional impairments suggestive of AD or MCI (i.e., AD ≥ 1, MCI = 0.5). In addition to the MMSE and CDR, MCI participants from the included studies were further classified based on cognitive assessments, the results of which suggested comparative mild weaknesses in memory performance and possibly another cognitive domain in line with established MCI classification criteria [53].
To allow for direct comparison of brain spatial coordinates across studies, transformations were required to bring all contrast foci to a common atlas space. Spatial coordinates reported by the included studies in Montreal Neurological Institute (MNI) space were transformed to Talairach atlas space [54] using the Lancaster “icbm2tal” transform [55]. Specialized versions of the Lancaster transform were used to account for spatial transformation differences among the various imaging analysis platforms (e.g. icbm_spm2tal). Coordinates that had already undergone the Brett transform [56] from MNI to Talairach space before publication were treated differently. Brett transform Talairach foci coordinates were converted back to MNI atlas space using a reverse transform algorithm, after which these coordinates were then returned to Talairach space using the aforementioned Lancaster transform [55]. After all study coordinates were transformed similarly to common Talairach space, the four ALE meta-analyses were performed [44].
Activation likelihood estimate (ALE) analyses were conducted for each directional contrast (AD/MCI > control and AD/MCI < control) by modeling each reported study foci as a three-dimensional Gaussian function smoothed with a 12 millimeter (mm) full width half maximum (FWHM) kernel [57] to allow enough spatial overlap among foci for statistical comparison. Statistical significance was evaluated using the standard ALE permutation procedure with a minimum of 5000 permutations per solution. ALE analyses were corrected for multiple comparisons using a false discovery rate procedure (FDR; [44, 58] and thresholded for cluster size to conservatively control for Type I error. To exceed established analysis thresholds, ALE analysis clusters were required to be statistically significant at FDR q < .05 with a minimum volume of 100 mm3, and to be considered “phenotypic,” ALE analysis clusters were required to have contributing spatial coordinates from a minimum of at least two independent studies from Table 1. The resulting ALE coordinates for clusters surviving these analysis thresholds were then reconverted back to MNI atlas space using the Lancaster transform [55]. Additionally, for visualization purposes the resulting ALE image maps were warped from Talairach atlas space to MNI space (see Figure 1 & Supplemental Figures) using SPM8 (Wellcome Institute, UK) non-linear warp transformation.
Figure 1.
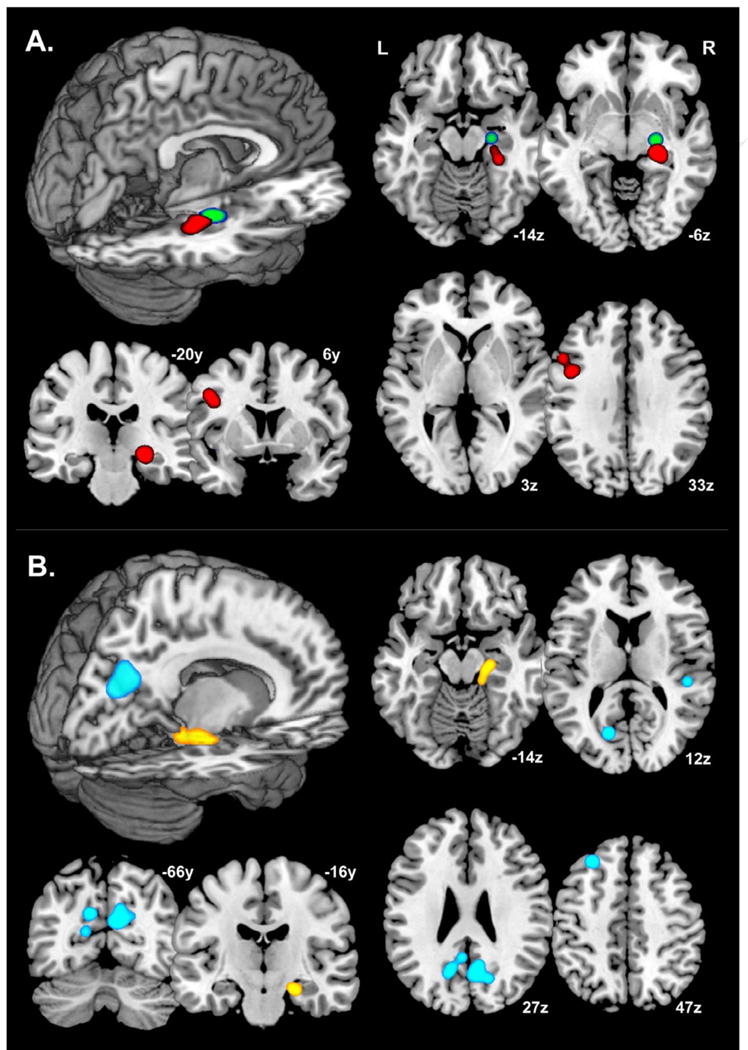
Common, regional blood-oxygen-level-dependent (BOLD) activation differences during episodic memory encoding in MCI or AD persons relative to normal elder controls.
Note: A.) MCI relative to normal controls. ALE meta-analysis of 12 experimental contrasts (50 foci) with a statistical significance threshold of FDR q < .05, kextent ≥ 100 mm3, and requirement of contributing coordinates from at minimum of two independent studies from Table 1. Red foci = MCI < Control; Green foci = MCI > Control.
B.) AD relative to normal controls. ALE meta-analysis of 18 experimental contrasts (94 foci) with a statistical significance threshold of FDR q < .05, kextent ≥ 100 mm3, and requirement of contributing coordinates from at least two independent studies from Table 1. Yellow foci = AD < Control; Blue foci = AD > Control.
Neurological representation slices in-plane with statistically-significant ALE foci, visualized on a single-subject, ICBM Montreal Neurological Institute atlas space brain (MNI; [81]).
Results
Peak MNI coordinates, Brodmann areas, and cluster sizes for significant ALE regional commonalities are summarized in Table 2. The ALE values noted in Table 2 are the maximum activation likelihood estimates for individual statistically significant clusters. All ALE values are significant based on a False Discovery Rate (FDR) of q < .05; k ≥ 100mm3.
Table 2.
ALE meta-analysis results for reported episodic memory encoding contrasts between MCI and AD persons and normal elderly controls.
| ALE Group Contrasts | Location (Brodmann Area)a | Local Extrema b | Cluster Volume (mm3) | ALE value ( × 10-3) | |||
|---|---|---|---|---|---|---|---|
|
| |||||||
| x | y | z | |||||
| MCI > Controls | Right Hemisphere | Anterior Parahippocampal Gyrus (∼BA 35) | 25 | -15 | -14 | 456 | 2.12 |
|
|
|||||||
| MCI < Controls | Right Hemisphere | Anterior Parahippocampal Gyrus (∼BA 28) | 27 | -27 | -11 | 1040 | 2.13 |
| Left Hemisphere | Inferior Frontal Gyrus (BA 9) | -46 | 11 | 31 | 296 | 1.34 | |
|
| |||||||
| AD > Controls | Right Hemisphere | Precuneus (BA 31) | 10 | -66 | 29 | 1720 | 1.15 |
| Superior Temporal Gyrus (BA 41) | 53 | -30 | 4 | 328 | 1.49 | ||
| Left Hemisphere | Cuneus (BA 18) | -16 | -72 | 18 | 440 | 1.93 | |
| Superior Frontal Gyrus (BA 6/8) | -24 | 40 | 43 | 424 | 1.81 | ||
| Precuneus (BA 31) | -11 | -64 | 33 | 392 | 1.62 | ||
|
|
|||||||
| AD < Controls | Right Hemisphere | Cerebellum, Anterior Lobe | 5 | -48 | -31 | 392 | 1.70 |
| Anterior Parahippocampal Gyrus (∼BA 28) | 18 | -17 | -23 | 360 | 1.39 | ||
| Lingual Gyrus (BA 19) | 32 | -75 | 2 | 152 | 1.17 | ||
Note: ALE analyses of MCI relative to normal controls [12 experimental contrasts (50 foci)] and AD relative to normal controls [18 experimental contrasts (95 foci)] with statistical significance threshold of FDR q < .05, kextent ≥ 100 mm3, and requirement of contributing coordinates from at least two independent studies from Table 1.
Brodmann Area assignments based upon 3mm search radius of the Talairach Daemon database [80] using MNI-to-Talairach transformed (Lancaster transform; [55]) cluster local extrema coordinates.
Cluster local extrema coordinates provided in Montreal Neurological Institute (MNI; [81]) atlas space.
Thresholded ALE spatial maps for regions of common difference between AD or MCI patients and controls during episodic memory encoding are presented in Fig. 1. Brain regions where encoding-related activation tends to be greater in MCI individuals relative to elder controls are shown in red, while regions where relative activation was greater in controls than in MCI patients are denoted in green (Figure 1, Section A). A single common cluster in the right anterior parahippocampal gyrus (∼BA 35 region; 25x,-15y,-14z) survived ALE analysis of study contrasts where activity was greater in MCI relative to control participants. Conversely, two regions survived ALE statistical thresholding where activity was less in MCI patients relative to controls. One such focus was in the right anterior parahippocampal gyrus, similar to the MCI > control ALE results, though more posterior along the hippocampal axis (∼BA 28 region; 27x,-27y,-11z), and the other focus in the left inferior frontal gyrus region (BA 9; -46x,11y,31z).
Significant common spatial foci for task-based, episodic memory BOLD activation/deactivation in AD patients relative to controls are shown in Figure 1, Section B. Blue regions indicate areas of greater activation in AD patients, while yellow foci indicate greater activation in controls. Robust ALE regions in AD patients relative to controls were in the bilateral posterior midline [i.e., right precuneus (BA 31; 10x,-66y,29z), left precuneus (BA 31; -11x,-64y,33z), and left cuneus (BA 18; -16x,-72y,18z)], right superior temporal gyrus (BA 41; 53x,-30y,4z) and left superior frontal gyrus (BA 6/8; -24x,40y,43z). Control relative to AD regions lied in the anterior cerebellum (5x,-48y,-31z), right anterior parahippocampal gyrus (∼BA 28; 18x,-17y,-23z), and right lingual gyrus (BA 19; 32x,-75y,2z).
Other smaller ALE analysis clusters are revealed when analyses are run with less conservative statistical and extent thresholds, but the regional commonalities reported above reflect the most robust findings across studies lending support to common phenotypic fMRI activation pattern associated with AD (and to a lesser extent, MCI). Therefore, the reported results reflect conservative estimates of commonly observed phenotypic differences in the functional neuroanatomical substrates governing episodic encoding between MCI or AD subjects and normal elder controls. Broadly, MCI and AD subjects both show a marked decrease in BOLD activation during episodic memory encoding in the right anterior parahippocampal region (∼BA 28), while encoding-related BOLD patterns differentiate between patient and controls in terms of the relative activation of other MTL structures, dorsolateral prefrontal cortex and posterior midline regions during episodic memory encoding.
Supplemental figures 2, 3, 4, and 5 illustrate the spatial positions of foci maxima for the various episodic memory-related task contrasts that contributed to the composite ALE findings given in figure 1 (Sections A & B). Figure 2 shows the spatial locations of increased BOLD activity contrast maxima for elder controls relative to MCI patients. Red coordinates indicate areas where encoding certain stimuli (objects, scenes, spatial locations, or faces) elicited a significant increase in BOLD activity from baseline, while blue foci indicate increased activation for novel versus repeated stimuli and green foci show areas of increased activation for successful memory encoding in normal patients relative to MCI. Conversely, supplemental figure 3 reveals the spatial locations for increased activation in MCI patients versus normal controls during simple encoding greater than baseline contrasts (red) and remembered versus forgotten (i.e. successful memory encoding) task paradigms (green). Supplemental figures 4 and 5 illustrate similar contrast differences by episodic memory task type between AD patients and normal controls.
Discussion
Numerous functional imaging investigations examining the neural substrates underlying AD-related memory decline have yielded a substantial body of literature on the subject; however, the diversity across experimental paradigms has made it difficult to draw consistent inferences from these findings [27, 28]. By amassing results of studies focused on a single component of memory (episodic encoding) and performing a series of ALE meta-analyses on the available fMRI data, it is possible to spatially illustrate statistically significant concordant findings. The results of these aggregate analyses highlight consistent functional neuroanatomical regions important to episodic memory dysfunction in individuals with AD and those at significant risk (MCI). They also model an empiric approach capable of consolidating the results of multiple studies across a variety of institutions, scanner types and patient samples.
The anterior parahippocampal gyrus, at approximately the BA 28 region (entorhinal cortex), demonstrated consistently decreased activation in both AD and MCI patients versus control subjects across the studies used in the current ALE analyses. Such results are in-line with volumetric studies documenting decreased entorhinal volume in MCI and AD. For example, Du and colleagues [59] reported that entorhinal cortex and hippocampal volumes were significantly reduced in MCI (entorhinal cortex 13%, hippocampus 11%) and AD (entorhinal cortex 39%, hippocampus 27%) compared with NC. Furthermore, AD showed greater volume losses in the entorhinal cortex than in the hippocampus. Taken together, these findings suggest that volumetric and functional reductions in anterior parahippocampal cortex (∼BA28) play an important role in the episodic encoding impairments observed in MCI and AD. Of note, none of the studies considered accounted for the possible effects of atrophy on activation in the medial temporal lobe [60, 61], and therefore it is not possible to disentangle these two effects on the basis of our results.
Another region along the anterior parahippocampal gryus, approximately in BA 35 (perirhinal cortex), demonstrated greater activity in MCI than control individuals. Although there have been extensive discussions about the role of the perirhinal cortex in episodic memory (see [62]for recent review), one prominent view is that perirhinal activity is associated with processing episodic familiarity signals [63]. Studies in healthy young individuals have documented enhanced perirhinal activity during encoding [64] and retrieval [65] of “unitized” information (e.g., a background color of a studied word or features of a face), leading to the proposal that perirhinal cortex may encode feature-fused item representations that can support later source judgments on the basis of stimulus familiarity [64, 66, 67]. However, over reliance on stimulus familiarity during encoding can lead to high levels of memory errors, and under such conditions, significantly greater activity during false than during accurate retrieval has been reported in the perirhinal cortex in older adults [68]. Such findings suggest that the anterior parahippocampal activity (at approximately BA35) observed in the current analysis may reflect an increase or over reliance on familiarity-based processing during episodic encoding in MCI, not necessarily beneficial to successful memory.
Another strong ALE finding was apparent in the comparison of study contrasts involving greater activity in AD patients relative to controls. Precuneus and cuneus activation is particularly robust across contrasts of this type, and are regions known to be part of a “default network” associated with intrinsic baseline activity in the brain, and physiologically normal deactivation during a wide variety of tasks, including memory encoding [69]. The consistent observation of greater activation in these regions in AD patients compared to controls reinforces an aberration in the ability to effectively redistribute cognitive resources during memory tasks, perhaps indicating a functional breakdown in precuneus/cuneus connectivity in AD/MCI patients. A distinct pattern of abnormally high activity in the default network has been consistently found in AD and MCI patients when compared to healthy controls [70]. In fact, this finding is often consistent enough as to be able to discriminate AD patients from healthy controls based on default network activation with a sensitivity of 85% [71]. Thus our findings support a similarly strong phenotypic dysfunction of cuneus/precuneus BOLD activation during memory task performance in AD patients, which is consistent with recent findings that strong posterior midline activation during memory task performance is a negative predictor of memory encoding success [72].
Increased activation in left superior frontal gyrus for both MCI or AD versus normal controls, an area known to be important in memory encoding and retrieval, suggests that both patient types tend to engage in their respective memory tasks. Prefrontal lobe activation is observed in AD patient relative to controls, but the activation locus tends to be smaller and more superior to the MCI aggregate ALE result locus. This general reduction in prefrontal lobe activation for AD versus control studies may suggest some variably in task attention between AD versus control studies.
Our analyses also reveal a robust increase in pre-frontal activity during encoding tasks for both AD and MCI patients versus controls. This finding points to the PFC as a possible compensatory mechanism for patients with lower than normal activity in traditional memory networks (i.e. entorhinal cortex). For example, a shift from medial temporal- to frontal-based processing has been documented previously in healthy older adults during episodic encoding [73] and episodic retrieval [74]. In those studies, significant correlations were obtained between decreased medial temporal lobe activity and increased prefrontal activity during accurate performance, and the results interpreted to reflect compensatory processes whereby prefrontal regions are recruited to counteract neurocognitive decline in the context of deficient medial temporal lobe memory system function. The current findings indicate that a similar shift from medial temporal lobe to prefrontal regions occurs in populations with frank episodic encoding impairments.
Schwindt and Black [47] conducted a similar quantitative ALE meta-analysis of fMRI studies involving episodic memory dysfunction. In alignment with our results, they confirmed a decrease in MTL activity during episodic memory tasks in AD patients. Their general results for areas of increased activity in AD patients matched our results as well, including activation in the pre-frontal cortex, parietal lobe, cuneus, and superior temporal gyrus. However, there are several factors that differentiate our results. For example, their study focused on results from AD patients only, excluding findings from subjects with milder forms of cognitive impairment likely reflecting prodromal Alzheimer's disease. In contrast, the present study provides a basis for examining the regional consistency of task-related BOLD activity along a spectrum of cognitive disorder from normal controls to MCI to AD. Additionally, our analysis included only those studies that reported data for both cognitively impaired patients and healthy controls, allowing us to isolate patterns of common difference and reducing the heterogeneity of these patterns. Conversely, Schwindt and Black included some studies with data of AD patients only (without a control comparison). Their study also included PET data in the meta-analysis. However, since there tends to be variability between fMRI and PET results, we elected not to include PET studies to elucidate more refined activity patterns specific to task-related BOLD. Additionally, in contrast to the Schwindt and Black analyses, we opted not to include fMRI BOLD studies in our analyses that primarily involved pharmacological interventions for AD. A few of the studies included in our analyses noted pharmacological treatment of AD patients, which are noted in Table 2, but these treatments were not the focus of the included studies and were limited to standard acetylcholinesterase inhibition approaches. Methodologically, an important distinguishing factor of the present study is its implementation of the ALE meta-analysis technique amenable to random-effects inference of the results. Previous ALE analyses (including the one conducted by Schwindt and Black) used a fixed-effects ALE analysis that tested for above-chance clustering between foci. However, the current results assessed for random-effects clustering between experiments; thus our results may be more generalized to the population of task-based BOLD studies of MCI and AD.
To be considered “phenotypic,” ALE analysis clusters were required to have contributing spatial coordinates from a minimum of at least two independent studies from Table 1. However, significant regions actually reflect a much greater contribution from multiple independent studies. For example, in the comparison of activity greater for AD participants than for controls participants, contributing spatial coordinates from right precuneus (BA 31) were observed in four of the studies (i.e., Gould, et al., 2005 [7]; Pariente et al., 2005 [13]; Petrella, et al., 2007 [70]; and Sperling, et al., 2003 [18]), reflecting the same observation from independent research groups and distinct patient samples. Similarly, the reduced activity during episodic memory encoding in the right anterior parahippocampal gyrus of MCI participants relative to controls (∼BA 28) was also detected in four independent studies [8-10, 19]. It should be noted, however, that the notion of task-based fMRI phenotypes for episodic memory encoding applies only to each patient group separately. The relationship between MCI, dementia, and AD has yet to be fully elucidated, and often, depending upon the diagnostic criteria selected, MCI may or may not reflect incipient AD. Therefore any significant ALE regions from the analyses represents contrasts between AD or MCI patients and elder controls, not a direct contrast between AD and MCI patients. A potential source of bias in our ALE results is the use of varied paradigms to investigate episodic encoding. A majority of the studies included for analyses used visual memory paradigms, which likely accounts for the greater emphasis of right hemispheric common differences; particularly those noted in the MTL region. The face-name associative encoding task developed by Sperling et al. [49] was particularly well represented, while remaining studies tended to use verbal encoding tasks involving recall of word lists. Although we grouped visual and verbal studies together in the ALE analysis, the results are heavily weighted towards visual episodic encoding (hence the consistent right MTL activation foci in both patient groups).
Our analysis of the episodic encoding component of memory using ALE gives us an interesting new perspective on possible MCI and AD task-based BOLD phenotypes. More specifically, our analysis suggests a robust imaging phenotype in Alzheimer's dementia and MCI confined to the MTL, specifically the parahippocampal gyrus, as well superior frontal gyrus, precuneus, and cuneus. The locality of these consistent task-based fMRI signatures appears to support current research about the effect of AD pathogenesis on functional network connectivity. For example, Sperling and her colleagues postulate that the initial hyperactivity observed in the MTL during episodic encoding in MCI may be secondary to this region becoming progressively more functionally “disconnected” from the rest of the papez circuit and PCG region [75]. This general pattern of episodic memory functional network disruption appears to fit with the current ALE analyses results - when MTL functioning begins to fail secondary to AD neuropathological changes, patients may rely more upon self-referential information search (i.e., PCG activity) during memory encoding and retrieval attempts [76]. Consistent findings of coincident PFC activity in AD patients during memory task performance indicates that the PCG activity is not likely to just be a byproduct of their not trying during the task.
More research is needed particularly in early prodromal AD to better understand the extent to which the current findings in MCI reflect early Alzheimer's disease traits, but the consistent robustness of ALE activation commonalities in the MTL and PCG certainly highlights these regions as being central to any future functional neuroimaging studies of AD pathogenesis.
Supplementary Material
Figure 2 (Supplemental). Spatial locations reflecting reported normal control > mild cognitive impairment blood-oxygen-level-dependent (BOLD) activity contrast maxima associated with episodic memory encoding processes.
Note: Locations reflect aggregate MNI [81] spatial coordinate maxima for episodic memory encoding contrasts: Red = encoding > baseline condition; Blue = novel > repeated stimuli condition; and Green = remembered > forgotten stimuli (i.e., encoding success). Axial slices pictured every 5mm (-20z to 65z).
Figure 3 (Supplemental). Spatial locations reflecting reported normal control < mild cognitive impairment blood-oxygen-level-dependent (BOLD) activity contrast maxima associated with episodic memory encoding processes.
Note: Locations reflect aggregate MNI [81] spatial coordinate maxima for episodic memory encoding contrasts: Red = encoding > baseline condition; Blue = novel > repeated stimuli condition; and Green = remembered > forgotten stimuli (i.e., encoding success). Axial slices pictured every 5mm (-20z to 65z).
Figure 4 (Supplemental). Spatial locations reflecting reported normal control > Alzheimer's disease blood-oxygen-level-dependent (BOLD) activity contrast maxima associated with episodic memory encoding processes.
Note: Locations reflect aggregate MNI [81] spatial coordinate maxima for episodic memory encoding contrasts: Red = encoding > baseline condition; Blue = novel > repeated stimuli condition; and Green = remembered > forgotten stimuli (i.e., encoding success). Axial slices pictured every 5mm (-20z to 65z).
Figure 5 (Supplemental). Spatial locations reflecting reported normal control < Alzheimer's disease blood-oxygen-level-dependent (BOLD) activity contrast maxima associated with episodic memory encoding processes.
Note: Locations reflect aggregate MNI [81] spatial coordinate maxima for episodic memory encoding contrasts: Red = encoding > baseline condition; Blue = novel > repeated stimuli condition; and Green = remembered > forgotten stimuli (i.e., encoding success). Axial slices pictured every 5mm (-20z to 65z).
Acknowledgments
The authors wish to thank Steven Prince, Nina Borges, Katherine Rief, Colby Keistler for their assistance in literature search, ALE analyses, and document retrieval and edits. The first author would also like to thank Drs. David Brizel, Frank Dunphy, Ramon Esclamado, and Richard Scher for providing their expertise and care, which made this author's work existentially possible. This research was supported, in part, by NIH/NIA grants P30-AG028377 (KWB), R01-AG019728 (JP), and L30-AG029001 (JB).
Footnotes
Disclosure: The authors report no conflicts of interest.
Publisher's Disclaimer: This is a PDF file of an unedited manuscript that has been accepted for publication. As a service to our customers we are providing this early version of the manuscript. The manuscript will undergo copyediting, typesetting, and review of the resulting proof before it is published in its final citable form. Please note that during the production process errors may be discovered which could affect the content, and all legal disclaimers that apply to the journal pertain.
References
- 1.Morris JC. Mild cognitive impairment and preclinical Alzheimer's disease. Geriatrics. 2005;Suppl:9–14. [PubMed] [Google Scholar]
- 2.Petersen RC, Negash S. Mild cognitive impairment: an overview. CNS Spectr. 2008;13(1):45–53. doi: 10.1017/s1092852900016151. [DOI] [PubMed] [Google Scholar]
- 3.Celone KA, et al. Alterations in memory networks in mild cognitive impairment and Alzheimer's disease: an independent component analysis. J Neurosci. 2006;26(40):10222–31. doi: 10.1523/JNEUROSCI.2250-06.2006. [DOI] [PMC free article] [PubMed] [Google Scholar]
- 4.Drzezga A. Concept of functional imaging of memory decline in Alzheimer's disease. Methods. 2008;44(4):304–14. doi: 10.1016/j.ymeth.2007.02.002. [DOI] [PubMed] [Google Scholar]
- 5.Elgh E, et al. Altered prefrontal brain activity in persons at risk for Alzheimer's disease: an fMRI study. Int Psychogeriatr. 2003;15(2):121–33. doi: 10.1017/s1041610203008810. [DOI] [PubMed] [Google Scholar]
- 6.Golby A, et al. Memory encoding in Alzheimer's disease: an fMRI study of explicit and implicit memory. Brain. 2005;128(Pt 4):773–87. doi: 10.1093/brain/awh400. [DOI] [PubMed] [Google Scholar]
- 7.Gould RL, et al. Functional neuroanatomy of successful paired associate learning in Alzheimer's disease. Am J Psychiatry. 2005;162(11):2049–60. doi: 10.1176/appi.ajp.162.11.2049. [DOI] [PubMed] [Google Scholar]
- 8.Johnson SC, et al. Hippocampal adaptation to face repetition in healthy elderly and mild cognitive impairment. Neuropsychologia. 2004;42(7):980–9. doi: 10.1016/j.neuropsychologia.2003.11.015. [DOI] [PubMed] [Google Scholar]
- 9.Johnson SC, et al. Associative Learning Over Trials Activates the Hippocampus in Healthy Elderly but not Mild Cognitive Impairment. Neuropsychol Dev Cogn B Aging Neuropsychol Cogn. 2007:1–17. doi: 10.1080/13825580601139444. [DOI] [PMC free article] [PubMed] [Google Scholar]
- 10.Johnson SC, et al. Activation of brain regions vulnerable to Alzheimer's disease: the effect of mild cognitive impairment. Neurobiol Aging. 2006;27(11):1604–12. doi: 10.1016/j.neurobiolaging.2005.09.017. [DOI] [PMC free article] [PubMed] [Google Scholar]
- 11.Kircher TT, et al. Hippocampal activation in patients with mild cognitive impairment is necessary for successful memory encoding. J Neurol Neurosurg Psychiatry. 2007;78(8):812–8. doi: 10.1136/jnnp.2006.104877. [DOI] [PMC free article] [PubMed] [Google Scholar]
- 12.Koenig P, et al. Medial temporal lobe involvement in an implicit memory task: evidence of collaborating implicit and explicit memory systems from FMRI and Alzheimer's disease. Cereb Cortex. 2008;18(12):2831–43. doi: 10.1093/cercor/bhn043. [DOI] [PMC free article] [PubMed] [Google Scholar]
- 13.Pariente J, et al. Alzheimer's patients engage an alternative network during a memory task. Ann Neurol. 2005;58(6):870–9. doi: 10.1002/ana.20653. [DOI] [PubMed] [Google Scholar]
- 14.Petrella JR, et al. Mild cognitive impairment: evaluation with 4-T functional MR imaging. Radiology. 2006;240(1):177–86. doi: 10.1148/radiol.2401050739. [DOI] [PubMed] [Google Scholar]
- 15.Pihlajamaki M, et al. Impaired medial temporal repetition suppression is related to failure of parietal deactivation in Alzheimer disease. Am J Geriatr Psychiatry. 2008;16(4):283–92. doi: 10.1097/JGP.0b013e318162a0a9. [DOI] [PMC free article] [PubMed] [Google Scholar]
- 16.Remy F, et al. Verbal episodic memory impairment in Alzheimer's disease: a combined structural and functional MRI study. Neuroimage. 2005;25(1):253–66. doi: 10.1016/j.neuroimage.2004.10.045. [DOI] [PubMed] [Google Scholar]
- 17.Rombouts SA, et al. Altered resting state networks in mild cognitive impairment and mild Alzheimer's disease: an fMRI study. Hum Brain Mapp. 2005;26(4):231–9. doi: 10.1002/hbm.20160. [DOI] [PMC free article] [PubMed] [Google Scholar]
- 18.Sperling RA, et al. fMRI studies of associative encoding in young and elderly controls and mild Alzheimer's disease. J Neurol Neurosurg Psychiatry. 2003;74(1):44–50. doi: 10.1136/jnnp.74.1.44. [DOI] [PMC free article] [PubMed] [Google Scholar]
- 19.Trivedi MA, et al. fMRI activation changes during successful episodic memory encoding and recognition in amnestic mild cognitive impairment relative to cognitively healthy older adults. Dement Geriatr Cogn Disord. 2008;26(2):123–37. doi: 10.1159/000148190. [DOI] [PMC free article] [PubMed] [Google Scholar]
- 20.Grossman M, et al. Neural basis for semantic memory difficulty in Alzheimer's disease: an fMRI study. Brain. 2003;126(Pt 2):292–311. doi: 10.1093/brain/awg027. [DOI] [PubMed] [Google Scholar]
- 21.Saykin AJ, et al. Neuroanatomic substrates of semantic memory impairment in Alzheimer's disease: patterns of functional MRI activation. J Int Neuropsychol Soc. 1999;5(5):377–92. doi: 10.1017/s135561779955501x. [DOI] [PMC free article] [PubMed] [Google Scholar]
- 22.Woodard JL, et al. Semantic memory activation in amnestic mild cognitive impairment. Brain. 2009;132(Pt 8):2068–78. doi: 10.1093/brain/awp157. [DOI] [PMC free article] [PubMed] [Google Scholar]
- 23.Lim HK, et al. Altered verbal working memory process in patients with Alzheimer's disease: an fMRI investigation. Neuropsychobiology. 2008;57(4):181–7. doi: 10.1159/000147471. [DOI] [PubMed] [Google Scholar]
- 24.Yetkin FZ, et al. FMRI of working memory in patients with mild cognitive impairment and probable Alzheimer's disease. Eur Radiol. 2006;16(1):193–206. doi: 10.1007/s00330-005-2794-x. [DOI] [PubMed] [Google Scholar]
- 25.Prvulovic D, et al. Functional imaging of visuospatial processing in Alzheimer's disease. Neuroimage. 2002;17(3):1403–14. doi: 10.1006/nimg.2002.1271. [DOI] [PubMed] [Google Scholar]
- 26.Thiyagesh SN, et al. The neural basis of visuospatial perception in Alzheimer's disease and healthy elderly comparison subjects: an fMRI study. Psychiatry Res. 2009;172(2):109–16. doi: 10.1016/j.pscychresns.2008.11.002. [DOI] [PubMed] [Google Scholar]
- 27.Albert MS. Detection of very early Alzheimer disease through neuroimaging. Alzheimer Dis Assoc Disord. 2003;17(Suppl 2):S63–5. doi: 10.1097/00002093-200304002-00010. [DOI] [PubMed] [Google Scholar]
- 28.Lee BC, et al. Imaging of Alzheimer's disease. J Neuroimaging. 2003;13(3):199–214. [PubMed] [Google Scholar]
- 29.Prince SE, et al. Functional MRI in the early diagnosis of Alzheimer's disease: is it time to refocus? Expert Rev Neurother. 2008;8(2):169–75. doi: 10.1586/14737175.8.2.169. [DOI] [PubMed] [Google Scholar]
- 30.Callicott JH, et al. Abnormal fMRI response of the dorsolateral prefrontal cortex in cognitively intact siblings of patients with schizophrenia. Am J Psychiatry. 2003;160(4):709–19. doi: 10.1176/appi.ajp.160.4.709. [DOI] [PubMed] [Google Scholar]
- 31.Callicott JH, Weinberger DR. Brain imaging as an approach to phenotype characterization for genetic studies of schizophrenia. Methods Mol Med. 2003;77:227–47. doi: 10.1385/1-59259-348-8:227. [DOI] [PubMed] [Google Scholar]
- 32.Dillon DG, et al. Variation in TREK1 gene linked to depression-resistant phenotype is associated with potentiated neural responses to rewards in humans. Hum Brain Mapp. 2009 doi: 10.1002/hbm.20858. [DOI] [PMC free article] [PubMed] [Google Scholar]
- 33.Greene CM, et al. Imaging the genetics of executive function. Biol Psychol. 2008;79(1):30–42. doi: 10.1016/j.biopsycho.2007.11.009. [DOI] [PubMed] [Google Scholar]
- 34.Kalin NH, et al. The serotonin transporter genotype is associated with intermediate brain phenotypes that depend on the context of eliciting stressor. Mol Psychiatry. 2008;13(11):1021–7. doi: 10.1038/mp.2008.37. [DOI] [PMC free article] [PubMed] [Google Scholar]
- 35.Chiu PH, et al. Self responses along cingulate cortex reveal quantitative neural phenotype for high-functioning autism. Neuron. 2008;57(3):463–73. doi: 10.1016/j.neuron.2007.12.020. [DOI] [PMC free article] [PubMed] [Google Scholar]
- 36.Kates WR, et al. The neural correlates of non-spatial working memory in velocardiofacial syndrome (22q11.2 deletion syndrome) Neuropsychologia. 2007;45(12):2863–73. doi: 10.1016/j.neuropsychologia.2007.05.007. [DOI] [PMC free article] [PubMed] [Google Scholar]
- 37.Meyer-Lindenberg A, et al. Neural basis of genetically determined visuospatial construction deficit in Williams syndrome. Neuron. 2004;43(5):623–31. doi: 10.1016/j.neuron.2004.08.014. [DOI] [PubMed] [Google Scholar]
- 38.Squire LR, Zola SM. Structure and function of declarative and nondeclarative memory systems. Proc Natl Acad Sci U S A. 1996;93(24):13515–22. doi: 10.1073/pnas.93.24.13515. [DOI] [PMC free article] [PubMed] [Google Scholar]
- 39.Carlesimo GA, Oscar-Berman M. Memory deficits in Alzheimer's patients: a comprehensive review. Neuropsychol Rev. 1992;3(2):119–69. doi: 10.1007/BF01108841. [DOI] [PubMed] [Google Scholar]
- 40.Cullum CM, Filley CM, Kozora E. Episodic memory function in advanced aging and early Alzheimer's disease. J Int Neuropsychol Soc. 1995;1(1):100–3. doi: 10.1017/s1355617700000151. [DOI] [PubMed] [Google Scholar]
- 41.Grosse DA, Gilley DW, Wilson RS. Episodic and semantic memory in early versus late onset Alzheimer's disease. Brain Lang. 1991;41(4):531–7. doi: 10.1016/0093-934x(91)90172-w. [DOI] [PubMed] [Google Scholar]
- 42.Hamilton JM, et al. A comparison of episodic memory deficits in neuropathologically-confirmed Dementia with Lewy bodies and Alzheimer's disease. J Int Neuropsychol Soc. 2004;10(5):689–97. doi: 10.1017/S1355617704105043. [DOI] [PubMed] [Google Scholar]
- 43.Grober E, et al. Memory and mental status correlates of modified Braak staging. Neurobiol Aging. 1999;20(6):573–9. doi: 10.1016/s0197-4580(99)00063-9. [DOI] [PubMed] [Google Scholar]
- 44.Laird AR, et al. ALE meta-analysis: controlling the false discovery rate and performing statistical contrasts. Hum Brain Mapp. 2005;25(1):155–64. doi: 10.1002/hbm.20136. [DOI] [PMC free article] [PubMed] [Google Scholar]
- 45.Eickhoff SB, Laird AR, Grefkes C, Wang LE, Zilles K, Fox PT. Coordinate-based activation likelihood estimation meta-analysis of neuroimaging data: A random-effects approach based on empirical estimates of spatial uncertainty. Hum Brain Mapp. 2009;30:2907–2926. doi: 10.1002/hbm.20718. [DOI] [PMC free article] [PubMed] [Google Scholar]
- 46.Ragland JD, Laird AR, Ranganath C, Blumenfeld RS, Gonzales SM, Glahn DC. Prefrontal activation deficits during episodic memory in schizophrenia. Am J Psychiatry. 2009;166(8):863–874. doi: 10.1176/appi.ajp.2009.08091307. [DOI] [PMC free article] [PubMed] [Google Scholar]
- 47.Schwindt GC, Black SE. Functional imaging studies of episodic memory in Alzheimer's disease: a quantitative meta-analysis. Neuroimage. 2009;45(1):181–90. doi: 10.1016/j.neuroimage.2008.11.024. [DOI] [PubMed] [Google Scholar]
- 48.Spaniol J, Davidson PS, Kim AS, Han H, Moscovitch M, Grady CL. Event-related fMRI studies of episodic encoding and retrieval: Meta-analyses using activation likelihood estimation. Neuropsychologia. 2009;47(8-9):1765–1779. doi: 10.1016/j.neuropsychologia.2009.02.028. [DOI] [PubMed] [Google Scholar]
- 49.Sperling RA, et al. Encoding novel face-name associations: a functional MRI study. Hum Brain Mapp. 2001;14(3):129–39. doi: 10.1002/hbm.1047. [DOI] [PMC free article] [PubMed] [Google Scholar]
- 50.McKhann G, et al. Clinical diagnosis of Alzheimer's disease: report of the NINCDS-ADRDA Work Group under the auspices of Department of Health and Human Services Task Force on Alzheimer's Disease. Neurology. 1984;34(7):939–44. doi: 10.1212/wnl.34.7.939. [DOI] [PubMed] [Google Scholar]
- 51.Morris JC. The Clinical Dementia Rating (CDR): current version and scoring rules. Neurology. 1993;43(11):2412–4. doi: 10.1212/wnl.43.11.2412-a. [DOI] [PubMed] [Google Scholar]
- 52.Folstein MF, Folstein SE, McHugh PR. “Mini-mental state”. A practical method for grading the cognitive state of patients for the clinician. J Psychiatr Res. 1975;12(3):189–98. doi: 10.1016/0022-3956(75)90026-6. [DOI] [PubMed] [Google Scholar]
- 53.Petersen RC, et al. Mild cognitive impairment: clinical characterization and outcome. Arch Neurol. 1999;56(3):303–8. doi: 10.1001/archneur.56.3.303. [DOI] [PubMed] [Google Scholar]
- 54.Talairach J, Tournoux P. Co-planar stereotaxic atlas of the human brain : 3-dimensional proportional system: an approach to cerebral imaging. Stuttgart; New York: Thieme ; Thieme Medical Publishers; 1988. p. viii, 122. [Google Scholar]
- 55.Lancaster JL, et al. Bias between MNI and Talairach coordinates analyzed using the ICBM-152 brain template. Hum Brain Mapp. 2007;28(11):1194–205. doi: 10.1002/hbm.20345. [DOI] [PMC free article] [PubMed] [Google Scholar]
- 56.Brett M. The MNI brain and the Talairach atlas, Cambridge Imagers. 1999 Available from: http://www.mrc-cbu.cam.ac.uk/Imaging/mnispace.html.
- 57.Turkeltaub PE, et al. Meta-analysis of the functional neuroanatomy of single-word reading: method and validation. Neuroimage. 2002;16(3 Pt 1):765–80. doi: 10.1006/nimg.2002.1131. [DOI] [PubMed] [Google Scholar]
- 58.Genovese CR, Lazar NA, Nichols T. Thresholding of statistical maps in functional neuroimaging using the false discovery rate. Neuroimage. 2002;15(4):870–8. doi: 10.1006/nimg.2001.1037. [DOI] [PubMed] [Google Scholar]
- 59.Du AT, et al. Magnetic resonance imaging of the entorhinal cortex and hippocampus in mild cognitive impairment and Alzheimer's disease. J Neurol Neurosurg Psychiatry. 2001;71(4):441–7. doi: 10.1136/jnnp.71.4.441. [DOI] [PMC free article] [PubMed] [Google Scholar]
- 60.Krishnan S, et al. Accuracy of spatial normalization of the hippocampus: implications for fMRI research in memory disorders. Neuroimage. 2006;31(2):560–71. doi: 10.1016/j.neuroimage.2005.12.061. [DOI] [PubMed] [Google Scholar]
- 61.Sandstrom CK, et al. Hippocampal atrophy confounds template-based functional MR imaging measures of hippocampal activation in patients with mild cognitive impairment. AJNR Am J Neuroradiol. 2006;27(8):1622–7. [PMC free article] [PubMed] [Google Scholar]
- 62.Diana RA, Yonelinas AP, Ranganath C. Imaging recollection and familiarity in the medial temporal lobe: a three-component model. Trends Cogn Sci. 2007;11(9):379–86. doi: 10.1016/j.tics.2007.08.001. [DOI] [PubMed] [Google Scholar]
- 63.Daselaar SM, Fleck MS, Cabeza R. Triple dissociation in the medial temporal lobes: recollection, familiarity, and novelty. J Neurophysiol. 2006;96(4):1902–11. doi: 10.1152/jn.01029.2005. [DOI] [PubMed] [Google Scholar]
- 64.Haskins AL, et al. Perirhinal cortex supports encoding and familiarity-based recognition of novel associations. Neuron. 2008;59(4):554–60. doi: 10.1016/j.neuron.2008.07.035. [DOI] [PubMed] [Google Scholar]
- 65.Ford JH, Verfaellie M, Giovanello KS. Neural correlates of familiarity-based associative retrieval. Neuropsychologia. 2010;48(10):3019–25. doi: 10.1016/j.neuropsychologia.2010.06.010. [DOI] [PMC free article] [PubMed] [Google Scholar]
- 66.Diana RA, Yonelinas AP, Ranganath C. The effects of unitization on familiarity-based source memory: testing a behavioral prediction derived from neuroimaging data. J Exp Psychol Learn Mem Cogn. 2008;34(4):730–40. doi: 10.1037/0278-7393.34.4.730. [DOI] [PMC free article] [PubMed] [Google Scholar]
- 67.Staresina BP, Davachi L. Selective and shared contributions of the hippocampus and perirhinal cortex to episodic item and associative encoding. J Cogn Neurosci. 2008;20(8):1478–89. doi: 10.1162/jocn.2008.20104. [DOI] [PMC free article] [PubMed] [Google Scholar]
- 68.Giovanello KS, et al. Age-related neural changes during memory conjunction errors. J Cogn Neurosci. 2010;22(7):1348–61. doi: 10.1162/jocn.2009.21274. [DOI] [PMC free article] [PubMed] [Google Scholar]
- 69.Raichle ME, Snyder AZ. A default mode of brain function: a brief history of an evolving idea. Neuroimage. 2007;37(4):1083–90. doi: 10.1016/j.neuroimage.2007.02.041. discussion 1097-9. [DOI] [PubMed] [Google Scholar]
- 70.Petrella JR, et al. Cortical deactivation in mild cognitive impairment: high-field-strength functional MR imaging. Radiology. 2007;245(1):224–35. doi: 10.1148/radiol.2451061847. [DOI] [PubMed] [Google Scholar]
- 71.Greicius MD, et al. Default-mode network activity distinguishes Alzheimer's disease from healthy aging: evidence from functional MRI. Proc Natl Acad Sci U S A. 2004;101(13):4637–42. doi: 10.1073/pnas.0308627101. [DOI] [PMC free article] [PubMed] [Google Scholar]
- 72.Daselaar SM, et al. Posterior midline and ventral parietal activity is associated with retrieval success and encoding failure. Front Hum Neurosci. 2009;3:13. doi: 10.3389/neuro.09.013.2009. [DOI] [PMC free article] [PubMed] [Google Scholar]
- 73.Gutchess AH, et al. Aging and the neural correlates of successful picture encoding: frontal activations compensate for decreased medial-temporal activity. J Cogn Neurosci. 2005;17(1):84–96. doi: 10.1162/0898929052880048. [DOI] [PubMed] [Google Scholar]
- 74.Grady CL, McIntosh AR, Craik FI. Task-related activity in prefrontal cortex and its relation to recognition memory performance in young and old adults. Neuropsychologia. 2005;43(10):1466–81. doi: 10.1016/j.neuropsychologia.2004.12.016. [DOI] [PubMed] [Google Scholar]
- 75.Dickerson BC, Sperling RA. Large-scale functional brain network abnormalities in Alzheimer's disease: insights from functional neuroimaging. Behav Neurol. 2009;21(1):63–75. doi: 10.3233/BEN-2009-0227. [DOI] [PMC free article] [PubMed] [Google Scholar]
- 76.Bai F, et al. Altered self-referential network in resting-state amnestic type mild cognitive impairment. Cortex. 2011 doi: 10.1016/j.cortex.2011.02.011. [DOI] [PubMed] [Google Scholar]
- 77.Hamalainen A, et al. Increased fMRI responses during encoding in mild cognitive impairment. Neurobiol Aging. 2007;28(12):1889–903. doi: 10.1016/j.neurobiolaging.2006.08.008. [DOI] [PubMed] [Google Scholar]
- 78.Machulda MM, et al. Functional magnetic resonance imaging changes in amnestic and nonamnestic mild cognitive impairment during encoding and recognition tasks. J Int Neuropsychol Soc. 2009;15(3):372–82. doi: 10.1017/S1355617709090523. [DOI] [PMC free article] [PubMed] [Google Scholar]
- 79.Peters F, et al. The neural correlates of verbal short-term memory in Alzheimer's disease: an fMRI study. Brain. 2009;132(Pt 7):1833–46. doi: 10.1093/brain/awp075. [DOI] [PubMed] [Google Scholar]
- 80.Lancaster JL, et al. Automated Talairach atlas labels for functional brain mapping. Hum Brain Mapp. 2000;10(3):120–31. doi: 10.1002/1097-0193(200007)10:3<120::AID-HBM30>3.0.CO;2-8. [DOI] [PMC free article] [PubMed] [Google Scholar]
- 81.Evans AC, et al. 3D statistical neuroanatomical models from 305 MRI volumes. IEEE Nuclear Science Symposium and Medical Imaging Conference; 1993; pp. 1813–1817. [Google Scholar]
Associated Data
This section collects any data citations, data availability statements, or supplementary materials included in this article.
Supplementary Materials
Figure 2 (Supplemental). Spatial locations reflecting reported normal control > mild cognitive impairment blood-oxygen-level-dependent (BOLD) activity contrast maxima associated with episodic memory encoding processes.
Note: Locations reflect aggregate MNI [81] spatial coordinate maxima for episodic memory encoding contrasts: Red = encoding > baseline condition; Blue = novel > repeated stimuli condition; and Green = remembered > forgotten stimuli (i.e., encoding success). Axial slices pictured every 5mm (-20z to 65z).
Figure 3 (Supplemental). Spatial locations reflecting reported normal control < mild cognitive impairment blood-oxygen-level-dependent (BOLD) activity contrast maxima associated with episodic memory encoding processes.
Note: Locations reflect aggregate MNI [81] spatial coordinate maxima for episodic memory encoding contrasts: Red = encoding > baseline condition; Blue = novel > repeated stimuli condition; and Green = remembered > forgotten stimuli (i.e., encoding success). Axial slices pictured every 5mm (-20z to 65z).
Figure 4 (Supplemental). Spatial locations reflecting reported normal control > Alzheimer's disease blood-oxygen-level-dependent (BOLD) activity contrast maxima associated with episodic memory encoding processes.
Note: Locations reflect aggregate MNI [81] spatial coordinate maxima for episodic memory encoding contrasts: Red = encoding > baseline condition; Blue = novel > repeated stimuli condition; and Green = remembered > forgotten stimuli (i.e., encoding success). Axial slices pictured every 5mm (-20z to 65z).
Figure 5 (Supplemental). Spatial locations reflecting reported normal control < Alzheimer's disease blood-oxygen-level-dependent (BOLD) activity contrast maxima associated with episodic memory encoding processes.
Note: Locations reflect aggregate MNI [81] spatial coordinate maxima for episodic memory encoding contrasts: Red = encoding > baseline condition; Blue = novel > repeated stimuli condition; and Green = remembered > forgotten stimuli (i.e., encoding success). Axial slices pictured every 5mm (-20z to 65z).