Abstract
The relationship between thrombopoietin (TPO) and its receptor cMpl in thrombocytopenic conditions has not been entirely clarified. To elucidate this interplay may expand the spectrum of indications of TPO mimetics. In this study we have explored the relationship between TPO and cMpl in platelets and megakaryocytes of 43 patients with thrombocytopenia due to idiopathic thrombocytopenic purpura (ITP), bone marrow hypoplasia, myelodysplastic syndromes (MDS), and familial thrombocytopenia. Data were compared to cMpl and TPO in patients with a normal platelet count and in patients with thrombocytosis due to essential thrombocythemia (ET). All but familial patients showed higher TPO compared to controls. All thrombocytopenic states were invariably associated with increased expression of platelet cMPL compared to healthy controls. ET patients showed normal TPO and a trend toward a reduced cMpl expression. Immunofluorescence of bone marrow sections from patients with ITP and MDS failed to show a peculiar pattern compared to controls. Multiple mechanisms regulate TPO and cMpl in thrombocytopenic conditions.
Key words: thrombocytopenia, thrombopoietin, thrombopoietin receptor, thrombopoiesis
Introduction
Megakaryopoiesis is a multistep process driving the proliferation, differentiation and maturation of hematopoietic stem cells to the generation of platelets, anucleate blood components with a fundamental role in the hemostatic process.1
A complex network of cytokines and chemokines controlling all different stages of the process regulates megakaryopoiesis. Thrombopoietin (TPO), through its receptor cMpl, is one of the main regulator of platelet count. TPO critically influences megakaryocyte (Mk) proliferation and differentiation through a complex signal transduction pathway.2
TPO/cMpl interplay not only affects Mk differentiation as it also regulates TPO serum levels and cMPL surface expression. In fact, following binding to Mk and platelet receptor, the TPO/cMpl complex is internalized, degraded in the proteasome and partially recycled to the cell surface.3 This dynamic mechanism is fundamental in regulating serum and bone marrow (BM) TPO levels.4
Based on this autoregulatory loop, conditions with a low platelet count and low Mk mass (i.e. aplastic anemia) will be characterized by high TPO serum levels as there is very limited cMpl receptor available to adsorb the hormone.4 However, this correlation does not seem to be consistently maintained in other thrombocytopenic conditions as myelodysplastic syndromes (MDS) and idiopathic thrombocytopenic purpura (ITP), conditions with a rather unpredictable TPO regulation due to a more profound dysregulation of megakaryopoiesis.5
In this study we have analyzed the serum TPO profile and the expression of cMpl in platelets and Mk of patients with thrombocytopenic states, namely ITP, MDS, familial thrombocytopenia (FAM) and hypoplastic BM, with the aim to validate whether mechanisms supposed to play a fundamental role in the regulation of thrombopoiesis are consistently in place.
Materials and Methods
Patients
Table 1 summarizes the characteristics of patients considered in the study. Serum samples were obtained from 15 patients with chronic ITP, 8 patients with hypoplastic BM due to aplastic anemia (n=3, severe idiopathic aplastic anemia according to published criteria,6 or to chemotherapy, n=5), 8 patients with thrombocytopenia due to MDS, and 12 patients with FAM including 10 cases of Bernard-Soulier and 2 cases of MYH9. All patients had platelet count between 20 and 80×109/L. As controls, we considered 15 healthy subjects. In patients treated with chemotherapy (3 NHL without BM involvement, 2 breast cancer), serum samples have been collected 10-18 days after start of treatment. All patients with aplastic anemia were on cyclosporine. ITP was diagnosed as primary form according to International Working Group criteria. In this group, serum samples were collected at diagnosis or at relapse (pretreatment sample). MDS patients were classified based on WHO 2008 classification. The institutional review board of this institution approved the study.
Table 1.
Clinical characteristics of patient subgroups.
| M/F | Age, years median±SD | Platelet count ×109/L, median±SD | Additional data | |
|---|---|---|---|---|
| FAM | 6/6 | 42.5±12 | 65±14 | 10 BS 2 MH |
| ITP | 5/10 | 38±16 | 41.6±22 | - |
| MDS | 5/3 | 60±12 | 44±24 | 5 RA 3 RCMD |
| Hypo | 4/4 | 62±15 | 38±19 | 3 AA 5 CT |
| Healthy controls | 9/6 | 36.5±12.2 | 261.5±55.5 | - |
| MGUS | 3/2 | 59±7 | 257±53.2 | - |
| ET | 8/4 | 50±8 | 818±318 | All V617F mutated |
AA, aplastic anemia; CT, Chemotherapy-induced thrombocytopenia; BS, Bernard-Soulier; MGUS, monoclonal gammopathy of undetermined significance; MH, May-Hegglin; RA: refractory anemia; RCMD, refractory anemia with multilineage dysplasia.
Platelet rich plasma preparation
Blood samples were collected from controls and patients after informed consent procedures, using ACD as anticoagulant. Preparation of platelet lysates were performed according to previously published methods.7 All patients who underwent BM study had blood collection and biopsy performed on the same day.
Thrombopoietin measurement and Western blot analysis of cMpl
Serum TPO was quantified by ELISA (Quantikyne Human TPO Immunoassay R&D Systems, Minneapolis, MN, USA) Aliquots of 2×10⁷ platelets were lysed with 2X Laemmli sample buffer and boiled for 10’. SDS electrophoresis was performed on 7.5% polyacrylamide gel (25 mA at RT for 1 hr 30’). Membranes were incubated overnight at 4°C with a rabbit polyclonal antibody anti cMpl-TpoR (Millipore Upstate; Temecula, CA, USA) at 1 µg/mL in TBST, then with a secondary anti-rabbit HRP antibody (Sigma Aldrich, St. Louis, MO, USA), and finally treated with enhanced chemiluminescence reagent (GE Healthcare, UK) before exposure to X-ray film. The gel was stripped at 50°C for 30 min, saturated and reprobed with a mouse anti CD41 (SZ22 clone – Beckman Coulter Immunotech, Marseille, F) monoclonal antibody against platelet GPIIb for normalization. Following acquisition using a CCD camera in a light table with shading correction, densitometric analysis was performed by ImageJ 1.38 (Windows version of NIH Image, http://rsb.info.nih.gov/nih-image/) and background correction was done with the default settings (rolling ball radius=50).8 The sum of the densitometric analysis of the two cMpl bands (MW 85 and 75 kDa) was considered for the analysis. The ratio between cMpl and CD41 expression was then calculated for each sample.
Immunocytochemical analysis of bone marrow slides by videoconfocal image
Paraffin embedded bone marrow biopsy specimens were obtained by standard procedures. All samples were treated for double staining by co-incubation at 4°C overnight with rabbit polyclonal antibody anti cMpl-TpoR (Millipore Upstate) and mouse anti CD41 (SZ22 clone – Beckman Coulter Immunotech) monoclonal antibody (dilution 1:50 and 1:150 respectively).
Biotin conjugate secondary antibody followed by streptavidin/Texas Red was used for rabbit cMpl, whereas secondary antimouse FITC antibody was used for mouse anti CD41.
In order to assess specificity of the primary antibody, in a separate session primary immunoreaction was performed by incubating (1 h, RT) samples with goat polyclonal antibody anti cMpl mapping the N-terminus of the protein (1:10; Santa Cruz Biotechnology, CA, USA), followed by incubation (ON, 4°C) with rabbit polyclonal antibody anti cMpl-TpoR. Secondary immunodetection was then performed by anti-rabbit antibody. Any loss of corresponding signal was considered attributable to the specificity of the rabbit primary antibody. Appropriate negative and aspecific controls were also performed. As a source of normal MK compartment, BM samples from 5 patients diagnosed with monoclonal gammopathy of uncertain significance (MGUS) with normal blood count were included. With the intention to include a condition with a well-defined cMpl expression pattern,9 BM samples of 12 patients with essential thrombocythemia (bearing the V617F JAK2 gene mutation) were included in the analysis. Sections were counterstained with DAPI and analyzed with Video-Confocal VICO fluorescence microscope (Nikon, Firenze, Italy) equipped with a 100X (oil) objective. The number of Mk was quantitated by counting Mk in 10 low power fields (16X objective).10 The corrected total cell fluorescence for cMpl expression per MK (6 MK/Bm sample were considered) was quantitated by ImageJ software.11,12 With the exception of samples from MDS patients, cMpl quantitation was performed on mature Mk as conventionally defined.13
Statistical analysis
Data were presented as the mean±SD. Differences between two groups of data were analyzed by non-parametric test (Mann-Whitney). All of the above analyses were conducted using GraphPad Software (La Jolla, CA, USA).
Results
Thrombopoietin serum levels in thrombocytopenic and control patients
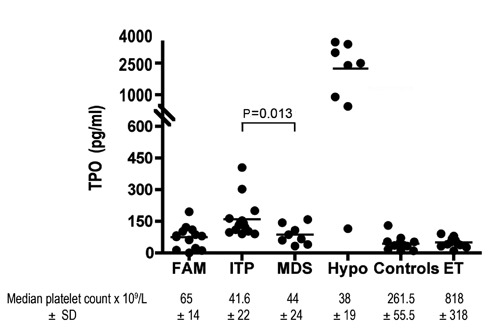
As expected, patients with BM hypoplasia showed the highest TPO level (2273±1491 pg/mL) (Figure 1). Both ITP and MDS patients had higher TPO levels (160±105 pg/mL and 88±46 pg/mL, respectively) compared to the control group (44±35 pg/mL; P<0.001 ITP vs controls and P=0.018 MDS vs controls). TPO serum level was higher in ITP patients compared to the MDS group (P=0.013). FAM patients did not show any significant difference compared to controls (74±44 vs 44±35 pg/mL, P=0.10). Analysis of TPO levels in healthy controls and in ET patients showed similar levels of serum TPO (51±21 pg/mL) (Figure 1).
Figure 1.

Thrombopoietin serum levels in different thrombocytopenic states.
cMPL expression
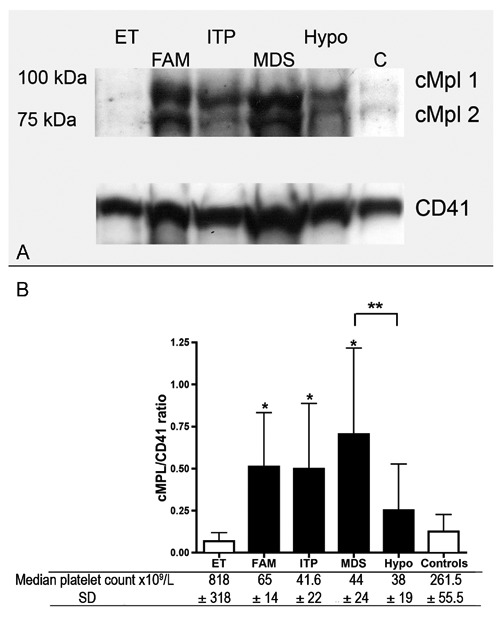
For quantitation of cMPL expression by WB, we considered the densitometric sum of the two bands corresponding to the glycosylated and non-glycosylated cMpl forms. A representative blot and the cumulative result of the densitometric analysis of all patients are shown in Figure 2. All thrombocytopenic states were invariably associated to increase expression of cMPL. However, the expression reached statistical significance in ITP (0.53±0.38), FAM (0.56±0.3) and MDS (0.7±0.5) patients compared to healthy controls (0.13±0.1; P=0.008, P=0.001 and P=0.0014, respectively) but not in patients with BM-hypoplasia (0.25±0.27) (Figure 2B). ET cases showed a trend toward a reduction in cMpl expression (0.05±0.04) compared to healthy controls although without statistical significance (Figure 2). When comparing experimental groups among them, cMPL expression showed a statistically significant difference only in MDS compared to patients with BM hypoplasia (P=0.002).
Figure 2.

A) Western blot (WB) analysis of cMpl expression in platelet lysates from different thrombocytopenic states and from patients with ET. B) Densitometric analysis of WB is shown as sum of cMpl 1 and cMpl 2 normalized to CD41. *P<0.01 (vs controls); **P=0.002 (B).
Videoconfocal microscopy
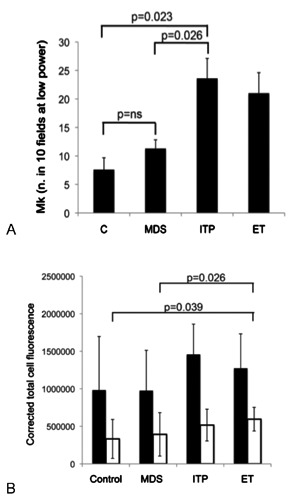
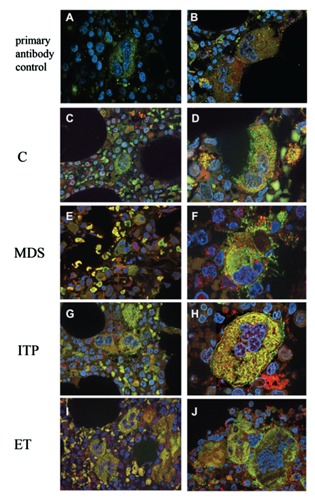
The expression of cMpl in Mk was then evaluated in BM samples from patients with MDS and ITP and findings compared to the Mk pattern of a normal control group (patients with MGUS assumed as having a normal BM). We also included ET patients in this analysis as a reference condition endowed with low BM levels of cMpl.9 As expected, the number of BM MK (total number in 10 low power fields) was significantly increased in ITP patients compared to normal controls (25±3.25 vs 7.5±2.16, P=0.023) whereas no difference was found in MDS compared to normal samples (Figure 3A). We then examined the expression of cMpl in Mk (Figures 3 and 4). The quantitation performed by immunofluorescence in Mk of patients with MDS and ITP (Figure 3B; Figure 4E-H) failed to detect any significant difference compared to controls (Figure 3B; Figure 4C,D). Morphology of Mk as well as expression of cMpl were rather heterogeneous in patients with MDS, ranging from very positive Mk to weak staining. MKs of patients with ET scored a higher cMpl expression compared to controls (P=0.039; Figure 3B; Figure 4C,D,I,J).
Figure 3.

A) Quantitation of BM Mk was performed on BM sections by counting of Mk in 10 low power fields (16X objective). B) Quantitation of cMpl (white histograms) and CD41 (black histograms) fluorescence was performed by ImageJ software (see methods).
Figure 4.

Immunofluorescence in BM samples from patients with thrombocytopenia and controls. (C,D) Control; (E-F) MDS; (G-H) ITP; (I-J) patients with ET. (100x; Merge: CD41 green, cMPL red). Specificity of primary antibody binding was confirmed by preincubation of BM samples with (A) or without (B) goat polyclonal antibody anti cMpl (see methods).
Discussion
Platelet count and megakaryocyte mass are the main regulators of TPO activity through the modulation of its receptor, cMpl. In this study we sought a relationship between serum TPO and the expression of cMpl on platelets and Mk in different conditions of thrombocytopenia. All thrombocytopenic diseases showed increased TPO serum levels independently of the pathogenesis of cytopenia. Differences among the different conditions seem to tally with previously published data, and particularly with very high serum TPO levels of patients with Mk hypoplasia compared to the mild increase observed in thrombocytopenic patients with a normal or increase megakaryocyte mass. This inverse relationship may be viewed as evidence of regulatory role of megakaryocyte mass in TPO levels.4 However, we did not find a consistent negative correlation between TPO and Mk mass in other thrombocytopenic conditions with a functional BM. In fact, patients with ITP had higher serum levels of TPO compared to patients with MDS although the Mk density was higher in the former group compared to the latter. Therefore, regulation of TPO cannot be merely related to a two-compartment model, platelet and Mk mass. It is tempting to speculate that a third variable probably controls TPO levels, which unfortunately cannot be quantitated in our current analysis. It relates to platelet production and turnover which is profoundly different in most of thrombocytopenic conditions. In this regard, levels of plasma TPO reflect the balance between production and rate of destruction of the cytokine, the latter being dictated by platelet turnover. In a situation of high platelet turnover like ITP, characterized by normal platelet production but short platelet half-life, the major determinant of TPO plasma levels is the high rate of platelets and TPO removal from the circulation. On the contrary, in other conditions like BM hypoplasia, platelet turnover is not significantly affected and TPO levels are the result of low platelet production and perhaps low Mk mass.
Other variables add complexity to the regulation of TPO levels.5,14 For example in MDS, Mk are rather heterogeneous as they represent a mix of normal and clonal cells likely bearing a deranged cMpl expression.9 Furthermore, in ITP as in MDS, programmed cell death of BM Mk may affect cMpl expression on a per cell basis.15,16
In our study we also included patients with ET with the aim to validate our data against a myeloproliferative disorder extensively studied with regard to TPO and cMpl regulation. Thrombocytosis was associated with normal TPO levels and reduced expression of cMpl in platelets but not in BM MKs. This finding was at first unexpected but, if one carefully reviews previous data in MPD disorders, convincing data are available in polycythemia vera and idiopathic myelofibrosis but not ET.9,17 Our data do not add significant insights in the attempt to predict the response of thrombocytopenic patients to TPO mimetics based on endogenous TPO levels. However, our observation may encourage further studies evaluating TPO agonists irrespective to TPO levels but aiming to identify markers of cMpl activity. This approach may find support also from recent data on the effectiveness of eltrombopag in stimulating hematopoiesis in aplastic anemia, a condition with elevated thrombopoietin levels, suggesting that platelet generation can be sustained by mechanisms unrelated to endogenous TPO.18
Conclusions
In conclusion, our results only partially corroborate the inverse relationship between circulating TPO and MK mass and they suggest that not only the MK mass but also the overall receptor density in Mk as well as in platelets contribute to TPO serum balance.
References
- 1.Patel SR, Hartwig JH, Italiano JE., Jr.The biogenesis of platelets from megakaryocyte proplatelets. J Clin Invest 2005;115:3348-54 [DOI] [PMC free article] [PubMed] [Google Scholar]
- 2.Kaushansky K.The molecular mechanisms that control thrombopoiesis. J Clin Invest 2005;115:3339-47 [DOI] [PMC free article] [PubMed] [Google Scholar]
- 3.Dahlen DD, Broudy VC, Drachman JG.Internalization of the thrombopoietin receptor is regulated by 2 cytoplasmic motifs. Blood 2003;102:102-8 [DOI] [PubMed] [Google Scholar]
- 4.Emmons RV, Reid DM, Cohen RL, et al. Human thrombopoietin levels are high when thrombocytopenia is due to megakaryocyte deficiency and low when due to increased platelet destruction. Blood 1996;87:4068-71 [PubMed] [Google Scholar]
- 5.Tamura H, Ogata K, Luo S, et al. Plasma thrombopoietin (TPO) levels and expression of TPO receptor on platelets in patients with myelodysplastic syndromes. Br J Haematol 1998;103:778-84 [DOI] [PubMed] [Google Scholar]
- 6.Rozman C, Marin P, Nomdedeu B, Montserrat E.Criteria for severe aplastic anaemia. Lancet 1987;2:955-7 [DOI] [PubMed] [Google Scholar]
- 7.Vettore S, Tezza F, Malara A, et al. A A386G biallelic GPIbalpha gene mutation with anomalous behavior: a new mechanism suggested for Bernard-Soulier syndrome pathogenesis. Haematologica 2011;96:1878-82 [DOI] [PMC free article] [PubMed] [Google Scholar]
- 8.Gassmann M, Grenacher B, Rohde B, Vogel J.Quantifying Western blots: pitfalls of densitometry. Electrophoresis 2009;30:1845-55 [DOI] [PubMed] [Google Scholar]
- 9.Bock O, Schlue J, Mengel M, et al. Thrombopoietin receptor (Mpl) expression by megakaryocytes in myeloproliferative disorders. J Pathol 2004;203:609-15 [DOI] [PubMed] [Google Scholar]
- 10.Louwes H, Zeinali Lathori OA, et al. Platelet kinetic studies in patients with idiopathic thrombocytopenic purpura. Am J Med 1999;106:430-4 [DOI] [PubMed] [Google Scholar]
- 11.Potapova TA, Sivakumar S, Flynn JN, et al. Mitotic progression becomes irreversible in prometaphase and collapses when Wee1 and Cdc25 are inhibited. Mol Biol Cell 2011;22:1191-06 [DOI] [PMC free article] [PubMed] [Google Scholar]
- 12.Rasband WS.ImageJ. Bethesda: U.S. National Institutes of Health; 1997-2012 [Google Scholar]
- 13.McKenzie SB.Textbook of hematology. Philadelphia: Williams & Wilkins; 1996 [Google Scholar]
- 14.Yoon SY, Li CY, Tefferi A.Megakaryocyte c-Mpl expression in chronic myeloproliferative disorders and the myelodysplastic syndrome: immunoperoxidase staining patterns and clinical correlates. Eur J Haematol 2000;65:170-4 [DOI] [PubMed] [Google Scholar]
- 15.Mahabir VK, Ross C, Popovic S, et al. A blinded study of bone marrow examinations in patients with primary immune thrombocytopenia. Eur J Haematol 2013; 90:121-6 [DOI] [PMC free article] [PubMed] [Google Scholar]
- 16.Houwerzijl EJ, Blom NR, van der Want JJ, et al. Ultrastructural study shows morphologic features of apoptosis and para-apoptosis in megakaryocytes from patients with idiopathic thrombocytopenic purpura. Blood 2004;103:500-6 [DOI] [PubMed] [Google Scholar]
- 17.Moliterno AR, Hankins WD, Spivak JL.Impaired expression of the thrombopoietin receptor by platelets from patients with polycythemia vera. N Engl J Med 1998;338:572-80 [DOI] [PubMed] [Google Scholar]
- 18.Olnes MJ, Scheinberg P, Calvo KR, et al. Eltrombopag and improved hematopoiesis in refractory aplastic anemia. N Engl J Med 2012;367:11-9 [DOI] [PMC free article] [PubMed] [Google Scholar]


