

Abstract
Liquid chromatography–multiple reaction monitoring mass spectrometry (LC-MRM-MS) of plasma that has been depleted of abundant proteins and fractionated at the peptide level into six to eight fractions is a proven method for quantifying proteins present at low nanogram-per-milliliter levels. A drawback of fraction-MRM is the increased analysis time due to the generation of multiple fractions per biological sample. We now report that the use of heated, long, fused silica columns (>30 cm) packed with 1.9 μm of packing material can reduce or eliminate the need for fractionation prior to LC-MRM-MS without a significant loss of sensitivity or precision relative to fraction-MRM. We empirically determined the optimal column length, temperature, gradient duration, and sample load for such assays and used these conditions to study detection sensitivity and assay precision. In addition to increased peak capacity, longer columns packed with smaller beads tolerated a 4- to 6-fold increase in analyte load without a loss of robustness or reproducibility. The longer columns also provided a 4-fold improvement in median limit-of-quantitation values with increased assay precision relative to the standard 12 cm columns packed with 3 μm material. Overall, the optimized chromatography provided an approximately 3-fold increase in analysis throughput with excellent robustness and less than a 2-fold reduction in quantitative sensitivity relative to fraction-MRM. The value of the system for increased multiplexing was demonstrated by the ability to configure an 800-plex MRM-MS assay, run in a single analysis, comprising 2400 transitions with retention time scheduling to monitor 400 unlabeled and heavy labeled peptide pairs.
Liquid chromatography–multiple reaction monitoring mass spectrometry (LC-MRM-MS)1 using isotopically labeled standard peptides for each analyte (stable isotope dilution) is being used with increasing frequency in biology and medicine for the precise, reproducible quantification of target peptides and proteins of interest in cells, tissues, and biofluids (1). Quantitative analysis of candidate biomarker proteins and peptides requires highly selective and sensitive assays capable of detecting and quantifying large numbers of proteins in plasma or other accessible biofluids. We have previously shown that LC-MRM-MS of human plasma following immunoaffinity depletion of the 6 to 14 most abundant proteins, trypsin digestion, and chromatographic separation (using either strong cation exchange or basic reversed phase chromatography) into six to eight fractions enables precise, multiplexed quantification of peptides derived from proteins that are present at low nanogram-per-milliliter levels (2–4). We call this process fraction-MRM (fMRM). A drawback of fMRM is that the generation of multiple fractions increases both the analysis time per biological sample and the complexity of data analysis. In contrast, immuno-MRM methods provide low to sub-nanogram-per-milliliter quantification of proteins in plasma with minimal sample processing prior to analysis (5–8). However, immuno-MRM requires the development of antibodies capable of either protein or peptide capture, a process that is both time consuming and costly, especially if distributable amounts of antibody are to be generated by the production of a monoclonal antibody (9).
To mitigate the respective limitations of fMRM and immuno-MRM, we have now evaluated the use of ultra-high-performance LC with MRM-MS using long fused silica columns (>30 cm) packed with sub-2 μm reversed-phase material. Mann and coworkers recently described the use of these columns in the context of discovery proteomics (10), showing a 2.5-fold increase in the number of peptide identifications in the analysis of yeast in a single injection by LC-MS/MS. Here we systematically evaluated the effects of column length, temperature, gradient duration, and sample load on peak shape, peak capacity, LOD, LOQ, assay precision, and overall robustness in the context of multiplexed, quantitative measurement of peptides in human plasma by MRM-MS. We found that the use of heated, long, fused silica columns packed with sub-2 μm resin provided an approximately 3-fold increase in sample analysis throughput without any significant loss of precision and with only a modest reduction in sensitivity of the assays relative to fMRM using conventional nano-chromatography. The need for fractionation prior to LC-MRM-MS is therefore greatly diminished or possibly eliminated, depending on the ultimate assay sensitivity required. We also took advantage of the higher peak capacity of the system to develop an 800-plex MRM-MS assay comprising 2400 transitions with retention time scheduling that allowed us to monitor 400 unlabeled and heavy labeled peptide pairs in a single analysis. This successful development of one of the most highly multiplexed targeted MS analyses reported to date further demonstrates the power of ultra-high-pressure LC in the context of targeted mass spectrometry. Preliminary reports of our studies were presented at the meeting of the International Human Proteome Organization in Boston in September 20122 and again at the annual meeting of the American Society of Mass Spectrometry (Minneapolis, MN, June 2013).3
EXPERIMENTAL PROCEDURES
Peptide Standard Mixtures
A six-bovine-protein digest of equal molar concentration was purchased from Bruker-Michrom, Billerica, MA as lyophilized powder, reconstituted in 0.1% formic acid/3% acetonitrile for a stock concentration of 1 pm/μl, and kept at −80 °C. The stock was further diluted to 50 fmol/μl in the same buffer for the experiments.
Unlabeled synthetic peptides and corresponding labeled peptides containing a single amino acid labeled with C13 or C13N15 were synthesized by New England Peptide (Gardner, MA), MIT Biopolymers Facility (Cambridge, MA), 21st Century Biochemicals (Marlboro, MA), GL Biochem (Shanghai, China), or Thermo Fisher Scientific (Ulm, Germany). Peptides were obtained at a purity of at least 95%; stock solutions were prepared in 30% acetonitrile/0.1% formic acid, and concentrations were determined via amino acid analysis (New England Peptide, Gardener, MA).
Plasma Preparation
Plasma immunoaffinity depleted of the 14 most abundant proteins using MARS-14 columns (Agilent, Santa Clara, CA) was obtained from NIST (Gaithersburg, MD) at a concentration of 4.5 mg/ml as determined by BCA (Thermo-Pierce, Rockland, IL). Depleted plasma was denatured with 6 m urea, reduced with 20 mm dithiothreitol at 37 °C for 30 min, alkylated with 50 mm iodoacetimide at room temperature in the dark for 30 min, and, following dilution of urea to 1 m, enzymatically digested with porcine trypsin (sequencing grade modified; Promega, Madison, WI) using a 1:50 (w/w) enzyme-to-substrate ratio for 16 h at 37 °C. The digestion reaction was terminated with formic acid to a final concentration of 1%, and samples were desalted using Oasis HLB 1 cc (30 mg) reversed-phase cartridges (Waters, Milford, MA). Eluates were frozen, dried by vacuum centrifugation, and stored at −80 °C. As needed, dried aliquots were resuspended in 3% acetonitrile/0.1% formic acid, clarified by centrifugation, and diluted to the necessary background level.
Preparation of Columns
PicoFrit 75 μm inner diameter/10 μm tip columns (New Objective, Woburn, MA) were packed with either 3 μm/120 Å or 1.9 μm/120 Å ReproSil-Pur C18-AQ beads (Dr. Maisch GmbH, Germany) in-house using a high-pressure chamber and helium gas regulated to 900 psi with a suspension of beads in 30% isopropyl alcohol in acetonitrile or neat isopropyl alcohol, respectively. Once packed to the intended length, the packing solvent was exchanged with acetonitrile for 1 h prior to equilibration in water/0.1% formic acid (buffer A). Each column was preconditioned via gradient elution of six-bovine-protein digest.
LC-MRM-MS Configuration
LC-MRM-MS analyses were done using a Xevo TQ-S Triple Quadrupole mass spectrometer (Waters, Milford, MA) coupled to a NanoAquity LC (Waters, Milford, MA). Liquid chromatography was performed using 0.1% formic acid in water as buffer A and 0.1% formic acid in acetonitrile as buffer B, at a flow rate of 300 nl/min with a 1 μl full-loop injection. The column temperature was controlled by using either a 15 cm or a 30 cm heated sleeve (Phoenix S&T, Chester, PA) set to the appropriate temperature. All samples were reconstituted in 3% acetonitrile/0.1% formic acid. MS source conditions included a cone voltage optimized to 35 V, a capillary voltage set to 3 kV, a source temperature of 90 °C, cone gas flow at 50 l/h, and nebulizer gas at 0.2 bar.
Effects of Column Length, Temperature, and Particle Size
For the evaluation of effects of column length and operating temperature on column back-pressure, 14 different column configurations were used (supplemental Table S1). PicoFrit 75 μm inner diameter columns were packed with 3 μm/120 Å beads to 12 cm (our standard configuration), 24 cm, and 48 cm lengths, and PicoFrit 75 μm inner diameter columns were packed with 1.9 μm/120 Å beads to 17 cm, 22 cm, and 30 cm lengths. The 12 cm/3 μm column was evaluated only at 25 °C, whereas 22 cm/1.9 μm and 30 cm/1.9 μm columns were not evaluated at 25 °C because of pressure considerations. All the other columns were evaluated at three different temperatures (25 °C, 50 °C, and 60 °C). Column back-pressure at the highest point during the gradient and the pressure range for some of the column configurations are listed in supplemental Table S1. Although many ultra-high-pressure LC systems today are rated to function robustly at 10,000 psi or higher, we initially sought to outline expected back-pressure ranges as part of the optimization process with regard to system robustness. Assuming a gradual increase in back-pressure over the performance of each column, our goal was to maintain a working backpressure range of 60% to 70% of the upper limit for the instrument. In addition, although ReproSil beads are rated to function well up to 60 °C, we chose to operate at no more than 50 °C.
Based on the back-pressure evaluation, selected column configurations were evaluated for peak width, capacity, and resolution using a six-bovine-protein digest. Injection of 50 fm of the sample was performed in triplicate onto each column configuration at a flow rate of 300 n/min utilizing the following four-segment gradient: 5 min isocratic hold at 2.7% B; 3.6% B per minute to 13.5% B; 0.53% B per minute to 31.5% B; 16.5% B per minute to 81% B; and 30, 70, or 110 min of re-equilibration, depending on column length. An unscheduled MRM-MS method consisting of 100 transitions representing 20 peptides (5 transitions per peptide) was used (supplemental Table S2). The collision energy was optimized for each transition and ranged from 16 to 38 V. The unscheduled MRM-MS method was developed with a dwell time of 10 ms. MRM-MS method development and data analysis were performed using Skyline software (11). Peak height, width, and area were evaluated using the most abundant transition unless interference was observed.
Full width at half-maximum (FWHM) as reported by Skyline was used for peak width evaluation. Peak capacity was calculated using the formula p = 1 + tg/w, where tg is the time for the linear portion of the gradient and w is the average FWHM of all 20 transitions. For peak resolution calculations, four peptide pairs were selected representing early elution in the gradient (YST/TAA), mid-gradient elution (LVN/YNL and HLV/DGGI), and late elution in the gradient (LGE/IHG) (supplemental Fig. S1). The peak resolution was calculated using the formula r = 2ΔZ/(WA + WB), where ΔZ is the separation time between peak apexes in seconds and WA and WB are the baseline peak widths of the two peaks.
Gradient Optimization
Thirty synthetic heavy labeled peptides (Table I) were spiked into 1 μg/μl depleted, digested plasma at a concentration of 2 fmol/μl, and 1 μl of the sample was analyzed in triplicate on our standard 12 cm/3 μm column operated at 25 °C with a 35 min gradient as follows: a 5 min hold at 2.7% B, followed by a ramp to 9% B in 3 min and the main 35 min gradient segment at 1.03% B per minute. After elution of all peptides, a 2 min ramp to 81% B and a 4 min hold in high organic were employed, followed by a 30 min re-equilibration period. This same sample was also analyzed on a 30 cm/1.9 μm column operated at 50 °C using four different gradients. All four gradients began with a 5 min isocratic hold at 2.7% B and changed by 3.6% B per minute to 6.3% B, but they differed in the central portion of the gradient (0.42% B per minute (60 min), 0.21% B per minute (120 min), 0.14% B per minute (180 min), or 0.11% B per minute (240 min) to 31.5% B) before finishing with 24.8% B per minute to 81% B. The final step was a 19 min hold at 81% B before re-equilibration. Carryover was evaluated periodically in LC-MRM-MS mode, but none was detected using 5 fm to 10 fm spikes of the peptides. In addition, to prevent the possibility of carryover, the sample loop was kept in-line during the analytical runs.
Table I. Target proteins and their signature peptides for MRM-MS assay development. Unlabeled and corresponding [13C] or [13C15N] labeled peptides were synthesized for optimization and employment of stable isotope dilution multiple reaction monitoring mass spectrometry.
| Protein | Signature Peptide | MH+ (mono) | z (Q1) | MRM Transitions |
|||
|---|---|---|---|---|---|---|---|
| Q1 | Q3 | ||||||
| AEBP1 | ILNPGEYRa | 961.51 | 2 | 481.26 | 524.25 | 621.3 | 735.34 |
| ILNPGEY[13C6]Ra | 967.53 | 2 | 484.27 | 530.27 | 627.32 | 741.36 | |
| NPFVLGANLNGGERa | 1457.75 | 2 | 729.38 | 887.43 | 1000.52 | 1099.59 | |
| NPFVLGANLNGGE[13C6]Ra | 1463.77 | 2 | 732.39 | 893.45 | 1006.54 | 1105.61 | |
| DTPVLSELPEPVVARa | 1621.88 | 2 | 811.44 | 767.44 | 880.53 | 1096.60 | |
| DTPVLSELPEPVVA[13C6]Ra | 1627.90 | 2 | 814.45 | 773.46 | 886.55 | 1102.62 | |
| VVNEECamcPTITRa | 1317.65 | 2 | 659.33 | 587.35 | 747.38 | 1119.51 | |
| VVNEECamcPTIT[13C6]Ra | 1323.67 | 2 | 662.34 | 593.37 | 753.40 | 1125.53 | |
| APR | AGLCamcQTFVYGGCamcRa,b | 1488.68 | 2 | 744.84 | 858.39 | 959.44 | 1087.50 |
| AGLCamcQTF[13C5]VYGGCamcRa,b | 1493.70 | 2 | 747.35 | 863.41 | 964.46 | 1092.52 | |
| BNP | MVQGSGCamcFGRa,b | 1098.49 | 2 | 549.74 | 683.29 | 740.31 | 868.37 |
| M[13C5]VQGSGCamcFGRa,b | 1103.51 | 2 | 552.25 | 683.29 | 740.31 | 868.37 | |
| MoxVQGSGCamcFGRa,b | 1114.48 | 2 | 557.74 | 683.29 | 740.31 | 868.37 | |
| Mox[13C5]VQGSGCamcFGRa,b | 1119.50 | 2 | 560.25 | 683.29 | 740.31 | 868.37 | |
| ISSSSGLGCamcKa,b | 995.49 | 2 | 498.24 | 708.33 | 795.37 | 882.40 | |
| ISSSSGLGCamc[13C6]Ka,b | 1001.51 | 2 | 501.26 | 714.35 | 801.39 | 888.42 | |
| CRP | ESDTSYVSLKb | 1128.50 | 2 | 564.77 | 609.36 | 696.39 | 797.44 |
| ESDTSYVSL[13C6]Kb | 1134.60 | 2 | 567.78 | 615.38 | 702.41 | 803.46 | |
| GYSIFSYATKb | 1136.60 | 2 | 568.78 | 716.36 | 829.45 | 916.48 | |
| GYSIFSYAT[13C6]Kb | 1142.60 | 2 | 571.79 | 722.38 | 835.47 | 922.50 | |
| FHL1 | AIVAGDQNVEYKa | 1306.66 | 2 | 653.84 | 952.44 | 1023.47 | 1122.54 |
| AIVAGDQNVEY[13C6]Ka | 1312.68 | 2 | 656.85 | 958.46 | 1029.49 | 1128.56 | |
| NPITGFGKa | 833.45 | 2 | 417.23 | 408.22 | 509.27 | 622.36 | |
| NPITGFG[13C6]Ka | 839.47 | 2 | 420.24 | 414.24 | 515.29 | 628.38 | |
| FCamcANTCamcVECamcRa | 1316.52 | 2 | 658.76 | 824.34 | 938.38 | 1009.42 | |
| FCamcANTCamcVECamc[13C6]Ra | 1322.54 | 2 | 661.77 | 830.36 | 944.40 | 1015.44 | |
| DCamcFTCamcSNCamcKa | 1191.42 | 2 | 596.22 | 508.22 | 668.25 | 769.30 | |
| DCamcFTCamcSNCamc[13C6]Ka | 1197.44 | 2 | 599.22 | 514.24 | 674.27 | 775.32 | |
| HRP | DTIVNELRa,b | 959.52 | 2 | 480.26 | 531.29 | 630.36 | 743.44 |
| DTIVNE[13C6]LRa,b | 965.54 | 2 | 483.27 | 537.31 | 636.38 | 749.46 | |
| IL-33 | DFWLHANNKa,b | 763.38 | 3 | 382.19 | 441.73 | 583.29 | 696.38 |
| DFW[13C6]LHANNKa,b | 767.39 | 3 | 384.20 | 444.74 | 583.29 | 702.40 | |
| DNHLALIKa,b | 923.54 | 2 | 462.27 | 480.22 | 551.26 | 664.34 | |
| DNHLA[13C6]LIKa,b | 929.56 | 2 | 465.28 | 480.22 | 551.26 | 670.36 | |
| TDPGVFIGVKa,b | 1032.58 | 2 | 516.79 | 662.42 | 719.45 | 816.50 | |
| TDPGVFIGV[13C6]Ka,b | 1038.60 | 2 | 519.80 | 668.44 | 725.47 | 822.52 | |
| LEP | INDISHTQSVSAKa,b | 1399.73 | 3 | 467.24 | 543.28 | 586.80 | 643.82 |
| INDISHTQS[13C6]VSAKa,b | 1404.75 | 3 | 468.92 | 543.28 | 589.31 | 646.33 | |
| MBP | HGFLPRa | 726.41 | 2 | 363.71 | 385.26 | 532.32 | 589.35 |
| HGF[13C6]LPRa | 732.43 | 2 | 366.72 | 391.28 | 538.34 | 595.37 | |
| YLASASTMDHARa,b | 1322.63 | 3 | 441.54 | 488.22 | 523.74 | 817.36 | |
| Y[13C6]LASASTMDHARa,b | 1328.65 | 3 | 443.55 | 488.22 | 523.74 | 817.36 | |
| MPO | IPCamcFLAGDTRa,b | 1149.58 | 2 | 575.29 | 632.34 | 779.40 | 939.44 |
| IPCamcF[13C6]LAGDTRa,b | 1155.60 | 2 | 578.30 | 638.36 | 785.42 | 945.46 | |
| IANVFTNAFRa,b | 1152.62 | 2 | 576.81 | 755.38 | 854.45 | 968.49 | |
| IANVFTNAF[13C6]Ra,b | 1158.64 | 2 | 579.82 | 761.40 | 860.47 | 974.51 | |
| MYO | LFTGHPETLEKa | 1271.68 | 3 | 424.56 | 506.26 | 579.79 | 716.38 |
| LFTGHPET[13C6]LEKa | 1277.70 | 3 | 426.57 | 509.27 | 582.80 | 722.40 | |
| MYL3 | AAPAPAPPPEPERPKa | 1524.82 | 2 | 762.91 | 626.36 | 1046.56 | 1214.65 |
| AAPAPAPPPEPERP[13C6]Ka | 1530.84 | 2 | 765.92 | 632.38 | 1032.58 | 1220.67 | |
| ALGQNPTQAEVLRa | 1396.75 | 2 | 698.88 | 715.41 | 913.51 | 1027.55 | |
| ALGQNPTQAEVL[13C6]Ra | 1402.77 | 2 | 701.89 | 721.43 | 919.53 | 1033.57 | |
| EVEFDASKa | 924.43 | 2 | 462.72 | 420.21 | 567.28 | 696.32 | |
| EVEFDAS[13C6]Ka | 930.45 | 2 | 465.73 | 426.23 | 573.3 | 702.34 | |
| HVLATLGERa | 995.56 | 2 | 498.29 | 646.35 | 759.44 | 858.50 | |
| HVLATLGE[13C6]Ra | 1001.58 | 2 | 501.30 | 652.37 | 765.46 | 864.52 | |
| NT-proBNP | MoxVLYTLRa,b | 911.51 | 2 | 456.25 | 552.31 | 665.40 | 764.47 |
| MoxVLYT[13C6]LRa,b | 917.53 | 2 | 459.26 | 558.33 | 671.42 | 770.49 | |
| MVLYTLRa,b | 895.51 | 2 | 448.26 | 552.31 | 665.40 | 764.47 | |
| MVLYT[13C6]LRa,b | 901.53 | 2 | 451.27 | 558.33 | 671.42 | 770.49 | |
| EVATEGIRa,b | 874.47 | 2 | 437.74 | 474.27 | 575.31 | 646.35 | |
| EVATEG[13C6]IRa,b | 880.49 | 2 | 440.75 | 480.29 | 581.33 | 652.37 | |
| PSA | LSEPAELTDAVKa,b | 1272.68 | 2 | 636.84 | 775.42 | 846.46 | 943.51 |
| LSEPAELTDAV[13C6]Ka,b | 1278.70 | 2 | 639.85 | 781.44 | 852.48 | 949.53 | |
| IVGGWECamcEKa,b | 1077.51 | 2 | 539.26 | 808.33 | 865.35 | 964.42 | |
| IVGGWECamcE[13C6]Ka,b | 1083.53 | 2 | 542.27 | 814.35 | 871.37 | 970.44 | |
| sCD40L | SLSLLNCamcEEIKa,b | 1305.68 | 2 | 653.34 | 792.36 | 905.44 | 1105.56 |
| SLSLLNCamcEE[13C6]IKa,b | 1311.70 | 2 | 656.35 | 798.38 | 911.46 | 1111.58 | |
| SQFEGFVKa,b | 941.48 | 2 | 471.24 | 579.31 | 726.38 | 854.44 | |
| SQFEGF[13C6]VKa,b | 946.50 | 2 | 473.75 | 584.33 | 731.40 | 859.46 | |
| TTSVLQWAEKa,b | 1162.62 | 2 | 581.81 | 661.33 | 774.41 | 960.51 | |
| TTSV[13C6]LQWAEKa,b | 1168.64 | 2 | 584.82 | 661.33 | 780.43 | 966.54 | |
| EASSQAPFIASLCamcLKa,b | 1621.83 | 2 | 811.42 | 691.38 | 1048.59 | 1119.62 | |
| EASSQAPFIASLCamc[13C6]LKa,b | 1627.85 | 2 | 814.43 | 697.40 | 1054.61 | 1125.64 | |
| Tropomyosin 1 | QLEDELVSLQKa,b | 1301.69 | 2 | 651.35 | 687.44 | 816.48 | 931.51 |
| QLEDELVSLQ[13C615N2]Ka,b | 1309.71 | 2 | 655.36 | 695.45 | 824.5 | 939.52 | |
| LVIIESDLERa,b | 1186.67 | 2 | 593.84 | 748.35 | 861.43 | 974.52 | |
| LVIIESDLE[13C615N4]Ra,b | 1196.68 | 2 | 598.84 | 758.36 | 871.44 | 984.52 | |
| Troponin I | NIDALSGMEGRa,b | 1162.56 | 2 | 581.78 | 636.28 | 749.36 | 935.43 |
| NIDA[13C6]LSGMEGRa,b | 1168.58 | 2 | 584.79 | 636.28 | 755.38 | 941.45 | |
| TLLLQIAKa,b | 899.60 | 2 | 450.30 | 459.29 | 572.38 | 685.46 | |
| TLLLQIA[13C6]Ka,b | 905.62 | 2 | 453.31 | 465.31 | 578.40 | 691.48 | |
| NITEIADLTQKa,b | 1245.68 | 2 | 623.34 | 675.37 | 788.45 | 1018.54 | |
| NITEIADLTQ[13C6]Ka,b | 1251.70 | 2 | 626.35 | 681.39 | 794.47 | 1024.56 | |
| Troponin T | VLAIDHLNEDQLRa,b | 1535.82 | 3 | 512.61 | 662.34 | 718.88 | 774.37 |
| VLAIDHLNEDQ[13C6]LRa,b | 1541.84 | 3 | 514.62 | 665.35 | 721.89 | 780.39 | |
| YEINVLRa,b | 906.50 | 2 | 453.76 | 501.31 | 614.4 | 743.44 | |
| YEINV[13C6]LRa,b | 912.52 | 2 | 456.77 | 507.33 | 620.42 | 749.46 | |
Notes: Uniformly labeled amino acids are indicated in bold. Camc, carbamidomethyl cysteines; Mox, methionine sulfoxide.
a Peptides used in the main LOD/LOQ comparison and background studies.
b Peptides used in all of the chromatography optimization experiments.
An unscheduled MRM-MS method containing three transitions per peptide was used for the data acquisition with an average peak width of 35 s at baseline and a minimum number of points per peak of 20, resulting in dwell times of 12 ms. Peak area, height, and FWHM were calculated from the most abundant transition for each peptide using Skyline. The average peak area, height, and FWHM from triplicate analyses were used for the comparison of gradient lengths on the 30 cm/1.9 μm column. Peak capacity was calculated as described above using the 30 heavy synthetic peptides.
Evaluation of Loading Capacity and LOD/LOQ Using the 30 cm/1.9 μm Column
Five different response curve samples were prepared, each one in a different level of depleted, digested plasma background (1 μg/μl to 12 μg/μl). The plasma background amount and concentrations of the unlabeled peptides for each response curve are summarized in supplemental Table S3.
For each response curve, 41 unlabeled synthetic peptides (Table I) were spiked in at the highest concentration point (see supplemental Table S3, curve point 5), the corresponding 41 heavy labeled peptides were spiked in at 2 fmol/μl, and the sample was serially diluted with depleted, digested plasma at the appropriate concentration containing 2 fmol/μl labeled peptides. In picking the concentration points, we took into consideration the feasibility of detecting the peptides in the given background, as well as the consistency of the concentration points across the background range. Hence, we included higher concentration points for the 8 μg and 12 μg curves (0.16 fmol/μl and 0.24 fmol/μl). 1 μl of each of the samples was analyzed in triplicate using a 30 cm/1.9 μm column with a 180 min gradient described in the section on gradient optimization. Retention time scheduling with a retention time window of 8 min was used for the MRM-MS assay monitoring 246 total transitions at 3 transitions per peptide. The same scheduled method utilizing an average peak width at baseline of 35 ms and a setting of 20 points per peak resulted in nearly identical dwell times varying from 29 to 142 ms, depending on co-elution congestion.
Samples were run from the lowest to the highest concentration point for each plasma background level, and from the lowest to the highest background level. Buffer blank runs were done prior to any zero spike to confirm the absence of carryover. Data analysis was done using Skyline, and all statistical analyses such as LOD/LOQ calculation, reproducibility assessment, and flagging of interference were done using the QuaSAR software package.4 LODs/LOQs were calculated using a modified version of the Linnet method (3) and reported in units of fmol/μl peptide in the sample injected on column. The peptide concentration was converted to nanograms per milliliter of protein in plasma using the following formula: Protein concentration (ng/ml) = Peptide concentration (fm/μl) × molecular weight of the protein/1000.
In order to compare the LOD/LOQ values in different concentrations of depleted, digested plasma, the values were normalized to the starting depleted plasma concentration of 4.5 mg/ml by multiplying the LOD/LOQ values by the dilution factor of plasma. The following factors were used for the different concentrations of depleted plasma digest: 4.5 for 1 μg/μl, 2.23 for 2 μg/μl, 1.13 for 4 μg/μl, 0.56 for 8 μg/μl, and 0.38 for 12 μg/μl.
To assess whether the LOD/LOQ values in different amounts of background were significantly different, we performed a Wilcoxon rank sum test comparing the LOD/LOQ values in each background level with the LOD/LOQ values in the next higher background level.
Comparative Evaluation of LOD, LOQ, and CV on the 30 cm/1.9 μm Column versus the 12 cm/3 μm Column
Two response curve samples were prepared in depleted, digested plasma background using labeled and unlabeled versions of the same 41 peptides (Table I). Curve 1 was prepared in 1 μg/μl plasma background, and curve 2 was prepared in 4 μg/μl background. The nine-point response curve in both levels of background consisted of the points at 0, 0.01, 0.05, 0.1, 0.5, 2, 10, 100, and 500 fm/μl concentrations of unlabeled peptides with labeled peptides at a constant 2 fm/μl concentration. The curves were prepared as follows: 1 μg/μl and 4 μg/μl of plasma digest were spiked in with a mixture of unlabeled peptides at 500 fm/μl and corresponding labeled versions at 2 fm/μl followed by a serial dilution of these with 1 μg/μl and 4 μg/μl plasma digest containing only the labeled peptides at 2 fm/μl to yield the other curve points. 120 μl of each one of the first seven concentration points (0 to 10 fm/μl) of the response curve in 1 μg/μl plasma digest was used for fractionation by basic pH RP-HPLC. All concentration points in each response curve were frozen at −80 °C and thawed just prior to basic pH RP-HPLC fractionation or directly for MRM-MS analysis.
The basic pH RP-HPLC fractionation was performed on an Agilent 1100 system as follows: The column used was a 2.1 × 150 mm Zorbax 300 Extend (Agilent, Santa Clara, CA) operated at a flow rate of 200 μl/min. Buffers were (A) 20 mm ammonium formate pH 10/2% acetonitrile and (B) 20 mm ammonium formate pH 10/90% acetonitrile. The gradient included a 5 min isocratic hold at 0% B, 0.5%/min to 50% B (effective gradient), 25%/min to 100% B, a 2 min hold at 100% B, 1 min to return to initial conditions, two 20 min ramps from 0% to 100% to wash the column, and a 30 min re-equilibration segment. Fractions were collected each minute during the effective gradient and pooled into six fractions based on an equal distribution of the total peak area under the curve for the entire elution profile. After pooling into six fractions, each pool was acidified to 1% formic acid (v/v), frozen, and vacuum dried. Individual fractions were resuspended in 20 μl of 3% acetonitrile/0.1% formic acid, centrifuged for clarity, and analyzed via MRM-MS.
1 μl of each of the response curve samples was analyzed in triplicate. Samples in 1 μg/μl plasma digest background with and without fractionation were analyzed on the 12 cm/3 μm column at 25 °C using a 35 min gradient. The gradient started with a hold at 2.7% B for 5 min and proceeded with ramps to 9% B in 3 min, 45% B in 35 min (effective gradient), and 81% B in 2 min, followed by a hold at 81% B for 4 min. Samples in 4 μg/μl plasma digest without fractionation were analyzed on a 30 cm/1.9 μm column at 50 °C using the 180 min gradient described above.
Because a relatively large number of transitions (∼250) were monitored, retention time scheduling was used for both MRM-MS assays. There was an approximately 2-fold difference in the number of concurrent transitions between the 12 cm/3 μm and 30 cm/1.9 μm assays (supplemental Fig. S5). This directly translates into a 2-fold increase in the dwell time used for the 30 cm/1.9 μm assay relative to the 12 cm/3 μm assay. 4 min and 8 min retention time windows were used for the 12 cm/3 μm and 30 cm/1.9 μm assays, respectively. The larger retention time window for the 30 cm/1.9 μm assay was due to a larger observed shift, as had been expected for a longer, shallower gradient. The median retention time shift was 0.6 min for the 12 cm/3 μm assay and 3 min for the 30 cm/1.9 μm assay (supplemental Fig. S6). Interestingly, the shift of retention times on either column was uniform across the entire gradient for the 27 calibration curve runs. Converting the shift into percent solvent B per minute yielded very similar numbers (0.5 and 0.6) for both assays.
Data integration and statistical analysis were performed using Skyline and QuaSAR software. As described in the previous section, LOD/LOQ values were converted to protein concentrations (nanograms per milliliter) and normalized to the starting depleted plasma concentration using the same factors for 1 μg/μl and 4 μg/μl background.
Development and Evaluation of an 800-plex MRM-MS Experiment
400 isotopically labeled synthetic peptides along with 270 unlabeled versions were obtained from New England Peptide, prepared as two heavy labeled subset mixtures and a single unlabeled mixture in 20% acetonitrile/0.1% formic acid at an individual peptide concentration of 250 fmol/μl, and frozen as 10 μl aliquots. As needed, peptide pre-mixes were thawed, combined, and spiked in 1 μg/μl depleted, digested plasma to a final concentration of 50 fmol/μl. 1 μl full-loop injections of this sample in five technical replicates were performed on a 30 cm/1.9 μm column heated to 50 °C employing the same 180 min gradient. A single, scheduled MRM-MS method was developed using Skyline incorporating three transitions for both labeled and unlabeled peptides, resulting in 2400 total transitions. The scheduled window size was set at 8 min with an average peak width of 60 s and 20 points per peak. The resulting dwell times ranged from 8 to 107 ms. All other MS parameters were the same as described above. Data were compiled and interrogated in Skyline as described in previous sections. The data from five replicate injections were analyzed by AuDIT (12) to look for chromatographic imperfections and interference.
RESULTS
The overall goal of this study was to develop an MRM workflow that eliminated fractionation at the peptide level, thereby increasing sample analysis throughput and simplifying the LC-MRM-MS process without significant diminution of LOD, LOQ, or precision (measured by CV) relative to fMRM. We experimentally determined the optimal column length, gradient duration, and sample load for 0.75 μm inner diameter columns packed with 1.9 μm reversed-phase packing material. Using the optimized conditions, we then evaluated assay CV, LOD, and LOQ in the context of highly multiplexed MRM-MS plasma-based assays. Results obtained with these high-performance columns were compared with results obtained using our standard 12 cm-long columns packed with 3 μm material. Once values had been optimized, we evaluated the capabilities of the system for multiplexed, quantitative LC-MRM-MS of >400 peptides in a single analysis.
Effects of Column Length, Temperature, and Particle Size
The effects of column length and column temperature on peak width, peak capacity, and peak resolution were evaluated using 3 μm (our standard packing material) and 1.9 μm particle size Reprosil C18 beads in multiple column configurations (summarized in supplemental Table S1). All columns studied were PicoFrit 75 μm inner diameter fused silica (New Objective, Inc., Woburn, MA) packed in-house with these materials. The same flow rate (300 nl/min), mobile phase composition, and gradient duration (excluding re-equilibration time) were used for all column configurations. For each particle size of packing material, the effect on peak width and peak resolution was evaluated at three different column lengths (see “Experimental Procedures” for details). Columns packed with 3 μm material were run at both 25 °C and 50 °C, whereas columns packed with 1.9 μm material were evaluated at only 50 °C, with the exception of the shortest column, to prevent overpressuring of the HPLC systems at the lower column temperature (see “Experimental Procedures”).
The range and median values for FWHM of the most intense fragment ion for each of 20 peptides in a digested mixture of bovine proteins (supplemental Table S2) are shown in Fig. 1A. As expected, at similar column lengths columns packed with 1.9 μm beads consistently gave narrower peaks, and therefore achieved higher peak capacity, than the columns packed with 3 μm beads. Peak widths also generally decreased as the column temperature was raised and the column length was increased for both the 1.9 μm and 3 μm packed columns. The peak capacities of the 22 cm and 30 cm columns packed with 1.9 μm material were nearly double that of the standard 12 cm columns packed with 3 μm material (supplemental Table S1). It is important to note that we use peak capacity here only to compare the chromatographic performance of various systems, and not to maximize the achievable peak capacity for these columns, which requires additional experimental considerations (13–15).
Fig. 1.
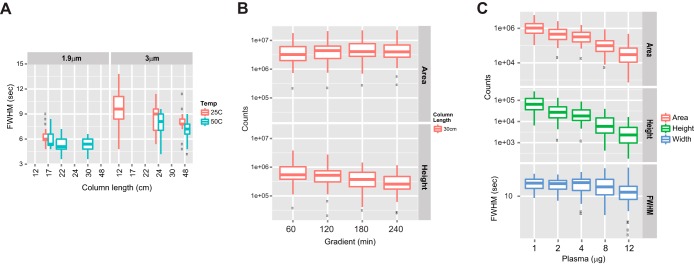
Evaluation and optimization of chromatographic parameters. A, median and distribution of full width at half-maximum (FWHM) of 20 peptides from bovine six-protein digest (Bruker-Michrom) on 75 μm inner diameter PicoFrit columns packed with 1.9 μm (left-hand panel) or 3 μm (right-hand panel) beads to various lengths and operated at either 25 °C or 50 °C with a fixed gradient slope. Samples (50 fmol injected on-column) were analyzed via LC-MRM-MS in triplicate. 20 peptides with five transitions each (supplemental Table S2) were included in the MRM method, and the most abundant transition for each peptide was used for peak width and resolution assessment of each column configuration. Not all combinations of length and particle dimension were evaluated. Points beyond the 1.5x interquartile range are marked as outliers. B, median and distribution of peak area and height of 30 synthetic peptides (Table I) on a 30 cm/1.9 μm column using gradients varying from 1 h to 4 h. C, median and distribution of peak area (top panel), height (middle panel), and FWHM (bottom panel) of the 30 synthetic peptides in various levels of depleted plasma background.
The effects of bead size and column length on peak resolution (see “Experimental Procedures”) were evaluated for the same series of column configurations using four pairs of closely eluting peptide peaks distributed across the elution profiles (supplemental Fig. S1). Resolution, calculated as described in “Experimental Procedures,” was improved 2.9- and 3.8-fold, respectively, for the 22 cm and 30 cm columns packed with 1.9 μm material relative to our standard configuration of 12 cm columns packed with 3 μm material. Column temperature had little effect on resolution. Based on the improved peak width, resolution, and peak capacity, the 30 cm/1.9 μm column operated at 50 °C was selected for further comparative evaluation with columns packed with 3 μm material.
Gradient Optimization
The next phase of our evaluation focused on optimizing the gradient slope for the 30 cm/1.9 μm/50 °C column configuration and comparing it to our standard approach using a 12 cm/3 μm/25 °C configuration with a 35 min gradient. It has been shown previously that long columns have a greater peak capacity when shallow gradients are used (16, 17). Therefore, we examined four different gradients, each ending at 31.5% acetonitrile, but with differing slopes: 0.42% B per minute (60 min gradient), 0.21% B per minute (120 min gradient), 0.14% B per minute (180 min gradient), and 0.11% B per minute (240 min gradient). Important factors that were considered included chromatographic peak statistics such as peak height, area, and width, as well as inject-to-inject time as an index of sample throughput capability. A mixture of 30 synthetic peptides spiked at 2 fmol/μl into 1 μg/μl depleted, digested human plasma was used for performance evaluations (Table I and “Experimental Procedures”). Three transitions were monitored for each peptide, and the most abundant transition (once established as free of interference) was used to obtain chromatographic peak statistics. The spread and median values observed for peak height and peak area (derived from the observed MS ion counts) of all 30 peptides using this range of gradients are shown in Fig. 1B. Peak areas and heights of the 30 peptides for all gradient lengths are shown in supplemental Fig. S2. Peak heights decreased gradually with concomitant increases in median peak widths as the gradient duration increased, resulting in relatively constant peak areas in the 2 to 4 h gradients. Interestingly, peak areas in the 2 to 4 h gradients were 24% to 37% greater than observed in the 1 h gradient, possibly because of decreased signal suppression (18). The peak capacity increased up to 50% as the gradient duration increased relative to 1 h (supplemental Fig. S2). Based on these observations and the practical need to balance peak capacity with analysis time, we selected the 180 min gradient for subsequent evaluation of the 30 cm/1.9 μm/50 °C column configuration.
Evaluation of Loading Capacity and LOD/LOQ Using the 30 cm/1.9 μm Column
Typically, 1 μg of protein digest is the maximum amount of sample loaded on standard 12 cm columns. In principle, the sensitivity for the detection of lower abundance analytes should increase as the amount of sample loaded on the column increases. To investigate the potential benefits of increased sample loading on the 30 cm/1.9 μm column and define the load for achieving optimal LOD/LOQ values, we analyzed five-point response curves in increasing amounts of depleted, digested plasma (1 μg/μl, 2 μg/μl, 4 μg/μl, 8 μg/μl, and 12 μg/μl) with 1 μl loaded on-column. 41 unlabeled peptides were spiked in at concentrations ranging from 0.01 fmol/μl to 0.24 fmol/μl, and heavy labeled internal standard peptides were spiked in at a constant concentration of 2 fmol/μl (Table I). A 3 h gradient and a scheduled MRM-MS method with retention time windows of 8 min were used for LC-MRM-MS analysis of the response curve samples.
The median and distribution of LOQ values (shown using box and whisker plots) for all 41 peptides and the subset of 31 peptides with sufficient signal in 8 μg background (more than 3000 counts for the heights of internal standard peptides) are plotted in Fig. 2. Values for LOQ take the dilution factor of the plasma into account, and the values are normalized to the starting post-depletion plasma concentration (4.5 μg/μl) (see “Experimental Procedures” for additional details). Significantly better LOQ values (p value of 0.03 for the 41 peptides) were obtained with 2 μg versus 1 μg on-column loading (median LOQ of 20.2 ng/ml in the 2 μg curve versus 28.7 ng/ml in the 1 μg curve) based on a Wilcoxon rank sum test (see “Experimental Procedures”). Although LOD and LOQ appeared visually improved at 4 μg versus 2 μg loading, the difference was not found to be statistically significant by the same tests. This suggests that the optimal column load for the 30 cm/1.9 μm assay is between 2 and 4 μg on-column. Although the distributions of LOQ values for the curves in 1 μg, 2 μg, and 4 μg background levels were similar, greater variance was observed at the 8 μg and 12 μg background levels (Fig. 2A) because of a subset of the peptides that had poor signal to noise in the higher backgrounds. When 10 peptides with poor signal to noise (less than 3000 counts for the heights of internal standard peptides) in the 8 μg curve were removed from the analyses, the distribution of LOQ values became much tighter and more similar to those for the 1, 2, and 4 μg load levels (Fig. 2B). The impact on signal with increasing background was also reflected in the median peak height and area of the spiked heavy peptides (Fig. 1D). Median peak heights and areas decreased by more than 50% when the depleted plasma background level was increased from 1 μg to 2 μg and continued to drop proportionally with increases in on-column sample load, despite the maintenance of a constant on-column amount of the internal standards.
Fig. 2.
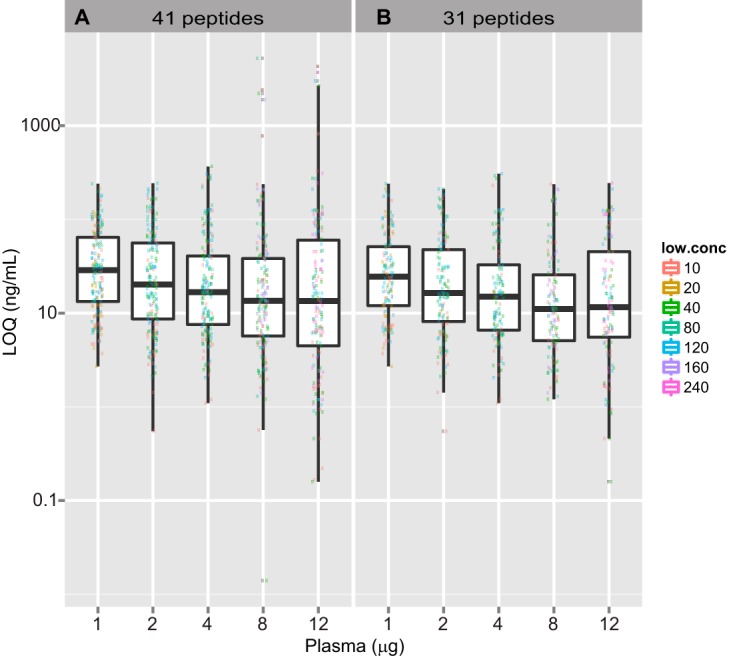
Median and distribution of LOQ values in varying levels of plasma background. Light peptides were spiked in from 10 am to 240 am concentrations and heavy peptides were spiked in at a constant concentration of 2 fm in plasma background ranging from 1 to 12 μg, and each concentration was analyzed on a 30 cm/1.9 μm column. Four LOQs were calculated for every peptide and curve, each time using the blank with a different low-concentration sample (shown with different colors on the plot). LOQ values were calculated as on-column femtomoles, which were then converted to nanograms per milliliter of protein in plasma and plotted against increasing levels of depleted plasma. LOQ values are plotted for all 41 peptides (A) and for the subset of 31 peptides (B) with good signal to noise for the heavy labeled internal standard peptides (at least 3000 counts) in 8 μg background.
To investigate whether the decrease in signal to noise with increasing load of plasma background was the result of ion suppression, we plotted average peak heights of the 14/41 light peptides that had good signal to noise in all five levels of background plasma (more than 3000 counts for the heights of internal standard peptides in 12 μg background) and no detectable endogenous levels (supplemental Fig. S3). Robust linear fit to the data resulted in a negative slope with a p value of 0.0084 indicative of some ion suppression with increasing levels of background plasma. The latter finding, along with the increased variability observed at the high levels of background plasma, suggested that loads of more than 4 μg of plasma are suboptimal. Weighing the relative benefits (e.g. improved LOQ) and drawbacks (increased variance and potential robustness issues), we chose a depleted plasma load level of 4 μg on 30 cm/1.9 μm columns and used this for all subsequent studies.
Comparative Evaluation of LOD, LOQ, and CV on the 30 cm/1.9 μm Column versus the 12 cm/3 μm Column
The LOD/LOQ values of the 41 synthetic peptides (Table I and “Experimental Procedures”) in depleted plasma were determined on a 30 cm/1.9 μm/50 °C column using the 180 min gradient and on a 12 cm/3 μm/25 °C column using a typical 35 min gradient with and without limited fractionation prior to LC-MRM-MS analysis (Fig. 3; supplemental Figs. S4–S6). The median LOQ values for the 41 peptides under these three conditions are shown in Fig. 4, and LOD/LOQ values for the best interference-free transition of each peptide are summarized in Table II. A median LOQ of 17.5 ng/ml (back-calculated to protein) was observed in the 1 μg curve on the 12 cm/3 μm column without fractionation. In contrast, the median LOQ observed for the 4 μg load on the 30 cm/1.9 μm column was 4.23 ng/ml. The 4-fold improvement in the median LOD/LOQ obtained with the 30 cm/1.9 μm column is directly proportional to the 4-fold greater load on this column versus the 12 cm/3 μm column. The observed spread of LOQ values was also narrower on the 30 cm/1.9 μm column than on the 12 cm/3 μm column (1 to 62 ng/ml versus 2 to 367 ng/ml). The median LOQ for peptides that had undergone limited fractionation by basic pH reverse phase prior to the analysis of 1 μg loadings on the 12 cm/3 μm column was 2.2 ng/ml with a range of 0.5 to 33 ng/ml. Although the LOD/LOQ by fMRM is 2-fold better relative to the 30 cm/1.9 μm configuration without fractionation, it comes at the expense of a 2.5-times longer data acquisition and at least a doubling of the data analysis time. Response curves for selected peptides under the varying conditions detailed above are shown in supplemental Fig. S7.
Fig. 3.
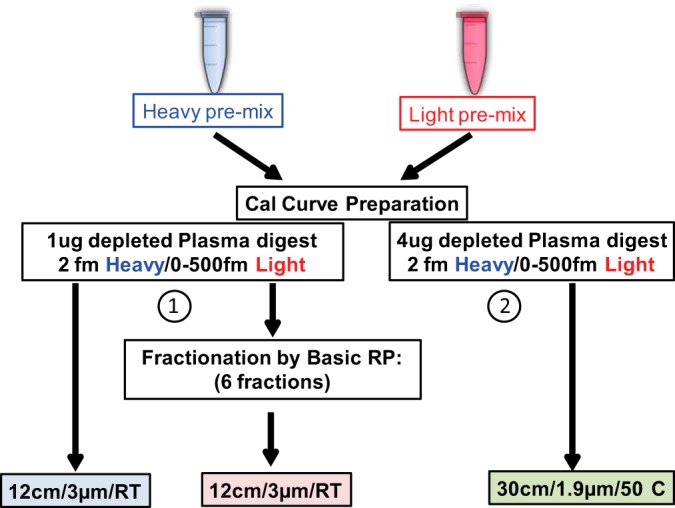
Experimental flow diagram of the LOD/LOQ study. Two response curves were generated by spiking 41 light peptides at varying concentrations and corresponding heavy labeled internal standard peptides at a constant concentration of 2 fm/μl into depleted, digested plasma. Response curve 1 was prepared by spiking unlabeled peptides at 0, 0.01, 0.05, 0.1, 0.5, 2, 10, 100, and 500 fm/μl and heavy peptides at the constant 2 fm/μl. This curve was directly analyzed by injecting 1 μl on the 12 cm/3 μm column using a 35 min effective gradient. In addition, an aliquot of each of the concentration points from 0 to 10 fm/μl was separated by means of basic pH reversed-phase chromatography, pooled into six fractions, and analyzed using the standard approach (supplemental Fig. S4). Curve 2 was prepared in 4 μg/μl digested, depleted plasma background spiked with unlabeled peptides at the same concentration points as noted above along with the heavy peptides at a constant concentration of 2 fm/μl. Each sample was analyzed in three technical replicates via LC-MRM-MS.
Fig. 4.
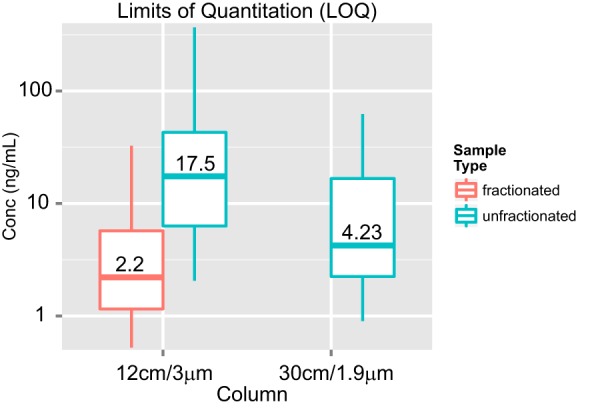
Median and distribution of LOQs of 41 peptides in 12 cm/3 μm and 30 cm/1.9 μm assays. Left: LOQ values are plotted for the best transition of peptides in 1 μg plasma background, with (red) and without (green) fractionation using LC-MRM-MS on the 12 cm/3 μm column. Right: LOQ values are plotted for the best transition of all peptides in 4 μg plasma background on the 30 cm/1.9 μm column. LOD/LOQ values for all peptides are reported in Table II. Peak area ratios of transitions for the light and heavy peptides were used to calculate the LOD and LOQ for each peptide and to assess reproducibility. Statistical analyses and generation of response curves were done using QuaSAR software developed at the Broad Institute.4 LOD/LOQ values were calculated using a modified version of the Linnet method (3) and are reported as femtomoles per microliter on-column. These values were then converted to nanograms per milliliter of the protein in depleted plasma as described in “Experimental Procedures.”
Table II. Limit of detection (LOD) and limit of quantitation (LOQ) values for all of the peptides in 1 μg nonfractionated, 1 μg fractionated, and 4 μg nonfractionated curves.
| Protein | Peptide | 1 μg unfractionated (12 cm/3 μm column) |
1 μg fractionated (12 cm/3 μm column) |
4 μg unfractionated (30 cm/1.9 μm column) |
|||
|---|---|---|---|---|---|---|---|
| LOD (ng/ml) | LOQ (ng/ml) | LOD (ng/ml) | LOQ (ng/ml) | LOD (ng/ml) | LOQ (ng/ml) | ||
| AEBP1 | DTPVLSELPEPVVAR | 78.19 | 234.56 | 4.03 | 12.10 | 15.49 | 46.47 |
| ILNPGEYR | 32.72 | 98.15 | 3.91 | 11.72 | 16.62 | 49.87 | |
| NPFVLGANLNGGER | 122.39 | 367.18 | 5.23 | 15.68 | 9.59 | 28.77 | |
| APR | AGLCQTFVYGGCR | 1.91 | 5.74 | 2.33 | 6.98 | 2.53 | 7.59 |
| BNP | ISSSSGLGCK | 0.68 | 2.05 | 0.24 | 0.72 | 0.63 | 1.89 |
| MVQGSGCFGR | 2.24 | 6.72 | 0.71 | 2.14 | 0.54 | 1.61 | |
| mVQGSGCFGR | 3.51 | 10.54 | 0.54 | 1.61 | 2.13 | 6.40 | |
| MYL3 | AAPAPAPPPEPERPK | 2.79 | 8.37 | 0.58 | 1.74 | 1.12 | 3.37 |
| ALGQNPTQAEVLR | 0.81 | 2.42 | 0.17 | 0.52 | 0.65 | 1.95 | |
| EVEFDASK | 51.65 | 154.96 | 10.88 | 32.63 | 1.09 | 3.26 | |
| HVLATLGER | 1.95 | 5.86 | 0.19 | 0.57 | 0.55 | 1.66 | |
| VVNEECPTITR | 1.62 | 4.87 | 0.39 | 1.16 | 1.03 | 3.10 | |
| HRP | DTIVNELR | 7.03 | 21.10 | 2.70 | 8.10 | 3.52 | 10.56 |
| IL-33 | DFWLHANNK | 33.34 | 100.01 | 4.48 | 13.43 | 12.73 | 38.18 |
| DNHLALIK | 10.67 | 32.02 | 1.41 | 4.23 | 2.97 | 8.92 | |
| TDPGVFIGVK | 12.61 | 37.84 | 0.65 | 1.96 | 5.85 | 17.55 | |
| LEP | INDISHTQSVSAK | 1.39 | 4.16 | 0.81 | 2.43 | 0.46 | 1.37 |
| MBP | YLASASTMDHAR | 6.17 | 18.52 | 0.58 | 1.75 | 0.63 | 1.88 |
| MPO | IANVFTNAFR | 14.28 | 42.85 | 2.46 | 7.37 | 13.09 | 39.26 |
| IPCFLAGDTR | 64.56 | 193.69 | 1.91 | 5.72 | 20.75 | 62.24 | |
| FHL1 | AIVAGDQNVEYK | 4.28 | 12.84 | 0.36 | 1.09 | 1.00 | 3.01 |
| DCFTCSNCK | 8.55 | 25.66 | 1.96 | 5.87 | 1.65 | 4.94 | |
| FCANTCVECR | 2.75 | 8.25 | 0.32 | 0.95 | 1.33 | 3.98 | |
| NPITGFGK | 6.47 | 19.42 | 1.39 | 4.18 | 5.55 | 16.66 | |
| NT-proBNP | EVATEGIR | 2.18 | 6.54 | 0.69 | 2.08 | 0.77 | 2.32 |
| MVLYTLR | 0.81 | 2.44 | 0.26 | 0.79 | 0.36 | 1.08 | |
| VLAIDHLNEDQLR | 1.76 | 5.29 | 0.22 | 0.67 | 0.45 | 1.34 | |
| mVLYTLR | 0.73 | 2.18 | 0.18 | 0.55 | 0.30 | 0.90 | |
| PSA | IVGGWECEK | 3.10 | 9.30 | 1.17 | 3.52 | 0.79 | 2.38 |
| LSEPAELTDAVK | 16.23 | 48.70 | 0.51 | 1.54 | 1.69 | 5.06 | |
| sCD40L | EASSQAPFIASLCLK | 16.40 | 49.21 | 1.21 | 3.62 | 1.41 | 4.23 |
| SLSLLNCEEIK | 12.89 | 38.66 | 0.74 | 2.21 | 1.23 | 3.68 | |
| SQFEGFVK | 7.03 | 21.08 | 0.91 | 2.73 | 6.16 | 18.47 | |
| TTSVLQWAEK | 5.82 | 17.46 | 0.95 | 2.84 | 5.38 | 16.15 | |
| TnI | NIDALSGMEGR | 5.83 | 17.49 | 0.72 | 2.15 | 2.85 | 8.56 |
| NITEIADLTQK | 1.02 | 3.05 | 0.40 | 1.21 | 2.11 | 6.34 | |
| TLLLQIAK | 2.90 | 8.70 | 0.19 | 0.57 | 0.46 | 1.39 | |
| TnT | YEINVLR | 2.10 | 6.31 | 0.99 | 2.96 | 0.75 | 2.25 |
| Tpm | LVIIESDLER | 3.73 | 11.20 | 0.22 | 0.67 | 1.05 | 3.14 |
| QLEDELVSLQK | 16.15 | 48.46 | 1.65 | 4.96 | 15.17 | 45.52 | |
| SIDDLEDELYAQK | 34.06 | 102.18 | 5.65 | 16.96 | 6.56 | 19.67 | |
The CV for three replicates was determined for both the 1 μg response curves (with and without fractionation) and the 4 μg response curve (supplemental Fig. S8). The two unfractionated curves have very similar variation with cv values predominantly less than 10%. At the first concentration point above LOQ (2 fmol), CV values of 3.6% and 6.2% were obtained for the 4 μg and 1 μg unfractionated assays, respectively. The nearly 2-fold better reproducibility observed near the LOQ for peptides in the 4 μg curve as compared with the 1 μg unfractionated curve is likely due to the lower noise level, and hence better signal to noise, obtained using the longer gradient. The median CV obtained at the same concentration point for peptides in the 1 μg fractionated curve was 3.3%, similar to that obtained in 4 μg unfractionated analyses.
Development and Evaluation of an 800-plex MRM-MS Experiment
The performance characteristics for the 30 cm/1.9 μm columns using gradients of 3 h duration suggested that much higher multiplex targeted analyses could be achieved than with the shorter columns with shorter gradients. To test this, we evaluated the ability to configure an 800-plex MRM assay in which 2400 transitions representing 400 unlabeled and 400 heavy labeled peptide pairs were monitored using retention time scheduling (Fig. 5). Digested, depleted plasma was spiked with 400 heavy labeled and 262 available corresponding unlabeled peptides at 50 fm/μl; the remaining 138 light peptides were monitored without spiked unlabeled peptides. An 8 min retention time window with an acquisition setting of 20 points per peak resulted in dwell times ranging from 8 to 107 ms, with 70% of the peptides having dwell times of more than 10 ms (supplemental Fig. S9). Five replicate injections were collected and the data were submitted for AuDIT analysis (12) to determine the failure rates of identification and quantification due to chromatographic imperfections and interference. 98% of the peptides (257 of 262 pairs of unlabeled and labeled peptides) passed the AuDIT analysis, demonstrating the feasibility of configuring such a highly multiplexed MRM-MS assay using long gradients on 30 cm/1.9 μm columns. In addition, the data were analyzed to determine the CV of peak areas of 400 heavy labeled peptides and the peak area ratio of the 262 light and heavy pairs. Excellent reproducibility was observed for the five replicates, with median percent CV values of 10.9% and 1.8% for the peak areas and peak area ratios, respectively.
Fig. 5.
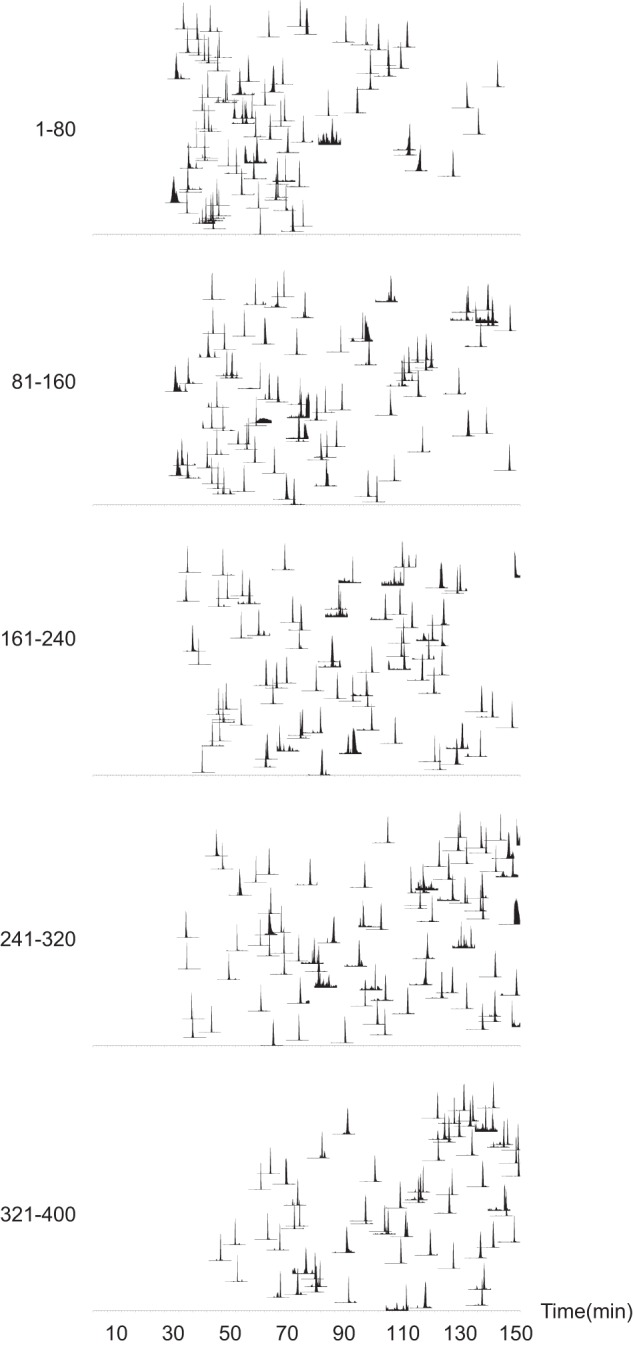
Extracted ion chromatograms (XICs) of all 800 peptides in an 800-plex MRM-MS assay. 400 pairs of heavy and light peptides were spiked in plasma and analyzed via 800-plex LC-MRM-MS assay. XICs are illustrated in batches of 80 peptides, and each XIC is composed of overlaid traces of six transitions (three for unlabeled and three for labeled).
DISCUSSION
Our goal in this study was to develop a simplified plasma processing workflow that improved the overall throughput relative to fMRM without sacrificing sensitivity, reproducibility, or robustness and would be applicable to any biomarker verification or targeted biological study for even very high multiplex levels (e.g. more than hundreds of target analytes). To accomplish this goal, we took advantage of recent advances in ultra-high-performance chromatography (10, 19) and explored the possibility of eliminating the need for first-dimensional separation through the use of such columns and gradients for on-line LC-MRM-MS. Systematic comparative evaluation of chromatographic and assay performance parameters for a number of separation formats demonstrated the marked benefits of long (30 cm), heated (50 °C) columns packed with 1.9 μm resin and longer gradients (3 h) for highly multiplexed LC-MRM-MS assays. Narrower peaks obtained on long columns packed with the 1.9 μm beads allowed the gradient to be lengthened while still maintaining peak widths less than 30 s. Lengthening of the gradient also reduced background complexity at any given elution point, better separating interferences from analytes. Although scheduled MRM-MS was used for both standard and long column configurations, the longer gradient reduced the number of concurrent transitions and increased the dwell time per transition. These factors, together with a tolerance for higher sample loading (see below), provided a 4-fold improvement in median LOQ values with increased assay precision relative to the standard 12 cm columns packed with 3 μm material. Shi et al. recently reported an evaluation of the benefits of long-column chromatography for targeted MS analyses (20). Our studies significantly extend that research by systematically evaluating the effects of column length, temperature, gradient duration, and sample load on peak shape, peak capacity, LOD, LOQ, assay precision, and overall robustness in the context of highly multiplexed, quantitative measurement of peptides in human plasma by MRM-MS. We also directly compared these results with what is achieved using fMRM. Using heated, fused silica columns of relatively modest length (30 cm) packed with 1.9 μm resin, we obtained an approximately 3-fold increase in sample analysis throughput without any significant loss of precision and with only a modest reduction in the sensitivity of the assays relative to fMRM using conventional nano-chromatography. Importantly, in our study we took advantage of the higher peak capacity of the system to develop an 800-plex MRM-MS assay, comprising 2400 transitions with retention time scheduling, that allowed us to monitor 400 unlabeled and heavy labeled peptide pairs in a single analysis. The development and application of this highly multiplexed, quantitative assay were only possible as a result of the use of the higher performance chromatography we describe.
The choice of a 30 cm column length, but not longer, was based on the joint objectives of maximizing peak capacity and peak resolution and avoiding back-pressures greater than 70% of the stated maximum for the NanoAccuity pump system used (10,000 psi). Although temperatures higher than 50 °C could potentially further improve chromatography, we chose not to evaluate this because of concerns about shortening the column lifespan. Our 30 cm/1.9 μm columns proved to be quite robust, tolerating at least 250 injections of depleted plasma at load levels up to 4 μg. The selection of a 3 h instead of a 4 h gradient was also driven by a pragmatic trade-off between the moderate gain (approximately 12%) in peak capacity versus the 25% increase in analysis duration resulting from use of the 4 h gradient.
The combination of smaller packing particle size, greater column length, and shallower, longer gradients also permitted larger sample loads to be injected. We evaluated load levels from 1 to 12 μg of depleted plasma digest. We observed a 4-fold improvement of LOD/LOQ loading 4 μg on 30 cm/1.9 μm columns with a 3 h gradient relative to results obtained with 1 μg loaded on our standard 12 cm column with 3 μm packing and a 35 min gradient. In addition to the higher effective sample concentration entering the MS, the improvement in LOD/LOQ is also due, in part, to an improved separation of interferences that allowed more frequent use of the most abundant transitions for calculations. Together these factors led to consistently lower LOD/LOQ values with a tight distribution on 30 cm/1.9 μm columns, similar to the distribution observed for fMRM on 12 cm/3 μm columns. We initially anticipated that loading even larger amounts on-column would further increase the detection of low-abundance peptides/proteins in complex samples. However, we found that as the amount of sample loaded on-column was increased beyond 4 μg, the LOD/LOQ values leveled off and in some cases declined. We propose that this is due to increased suppression from the higher matrix background. The median LOD/LOQ for 2 μg on-column loading was similar to that obtained with 4 μg loading. At the lower sample load levels, the columns will likely last longer and cause less contamination of the ion optics, albeit with some reduction in sensitivity for certain peptides.
Fractionation is widely used in proteomics to increase the depth of analysis by MS in highly complex biological or clinical samples. Previously we demonstrated the benefit of off-line sample fractionation by strong cation exchange or basic reversed-phase chromatography followed by on-line LC-MRM-MS of the resulting six to eight fractions for highly multiplexed, quantitative analysis of proteins in human plasma (2–4). Recently, Shi et al. described a refinement of the fMRM approach (including the use of antibody-based depletion of abundant plasma proteins) that can achieve higher detection sensitivity in plasma via MS-guided collection and analysis of very narrow fractions from a basic-RP separation (21). In order to analyze even modest numbers of analytes via this approach, fractions must be combined, resulting in decreased sensitivity. A major limitation of all fMRM approaches is the significant additional instrument time required for fractionation (approximately 5 to 6 h per sample in our previously described process) and data acquisition (8 to 11 h for three process replicates). Furthermore, analysis of fMRM data is significantly more time consuming and complex than analysis of non-fractionated MRM-MS data, with often twice as much time needed for analysis because of the need for greater manual inspection of the data. These factors reinforce the need for higher throughput, robust, sensitive methods for biomarker verification and biology focused perturbational studies that do not require laborious and inefficient fractionation (be it on-line or off-line). The method we describe here satisfies these criteria.
When additional sensitivity is required at very high multiplex, longer gradients on columns packed with beads less than 2 μm in size can, of course, also be combined with limited fractionation to improve signal to noise and thereby achieve a better LOD/LOQ. However, as noted above, this will come with the cost of much longer data acquisition and analysis times. For example, if data acquisition for a single sample with a 3 h gradient takes about 4 h, data acquisition for four or eight fractions with a 2 h gradient will take 12 h or 24 h, respectively.
Another significant benefit of the longer gradients on the 30 cm/1.9 μm columns is the decreased concurrency of peptides, potentially enabling very high levels of multiplex analysis, as shown in our multiplexed analysis of 800 peptides (2400 transitions) in one LC-MRM-MS experiment. To our knowledge this is the most highly multiplexed quantitative MRM-MS measurement yet reported. Similarly high levels of multiplexing might be possible with data independent acquisition methods with internal standards. Data independent acquisition has in recent years reemerged as an analytic technique as a result of faster, more sensitive MS systems, improved on-board computerized instrument control, and more sophisticated software for data acquisition and analysis (22, 23).
In conclusion, longer gradients on long (30 cm) columns packed with sub-2 μm beads provide reproducible, robust chromatography applicable to any large, highly multiplexed biomarker verification study. When this approach is coupled with MRM-MS, low nanogram-per-milliliter LOQs for proteins in depleted plasma are achieved when loading 2 to 4 μg on-column. Overall, the optimized chromatography provided an approximately 3-fold increase in analysis throughput with excellent robustness and less than a 2-fold reduction in quantitative sensitivity relative to fMRM.
Supplementary Material
Acknowledgments
We thank Dr. Jim Langridge of Waters (Manchester, UK) for generating Fig. 5 of the paper and for support throughout the study, as well as Dr. Martin Gilar of Waters (Milford, MA) for in-depth discussions about chromatography fundamentals and for insightful comments on the manuscript.
The original MRM-MS data, Skyline files and results obtained from QuaSAR analysis may be downloaded from: ftp://ftp.broadinstitute.org/distribution/proteomics/public_datasets/Burgess_MCP_2014/.
Footnotes
Author contributions: M.W.B., H.K., M.A.G., and S.A.C. designed research; M.W.B. and H.K. performed research; M.W.B., H.K., and D.M. analyzed data; M.W.B., H.K., and S.A.C. wrote the paper.
* This work was supported in part by grants from National Institutes of Health: Grant U24CA160034 from NCI Clinical Proteomics Tumor Analysis Consortium Initiative (to S.A.C.) and Grants HHSN268201000033C and R01HL096738 from NHLBI (to S.A.C.).
 This article contains supplemental material.
2 M. Burgess, H. Keshishian, M. A. Gillette, and S. A. Carr, “Quantification of Proteins at Sub-nanogram/mL Levels in Human Plasma without the Need for Fractionation or Antibodies.” Poster presented at the Human Proteome Organization (HUPO) 11th World Congress, Boston, MA (September 9–13, 2012).
3 M. Burgess, H. Keshishian, D. R. Mani, M. A. Gillette, and S. A. Carr, “Targeted Quantification of Proteins at Sub-nanogram/mL Levels in Human Plasma by MRM-MS without the Need for Fractionation.” Poster presented at the 61st Meeting of the American Society for Mass Spectrometry (ASMS), Minneapolis, MN (June 9–13, 2013).
4 http://genepatternbeta.broadinstitute.org/gp/pages/index.jsf and Mani, D. R., Abbatiello, S. E., Ahmad, R., and Carr, S. A. (2013) QuaSAR: A Comprehensive Pipeline for Quantitative and Statistical Analysis of Reaction Monitoring Results. 60th American Society for Mass Spectrometry (ASMS) Proceedings, Poster MP01, Minneapolis, MN, June 9–13, 2013.
1 The abbreviations used are:
- LC-MRM-MS
- liquid chromatography–multiple reaction monitoring mass spectrometry
- cv
- coefficient of variation
- LOQ
- limit of quantitation
- LOD
- limit of detection
- fMRM
- fraction–multiple reaction monitoring
- FWHM
- full width at half-maximum
- RP-HPLC
- Reversed phase-high performance liquid chromatography
- LC-MS/MS
- Liquid chromatography-mass spectrometry/mass spectrometry
- XIC
- Extracted Ion Chromatogram
- bRP
- basic pH reversed phase
- QuaSAR
- Quantitative and statistical analysis of reaction monitoring results
- AuDIT
- Automatic detection of inaccurate and imprecise transitions
- DIA
- Data independent acquisition
- UPLC
- Ultra high pressure liquid chromatography
- MW
- Molecular weight
- SID
- Stable isotope dilution.
REFERENCES
- 1. Gillette M. A., Carr S. A. (2012) Quantitative analysis of peptides and proteins in biomedicine by targeted mass spectrometry. Nat. Methods 10, 28–34 [DOI] [PMC free article] [PubMed] [Google Scholar]
- 2. Keshishian H., Addona T., Burgess M., Kuhn E., Carr S. A. (2007) Quantitative, multiplexed assays for low abundance proteins in plasma by targeted mass spectrometry and stable isotope dilution. Mol. Cell. Proteomics 6, 2212–2229 [DOI] [PMC free article] [PubMed] [Google Scholar]
- 3. Keshishian H., Addona T., Burgess M., Mani D. R., Shi X., Kuhn E., Sabatine M. S., Gerszten R. E., Carr S. A. (2009) Quantification of cardiovascular biomarkers in patient plasma by targeted mass spectrometry and stable isotope dilution. Mol. Cell. Proteomics 8, 2339–2349 [DOI] [PMC free article] [PubMed] [Google Scholar]
- 4. Addona T. A., Shi X., Keshishian H., Mani D. R., Burgess M., Gillette M. A., Clauser K. R., Shen D., Lewis G. D., Farrell L. A., Fifer M. A., Sabatine M. S., Gerszten R. E., Carr S. A. (2011) A pipeline that integrates the discovery and verification of plasma protein biomarkers reveals candidate markers for cardiovascular disease. Nat. Biotechnol. 29, 635–643 [DOI] [PMC free article] [PubMed] [Google Scholar]
- 5. Kuhn E., Addona T., Keshishian H., Burgess M., Mani D. R., Lee R. T., Sabatine M. S., Gerszten R. E., Carr S. A. (2009) Developing multiplexed assays for troponin I and interleukin-33 in plasma by peptide immunoaffinity enrichment and targeted mass spectrometry. Clin. Chem. 55, 1108–1117 [DOI] [PMC free article] [PubMed] [Google Scholar]
- 6. Kuhn E., Whiteaker J. R., Mani D. R., Jackson A. M., Zhao L., Pope M. E., Smith D., Rivera K. D., Anderson N. L., Skates S. J., Pearson T. W., Paulovich A. G., Carr S. A. (2012) Inter-laboratory evaluation of automated, multiplexed peptide immunoaffinity enrichment coupled to multiple reaction monitoring mass spectrometry for quantifying proteins in plasma. Mol. Cell. Proteomics 11(6):M111.013854. [DOI] [PMC free article] [PubMed] [Google Scholar]
- 7. Whiteaker J. R., Zhao L., Anderson L., Paulovich A. G. (2010) An automated and multiplexed method for high throughput peptide immunoaffinity enrichment and multiple reaction monitoring mass spectrometry-based quantification of protein biomarkers. Mol. Cell. Proteomics 9, 184–196 [DOI] [PMC free article] [PubMed] [Google Scholar]
- 8. Whiteaker J. R., Lin C., Kennedy J., Hou L., Trute M., Sokal I., Yan P., Schoenherr R. M., Zhao L., Voytovich U. J., Kelly-Spratt K. S., Krasnoselsky A., Gafken P. R., Hogan J. M., Jones L. A., Wang P., Amon L., Chodosh L. A., Nelson P. S., McIntosh M. W., Kemp C. J., Paulovich A. G. (2011) A targeted proteomics-based pipeline for verification of biomarkers in plasma. Nat. Biotechnol. 29, 625–634 [DOI] [PMC free article] [PubMed] [Google Scholar]
- 9. Whiteaker J. R., Paulovich A. G. (2011) Peptide immunoaffinity enrichment coupled with mass spectrometry for peptide and protein quantification. Clin. Lab. Med. 31, 385–396 [DOI] [PMC free article] [PubMed] [Google Scholar]
- 10. Thakur S. S., Geiger T., Chatterjee B., Bandilla P., Fröhlich F., Cox J., Mann M. (2011) Deep and highly sensitive proteome coverage by LC-MS/MS without prefractionation. Mol. Cell. Proteomics 9, 2529–2544 [DOI] [PMC free article] [PubMed] [Google Scholar]
- 11. MacLean B., Tomazela D. M., Shulman N., Chambers M., Finney G. L., Frewen B., Kern R., Tabb D. L., Liebler D. C., MacCoss M. J. (2010) Skyline: an open source document editor for creating and analyzing targeted proteomics experiments. Bioinformatics 26, 966–968 [DOI] [PMC free article] [PubMed] [Google Scholar]
- 12. Abbatiello S. E., Mani D. R., Keshishian H., Carr S. A. (2010) Automated detection of inaccurate and imprecise transitions in quantitative assays of peptides by multiple monitoring mass spectrometry. Clin. Chem. 56, 291–305 [DOI] [PMC free article] [PubMed] [Google Scholar]
- 13. Desmet G., Clicq D., Gzil P. (2005) Geometry-independent plate height representation methods for the direct comparison of the kinetic performance of LC supports with a different size of morphology. Anal. Chem. 77, 4058–4070 [DOI] [PubMed] [Google Scholar]
- 14. Broeckhoven K., Cabooter D., Lynen F., Sandra P., Desmet G. (2010) The kinetic plot method applied to gradient chromatography: theoretical framework and experimental validation. J. Chromatogr. A 1217, 2787–2795 [DOI] [PubMed] [Google Scholar]
- 15. Vaast A., Broeckhoven K., Dolman S., Gesmet G., Eeltink S. (2012) Comparison of the gradient kinetic performance of silica monolithic capillary columns with columns packed with 3mm porous and 2.7mm fused-core silica particles. J. Chromatogr. A 1228, 270–275 [DOI] [PubMed] [Google Scholar]
- 16. Gilar M., Daly A. E., Kele M., Neue U. D., Gebler J. C. (2004) Implications of column peak capacity on the separation of complex peptide mixtures in single- and two-dimensional high-performance liquid chromatography. J. Chromatogr. 1061, 183–192 [DOI] [PubMed] [Google Scholar]
- 17. Liu H., Finch J. W., Lavallee M. J., Collamati R. A., Benevides C. C., Gebler J. C. (2007) Effects of column length, particle size, gradient length and flow rate on peak capacity of nano-scale liquid chromatography for peptide separations. J. Chromatogr. 1147, 30–36 [DOI] [PubMed] [Google Scholar]
- 18. Hsieh E. J., Bereman M. S., Durand S., Valaskovic G. A., MacCoss M. J. (2012) Effects of column and gradient lengths on peak capacity and peptide identification in nanoflow LC-MS/MS of complex proteomic samples. J. Am. Soc. Mass Spectrom. 24, 148–153 [DOI] [PMC free article] [PubMed] [Google Scholar]
- 19. Nagaraj N., Kulak N. A., Cox J., Neuhauser N., Mayr K., Hoerning O., Vorm O., Mann M. (2012) System-wide perturbation analysis with nearly complete coverage of the yeast proteome by single-shot ultra HPLC runs on a bench top Orbitrap. Mol. Cell. Proteomics 11(3):M111.013722. [DOI] [PMC free article] [PubMed] [Google Scholar]
- 20. Shi T., Fillmore T. L., Gao Y., Zhao R., He J., Schepmoes A. A., Nicora C. D., Wu C., Chambers J. L., Moore R. J., Kagan J., Srivastava S., Liu A. Y., Rodland K. D., Liu T., Camp D. G., Smith R. D., Qian W. J. (2013) Long-gradient separations coupled with selected reaction monitoring for highly sensitive, large scale targeted protein quantification in a single analysis. Anal. Chem. 85(19):9196–203 [DOI] [PMC free article] [PubMed] [Google Scholar]
- 21. Shi T., Fillmore T. L., Sun X., Zhao R., Schepmoes A. A., Hossain M., Xie F., Wu S., Kim J. S., Jones N., Moore R. J., Pasa-Tolic L., Kagan J., Rodland K. D., Liu T., Tang K., Camp D. G., 2nd, Smith R. D., Qian W. J. (2012) Antibody-free, targeted mass-spectrometric approach for quantification of proteins at low picogram per milliliter levels in human plasma/serum. Proc. Natl. Acad. Sci. U.S.A. 109, 15395–15400 [DOI] [PMC free article] [PubMed] [Google Scholar]
- 22. Liu Y., Huttenhain R., Surinova S., Gillet L. C. J., Mouritsen J., Brunner R., Navarro P., Aebersold R. (2013) Quantitative measurements of N-linked glycoproteins in human plasma by SWATH-MS. Proteomics 13, 1247–1256 [DOI] [PubMed] [Google Scholar]
- 23. Egertson J. E., Kuhn A., Merrihew G. E., Bateman N. W., MacLean B. X., Ting Y. S., Canterbury J. D., Marsh D. M., Kellmann M., Zabrouskov V., Wu C. C., MacCoss M. J. (2013) Multiplexed MS/MS for improved data-independent acquisition. Nat. Methods 10, 744–747 [DOI] [PMC free article] [PubMed] [Google Scholar]
Associated Data
This section collects any data citations, data availability statements, or supplementary materials included in this article.