

Abstract
The envisioned clinical and industrial use of human pluripotent stem cells and their derivatives has given major momentum to the establishment of suspension culture protocols that enable the mass production of cells. Understanding molecular changes accompanying the transfer from adherent to suspension culture is of utmost importance because this information can have a direct effect on the development of optimized culture conditions. In this study we assessed the gene expression of human embryonic stem cells and induced pluripotent stem cells grown in surface-adherent culture (two-dimensional) versus free-floating suspension culture spheroids (three-dimensional). We combined a quantitative proteomic approach based on stable isotope labeling by amino acids in cell culture with deep-sequencing-based transcriptomics. Cells in three-dimensional culture showed reduced expression of proteins forming structural components of cell–cell and cell–extracellular matrix junctions. However, fully unexpected, we found up-regulation of secreted inhibitors of the canonical Wnt signaling pathway and, concomitantly, a reduction in the level of active β-catenin and in the expression of Wnt target genes. In Western blot analyses the cysteine protease calpain was shown to cleave E-cadherin and β-catenin under three-dimensional culture conditions. Our data allowed the development of a model in which calpain cleavage of E-cadherin induces the disintegration of focal cell contacts and generates a 100-kDa E-cadherin fragment required for the formation of three-dimensional cell–cell contacts in spheroids. The parallel release of β-catenin and its potential activation by calpain cleavage are counterbalanced by the overexpression of soluble Wnt pathway inhibitors. According to this model, calpain has a key function in the interplay between E-cadherin and β-catenin-mediated intercellular adhesion and the canonical Wnt signaling pathway. Supporting this model, we show that pharmacological modulation of calpain activity prevents spheroid formation and causes disassembly of preexisting spheroids into single cells, thereby providing novel strategies for improving suspension culture conditions for human pluripotent stem cells in the future.
Human embryonic and induced pluripotent stem cells (hESCs and hiPSCs, respectively)1 hold the potential for indefinite self-renewal and differentiation into all somatic cell types (1, 2). Beyond their application as models for studying mechanisms of pluripotency, these cells have been considered as a potent source for cell therapies and in vitro assays in pharmacology and toxicology, raising the need for large-scale cell production under defined conditions (3). Conventional, surface adherent, two-dimensional culture is not suited to generate billions of human pluripotent stem cells (hPSCs) and their respective progenies required for clinical applications (3). To overcome these limits, three-dimensional culture protocols have been developed, wherein hPSCs are grown as aggregates or multicellular spheroids (MCSs) in suspension (4–9). More recently, suspension culture has been adapted to larger dimensions in bioreactors (5, 10–12), allowing the mass production of pluripotent stem cells under more defined conditions. Published suspension culture approaches differ in several aspects such as cell dissociation and inoculation protocols, feeding strategies, and culture media composition. However, the most commonly used culture media comprise mTeSRTM1 (5, 9, 12) or mouse embryonic fibroblast–conditioned medium (MEF-CM) (6, 10) and usually include supplementation of the Rho-associated coiled-coil kinase inhibitor Y27632 (RI), which supports the survival of hPSCs after their dissociation into single cells (13).
Because the culture of MCSs in suspension might affect key features of hPSCs including their physiology, pluripotency, and differentiation potential, a detailed comparison of cells grown in a conventional monolayer (two-dimensional) and in suspension culture (three-dimensional) is of utmost importance, in particular because the multicellular spheroids that form under three-dimensional conditions are more similar to tissues in terms of structural and functional properties and can give rise to direct organogenesis (14). MCSs are known to create a unique extracellular microenvironment through the accumulation of morphogens or the formation of morphogen gradients (or both), and their development and maintenance involves cell–extracellular matrix and cell–cell interactions (15–17). It has been demonstrated in several cell systems, including mouse embryonic stem cells (18) and human breast cancer cell lines (19), that E-cadherin (CDH1) is of central importance for MCS formation. In MCSs derived from hepatoma cells, for example, it was shown that up-regulation of E-cadherin increases homophilic E-cadherin interactions between neighboring cells that are connected by adherens junctions (20). Because E-cadherin interacts with β-catenin, a key component of the canonical Wnt pathway (21), it is also directly interwoven with Wnt signaling. Recently it was shown that up-regulation of E-cadherin causes the inhibition of Wnt signaling in a microwell-based three-dimensional culture system of hESCs. In that study the E-cadherin effect was attributed to the scavenging of β-catenin at adherens junctions (22).
This observation (i.e. that two-dimensional versus three-dimensional culture of hPSCs might influence cell signaling) underscores the need for a detailed characterization of molecular alterations associated with switching culture conditions. Several studies have already focused on the identification of proteomic or transcriptomic changes associated with MCS formation of tumor cells (23–25) and during the early differentiation of hPSCs, a step associated with the transition from adherent hPSC cultures to embryoid-body-induced differentiation (26–28). In contrast, very little information is available on the molecular changes that accompany the transition from adherently growing hPSCs to suspension culture spheroids while pluripotency is maintained.
To fill this gap, we combined deep-sequencing-based transcriptomics with in-depth quantitative proteomics to compare hPSCs grown either adherently or as free-floating spheroids. Our results provide novel molecular signatures of hPSCs grown as MCSs in suspension culture and aid in (i) the basic understanding of mechanisms governing cell–cell interaction and spheroid formation of hPSCs and (ii) refining large-scale culture protocols, which are indispensable for the routine, automated mass production of hPSCs and their progeny.
EXPERIMENTAL PROCEDURES
Culture of hPSCs
Tissue culture reagents were purchased from Invitrogen (Carlsbad, CA) unless otherwise stated. All cells were maintained at 37 °C, 5% CO2, and 85% relative humidity. hESCs (ES03, ES Cell International, National Stem Cell Bank Wisconsin, Madison, WI) or hiPSCs (hCBiPSC2, human-cord-blood-derived induced pluripotent stem cell clone 2, reprogrammed from cord-blood-derived endothelial cells, LEBAO, MHH) (29) were routinely cultured as colonies in six-well plates (Greiner Bio-One, Frickenhausen, Germany) on γ-irradiated (3000 cGy) human fibroblasts (CCD919, ATCC, Manassas, VA), in the following referred to as feeder cells. Feeder cells were seeded at 2.5 × 10⁴ cells cm−2 in wells coated with 0.1% (w/v) gelatin (Sigma-Aldrich, St. Louis, MO) in feeder medium consisting of high-glucose DMEM, 10% (v/v) FCS, 1% (v/v) minimum Eagle's medium (MEM) Non-Essential Amino Acids, and 1% (v/v) GlutaMAXTM. After the feeder cells had been allowed to attach for 24 h, cells were washed and stem cells were seeded on top of the feeder cells in stem cell medium. The stem cell medium comprised KnockOutTM DMEM supplemented with 20% (v/v) KnockOutTM Serum Replacement, 1% (v/v) MEM Non-Essential Amino Acids, 0.5% (v/v) GlutaMAXTM, 0.1 mm 2-mercaptoethanol, and 50 ng/ml or 10 ng/ml bFGF (Institute of Technical Chemistry, Leibniz University Hannover, Hannover, Germany) for hESCs or hiPSCs, respectively. For passaging, hPSCs were detached from feeder cells by incubation with 0.2% (w/v) collagenase IV solution for 10 min at 37 °C and subsequently transferred to a new well of feeder cells. Culture under feeder-free conditions of hPSCs was conducted either in MEF-CM, generated as described below, or, for controls, in mTeSRTM1 medium (StemCell Technologies, Grenoble, France) in T25 cell culture flasks (Greiner) that were coated with 2 ml of a 1:60 dilution of MatrigelTM matrix (BD Biosciences, Bedford, MA) for at least 1 h at 37 °C. Cells were incubated for 7 min at 37 °C with 1 mg/ml (w/v) Dispase (StemCell Technologies) before passaging and subsequently transferred in new MatrigelTM coated flasks. hPSCs grown under feeder-free conditions intended for experiments were cultured for at least three to five passages feeder-free to allow proper adaptation. For the generation of MEF-CM, confluent MEFs having undergone three to five passages (EmbryoMax® PMEF-P3, strain CF-1, untreated, Millipore, Billerica, MA) were γ-irradiated (3000 cGy) and seeded at 6 × 10⁴ cells cm−2 on gelatin-coated flasks in feeder medium. After the cells had been allowed to attach for 24 h, medium was replaced by 0.5 ml/cm2 medium comprising DMEM-F12 with stable glutamine (Biochrom, Berlin, Germany), 15% (v/v) KnockOutTM Serum Replacement, 1% (v/v) MEM Non-Essential Amino Acids, 0.1 mm 2-mercaptoethanol, and 4 ng/ml bFGF. The medium was conditioned for 24 h, filter sterilized, and supplemented with an additional 4 ng/ml bFGF. Conditioned medium was harvested for seven consecutive days and stored at −20 °C. Suspension culture was conducted essentially as described by Zweigerdt et al. (9). Suspension cultures were inoculated with hPSCs grown feeder-free in either MEF-CM or mTeSRTM1. Unlike in the procedure described by Zweigerdt et al., the dissociation of colonies grown on MatrigelTM into single cells was achieved via incubation with 0.5 mm EDTA in PBS (Versene) for 7 min at 37 °C. Subsequently, 2.5 × 10⁵ cells were seeded in 3 ml of MEF-CM or mTeSRTM1 medium supplemented with 10 mm RI (Institute of Technical Chemistry, Leibniz University Hannover) per well of an ultralow attachment six-well plate (Corning, Tewksbury, MA) and cultured for 4 days. Adherent culture conditions are referred to as two-dimensional, and suspension culture as three-dimensional.
SILAC of hPSCs
To keep our study as similar as possible to established hPSC culture conditions, we decided to avoid using novel media recipes developed for SILAC (30, 31) and dialyzation of the medium (32). Instead we exchanged the DMEM components of the stem cell media for a DMEM without lysine and arginine that was supplemented with the respective Lys and Arg isotopologues (33, 34). For SILAC, hPSCs were cultured for at least six passages on feeder cells in SILAC stem cell medium. In SILAC stem cell medium, the KnockOutTM DMEM component of the stem cell medium described above was exchanged for DMEM-F12 for SILAC (Thermo Fisher Scientific, Waltham, MA) supplemented with 7 × 10⁻⁴ mol/l of the respective Arg isotopologue (Arg-6 = l-[13C6] Arg-HCl, referred to as “medium” Arg, or Arg-10 = l-[13C615N4] Arg-HCl, referred to as “heavy” Arg) and 5 × 10⁻⁴ mol/l of the respective Lys isotopologue (Lys-4 = l-[2H4] Lys-HCl, referred to as medium Lys, or Lys-8 = l-[13C615N2] Lys-HCl, referred to as heavy Lys), obtained from Silantes (München, Germany). Subsequently, the stem cells were cultured for an additional three to five passages in SILAC MEF-CM supplemented with 10 μm RI under feeder-free conditions as adherent cells on MatrigelTM (two-dimensional). For the generation of SILAC MEF-CM, the DMEM-12 component of normal MEF-CM was exchanged for DMEM-F12 for SILAC supplemented with 7 × 10⁻⁴ mol/l of the respective Arg isotopologue (Arg-0, Arg-6, or Arg-10) and 5 × 10⁻⁴ mol/l of the respective Lys isotopologue (Lys-0, Lys-4, or Lys-8). Unlabeled Arg and Lys (Arg-0, referred to as light Arg, and Lys-0, referred to as light Lys) were purchased from Sigma Aldrich. Accordingly, suspension cultures (three-dimensional) of hPSCs were performed in SILAC MEF-CM supplemented with 10 μm RI (as described above). The SILAC media for feeder-based culture and MEF-CM contained 20% and 15% KnockOutTM Serum Replacement, respectively, thus contributing 800 and 600 mg/ml l-proline and thereby excluding the problematic conversions of isotope-coded arginine to proline (33). hPSCs grown two- or three-dimensionally in SILAC MEF-CM supplemented with 10 μm RI were collected (adherent cells were released via incubation with Versene) and pelleted by means of centrifugation at 300 × g for 3 min. The cell pellet was washed with PBS. For proteomics, the cell pellet was frozen at −80 °C; for transcriptomics, the cell pellet was immediately dissolved in TRIzol® reagent (Invitrogen) and frozen at −80 °C (Fig. 1).
Fig. 1.

Experimental workflow. A, schematic of cell culture. hESCs or hiPSCs were routinely cultured on human feeder cells. The standard medium was exchanged for a SILAC medium to facilitate labeling of the cells within a few passages. Subsequently the labeled cells were transferred to MatrigelTM and cultured in SILAC MEF-CM containing the Rho kinase inhibitor Y27632, enabling the growth of singularized cells as an adherent monolayer (2D). Suspension cultures (3D) were inoculated from these cells and incubated for 4 days. Cells were harvested (indicated by “h”) via centrifugation, and cell pellets were either frozen at −80 °C for subsequent proteomics (B) or suspended in TRIzol® and then frozen at −80 °C for subsequent transcriptomics. B, sample preparation for SILAC-based proteomics. 50 μg of a light, a medium, and a heavy labeled sample (as indicated) was pooled and separated via SDS-PAGE on 10% gels. Each lane was cut into six fragments (as indicated) and measured upon tryptic digestion by LC-MS/MS. Mass spectrometric raw data were analyzed with MaxQuant (v1.2.2.5).
Differentiation of SILAC-labeled hPSCs
Cardiomyogenic differentiation from monolayers of pluripotent stem cells was performed essentially as described by Lian et al. (35). Briefly, SILAC-labeled hESCs or hiPSCs were singularized via incubation with TrypLE™ Select for 5 min, pelleted by centrifugation at 250 × g for 5 min, and seeded at a cell density of 105 cells/cm2 on a 12-well plate (Greiner Bio-One) in SILAC MEF-CM supplemented with 5 μm RI (day −4). On day −2, the medium was changed to SILAC MEF-CM without RI. On day 0, when cells were confluent, the medium was replaced by RPMI/B27 medium without insulin consisting of RPMI 1640 including GlutaMAXTM and 2% (v/v) B-27® Supplement without insulin supplemented with the small molecule CHIR99021 (Selleckchem, Houston, TX) in final concentrations of 8 μm for hiPSCs and 20 μm for hESCs. The cells were cultivated for 24 h in the presence of CHIR99021. Then the medium was changed to RPMI/B27 without insulin (day 1). On day 3, 5 μm IWP-4 (Stemgent®, Cambridge, MA) in RPMI/B27 without insulin was added, and it was removed on day 5. On day 7, the medium was replaced by RPMI 1640 with 2% (v/v) B-27® Supplement with insulin. Spontaneously contracting areas could be observed from day 10 onward. For immunofluorescence microscopy of cardiomyocytes, cells were detached and singularized via incubation with TrypLETM Select for 5 min at 37 °C, pelleted by centrifugation for 5 min at 250 × g, and reseeded at a cell density of 2.5 × 10⁴ cells on 3.5-cm dishes coated overnight with fibronectin (Biochrom, 0.1 mg/ml in PBS) in single cell medium consisting of DMEM, 20% (v/v) KnockOut™ Serum Replacement, 1% (v/v) MEM Non-Essential Amino Acids, 1% (v/v) GlutaMAXTM, 0.1 mm 2-mercaptoethanol, 1% (v/v) penicillin-streptomycin (Sigma-Aldrich), and 5 μm RI. For immunofluorescence microscopy, cells were allowed to attach for 24 h and then were fixed and stained against the cardiomyocyte marker α-actinin.
For differentiation of hPSCs toward early neuroectoderm, SILAC-labeled hPSCs were singularized with TrypLE™ Select and seeded on MatrigelTM-coated 3.5-cm dishes in SILAC MEF-CM with 5 μm RI at a density of 105 cells/cm2. Cells were allowed to attach for 24 h, and then serum-free differentiation medium (36) consisting of DMEM supplemented with 1% (v/v) MEM Non-Essential Amino Acids, 1% (v/v) GlutaMAXTM, 0.1 mm 2-mercaptoethanol, and 1% (v/v) insulin-transferrin-selenium was added. The medium was changed once on day 2. On day 4 of differentiation, cells were fixed and stained against the neuroectodermal cell surface markers polysialic acid and neural cell adhesion molecule.
For the derivation of cells committed to the mesendodermal lineage, hESCs or hiPSCs were seeded as single cells on MatrigelTM as described for the neuroectodermal differentiation. Cells were allowed to grow to 100% confluence, and then endoderm-differentiation medium (37) (RPMI 1640 containing GlutaMAXTM, 5% (v/v) KnockOut™ Serum Replacement, and 100 ng/ml activin A (R&D Systems, Minneapolis, MN)) was added (day 0). On day 1 and day 2 the medium was supplemented with 0.1% (v/v) and 1% (v/v) insulin-transferrin-selenium, respectively. Cells were fixed and stained against the mesodermal/endodermal marker islet-1 (38).
SILAC Sample Preparation for MS
For cell lysis, 1 ml of RIPA buffer was used to lyse 5 × 10⁶ SILAC-labeled cells grown under either two-dimensional or three-dimensional conditions. RIPA buffer comprised 50 mm Tris-HCl, pH 8, with 150 mm NaCl, 1% (v/v) Nonidet P-40 (Roche), 0.5% (w/v) sodium deoxycholate (Sigma-Aldrich), and 1% (w/v) sodium dodecyl sulfate (SDS) (Serva, Heidelberg, Germany) supplemented with HALT protease inhibitor (Thermo Fisher Scientific). Cell lysis was supported by two steps of sonification in a cup horn for 1 min using a Branson Sonifier 450 with settings for duty cycle at 50% and output control at 5. Cell debris was removed by centrifugation for 15 min at 13,000 × g and 4 °C. The protein concentration of the supernatants was determined using Pierce 660 nm protein assay reagent (Thermo Fisher Scientific). Cell lysates corresponding to 50 μg of protein each from cells labeled with light, medium, and heavy SILAC were pooled and precipitated by the addition of at least a 4-fold volume of −20 °C cold acetone overnight at −20 °C. The protein was pelleted by centrifugation at 13,000 × g for 15 min at 4 °C. Each sample pool containing 150 μg of protein was dissolved in 30 μl of Laemmli buffer (35 mm Tris-HCl pH 6.8, 2.8% (w/v) SDS, 7% (v/v) glycerol, and 0.005% (w/v) bromphenol blue) and incubated for 5 min at 95 °C. The three different SILAC samples (light, medium, and heavy) were combined so as to ensure maximal diversity per pool, with the consequence that both cell types (hESCs and hiPSCs) and both culture conditions (two-dimensional and three-dimensional) were present in each sample pool. Proteins were separated via SDS-PAGE using 10% gels and subsequently stained with Roti®-Blue (Roth, Karlsruhe, Germany). Each lane was cut into six slices that were cut into small pieces of about 1 mm3 (Fig. 1). These were destained with 25% methanol and subjected to in-gel digestion with trypsin according to the method described by Shevchenko et al. (39). Briefly, the gel pieces were dehydrated with acetonitrile (ACN) (Merck) and then treated first with 10 mm DTT (Sigma) in 100 mm ammonium bicarbonate buffer (Sigma-Aldrich) and subsequently with 100 mm iodoacetamide (Sigma-Aldrich) in 100 mm ammonium bicarbonate buffer. After a repeated dehydration with ACN and rehydration with ammonium bicarbonate buffer, the dehydrated gel pieces were rehydrated with 50 mm ammonium bicarbonate buffer containing 20 ng/μl sequencing-grade trypsin (Promega, Mannheim, Germany) and incubated for 12 to 16 h at 37 °C. Peptides were extracted in three steps, first using 50% (v/v) ACN containing 5% (v/v) formic acid (Sigma), then with 75% ACN containing 0.5% formic acid, and finally with pure ACN. The extracted peptides were dried in a vacuum centrifuge, dissolved in 30 μl of 2% (v/v) ACN containing 0.1% (v/v) TFA (Sigma-Aldrich) with shaking for 20 min, and then centrifuged at 13,000 × g for 5 min. The supernatant was subjected to LC-MS/MS analysis.
LC-MS/MS and Automated MS Data Analysis
These analyses were performed as described previously (40). Reversed-phase chromatography of peptide samples was conducted with a nano-flow ultra-high-pressure liquid chromatography system (RSLC, Thermo Fisher Scientific). Peptides were trapped on a trapping column (3-μm C18 particle, 2-cm length, 75-μm inner diameter, Acclaim PepMap, Thermo Fisher Scientific) and subsequently separated on a 50-cm-long reversed-phase separating column (2-μm C18 particle, 75-μm inner diameter, Acclaim PepMap, Thermo Fisher Scientific). Peptide injection, enrichment, and desalting on the trapping column were conducted at a flow rate of 6 μl/min with 0.1% TFA for 5 min. Then the trapping column was switched online with the separating column and peptides were eluted with a multi-step binary gradient: linear gradient of buffer B (80% ACN, 0.1% formic acid) in buffer A (0.1% formic acid) from 4% to 25% in 115 min, 25% to 50% in 25 min, 50% to 90% in 5 min, and 90% B for 10 min. The column was reconditioned to 4% B in 30 min. The flow rate was 250 nl/min, and the column temperature was set at 45 °C. The RSLC system was coupled online via a Nano Spray Flex Ion Source II (Thermo Fisher Scientific) to an LTQ-Orbitrap Velos mass spectrometer (Thermo Fisher Scientific). Metal-coated fused-silica emitters (SilicaTip, 20-μm inner diameter, 10-μm tip inner diameter, New Objectives, Woburn, MA) and a voltage of 1.2 kV were used for the electrospray. Overview scans were acquired at a resolution of 60,000 at m/z 400 in the mass range of m/z 300–1600 in the Orbitrap analyzer and stored in profile mode. The 10 ions with charges of 2 or 3 with the highest intensities and a minimum intensity of 2000 counts were selected for collision-induced dissociation fragmentation with a normalized collision energy of 38.0, an activation time of 10 ms, and an activation Q of 0.250 in the LTQ. Fragment ion mass spectra were recorded in the LTQ at a normal scan rate and stored as centroid m/z value and intensity pairs. Active exclusion was activated so that ions fragmented once were excluded from further fragmentation for 70 s within a mass window of 10 ppm of the specific m/z value. Raw data were processed with the MaxQuant proteomics software suite (41), version 1.2.2.5, for identification and quantification of proteins. The derived peak lists were searched using the implemented Andromeda (42) search engine (v1.1.0.36) against the human International Protein Index protein sequence database (ipi.HUMAN.v3.68; 87,083 entries) at a false discovery rate of 1% at both protein and peptide levels. One missed cleavage of trypsin (cleavage C-terminal after K, R) was allowed, and oxidation of methionine and N-acetylation were set as a variable modifications. Carbamidomethylation on cysteine residues was set as a fixed modification. The minimum peptide length was set at six amino acids. The mass tolerance was set at 20 ppm for precursor ions and 0.5 Da for fragment ions. Known contaminants were excluded from the protein lists. A false discovery rate of 0.01 was set for both the protein and the peptide level, and proteins were considered identified if at least two peptides per protein were identified. Modifications included in protein quantification were oxidation (M), N-acetylation, and carbamidomethylation (C). The re-quantification feature was enabled. Quantification was performed with unique and razor peptides only at a minimum ratio count of 1. Protein ratios were calculated for three-dimensional versus two-dimensional culture conditions and log2-transformed. An unpaired, two-sided, heteroscedastic Student's t test was applied to compare ratios. A p value of <0.05 and a relative change of at least 1.5-fold were set as thresholds for significant changes of protein intensities.
Determination of SILAC Incorporation Efficiencies
In order to determine the incorporation efficiency of the stable-isotope-labeled amino acids in hPSCs in our approach, 10 μg of protein was acetone precipitated from whole cell lysates of labeled samples and separated via SDS-PAGE individually. Gels were Coomassie stained, and two prominent bands per lane were cut, pooled, subjected to trypsin digestion, and analyzed via LC-MS/MS. MaxQuant analysis revealed that β-actin (ACTB) and heat shock protein HSP 90-β were identified with the highest numbers of peptide matches. The theoretical molecular weights of ACTB (42 kDa) and heat shock protein HSP 90-β (83 kDa) fit the observed height of the cut bands. Peptide lists were extracted from the MaxQuant analysis for ACTB and heat shock protein HSP 90-β and revealed the labeled-to-unlabeled ratios for each peptide. The incorporation efficiency was calculated as (1 − 1/(ratio + 1)) × 100%. For determination of the mean incorporation efficiency, the lowest 10% of the values were disregarded.
RNA Expression Profiling by Transcriptome Analysis
For the extraction of total RNA from TRIzol® (Invitrogen) samples of hESCs and hiPSCs expanded in light, medium, or heavy SILAC MEF-CM under either two-dimensional or three-dimensional culture conditions, 0.2 ml of chloroform was added per milliliter of TRIzol® and samples were centrifuged at 12,000 × g. Supernatants were mixed with equal volumes of ice-cold 70% ethanol, and RNA purification was conducted applying the NucleoSpin® RNA II Kit (Macherey-Nagel, Düren, Germany). RNA was eluted in sterile double-deionized H2O and stored at −80 °C. The concentration of total RNA was determined at 260 nm using a UV spectrophotometer. For each condition (two-dimensional hESC, three-dimensional hESC, two-dimensional hiPSC, and three-dimensional hiPSC), the different SILAC conditions (light, medium, and heavy) were considered as biological replicates and were pooled before library preparation. 10 μg of each total RNA sample was spiked with Ambion® ERCC Spike-in Control Mixes (Invitrogen) prior to removal of the rRNA by use of a Ribo-ZeroTM Kit (Epicenter, Madison, WI). The RNA was then prepared for sequencing using the protocol and components provided with the SOLiD® Total RNA-Seq Kit (Invitrogen). Briefly, the rRNA-depleted RNA was fragmented by chemical hydrolysis, phosphorylated, and purified. Adaptors were then ligated and hybridized to the RNA fragments and reverse-transcribed into cDNA. The cDNA was purified and size-selected using two rounds of Agencourt AMPure XP bead purification (Beckman Coulter Genomics, Danvers, MA) and released from the beads. Each of the four samples was then amplified by 12 PCR cycles in a Biometra T3 Thermocycler in the presence of primers that contained unique sequences (barcoding) in order to determine the origin of the sequence after pooling of the fragments and sequencing. The size distribution and concentration of the fragments were determined with an Agilent 2100 Bioanalyzer and the corresponding chemistry (Agilent Technologies, Santa Clara, CA). The cDNA fragments were then pooled in equimolar amounts and diluted to 61 pg/μl, corresponding to a concentration of 500 pm. 50 μl of this dilution was mixed with a freshly prepared oil emulsion, P1 and P2 reagents, and P1 beads in a SOLiD EZ Bead Emulsifier prepared according to the E80 scale protocol provided by the manufacturer (Invitrogen). The emulsion PCR was carried out in a SOLiD EZ Bead Amplifier (Invitrogen) using the E80 setting, and to enrich for the beads that carried amplified template DNA, the beads were purified on a SOLiD EZ Bead Enricher using the recommended chemistry and software (Invitrogen). The purified beads were loaded onto four lanes of a SOLiD six-lane Flowchip and incubated upside-down for 1 h at 37 °C. The Flowchip was then positioned in the 5500xl SOLiD System, and the DNA was sequenced with read lengths of 75 nucleotides and the recommended chemistry (Invitrogen). Data were exported and read mapping was performed using the Lifescope software analysis tool (Invitrogen) and reference genome GRCh37/hg19. Statistical interpretation was accomplished using R (43). Normalization and differential expression analysis were performed using the R packages EDASeq (44) and DESeq (45), respectively. Differentially expressed genes were selected by filtering for a p value smaller than 0.05. However, in the transcriptomic approach, pools of the light, medium and heavy SILAC samples were analyzed for hESCs and hiPSCs, and the obtained significance was of a technical nature rather than biological. Functional annotation, clustering, and enrichment analysis were performed using DAVID (46).
Quantitative Real-time PCR
RNA preparation was done as described above. Residual genomic DNA was removed by digest with RQ1 RNase-free DNase (Promega, Madison, WI) for 30 min at 37 °C, and then the reaction was stopped by RQ1 DNase stop solution (Promega) and incubation for 10 min at 70 °C. RNA was reverse-transcribed into cDNA using random hexamer primers (Invitrogen) and RevertAidTM Premium Reverse Transcriptase (Thermo Scientific) by incubating the samples for 10 min at 25 °C, 50 min at 42 °C, and 10 min at 70 °C. The synthesized cDNA was stored at −20 °C and used in a 1:10 dilution for qPCR. qPCR was performed on a 7500 Fast Real-time PCR System (Applied Biosystems, Foster City, CA) in sealed 96-well optical reaction plates (Applied Biosystems) using a volume of cDNA corresponding to 20 ng of original RNA and 0.475 pmol of each primer (forward/reverse) in a mastermix with 4 nmol of each dNTP (dATP, dCTP, dTTP, dGTP), 10% (v/v) Maxima Hot Start TaqPCR buffer, 1.875 mm MgCl2, 0.5 U Maxima Hot Start TaqDNA Polymerase (all from Thermo Scientific), 1% (v/v) ROX reference dye, and 8% (v/v) 1:10,000 dilution of SYBR Green Nucleic Acid Stain (both from Invitrogen) in a total volume of 20 μl. The PCR was run for 40 two-step cycles (60 s at 60 °C and 15 s at 90 °C) after an initial 10-min denaturation step at 95 °C. Determination of product purity and of amplicon size was performed via melt-curve analysis in an additional cycle (95 °C, 15 s; 60 °C, 60 s; 95 °C, 30 s; 60 °C, 15 s) and gel electrophoresis on a 2% agarose gel, respectively. The relative expression of target genes was determined via normalization to succinate dehydrogenase complex subunit B and actin related protein 2/3 complex subunit 1A. Inter-run variations were ruled out via the use of a single cDNA reference mix composed of cDNA corresponding to standard conditions of the respective experiments throughout all PCR runs of the respective target genes. CT values were determined automatically by 7500 Software v2.0.5. Relative expression was calculated using the ΔΔCT method, in which the relative expression is 2−ΔΔCT. Sequences of oligonucleotides used as primers in qPCR analyses are listed in supplemental Table S3. All primers were purchased from Sigma-Aldrich.
Flow Cytometry
For the analysis of SSEA-4 expression via flow cytometry, cells were washed twice with PBS and dissociated into single cells with TrypLETM Select (Invitrogen) by incubation at 37 °C for 3 to 5 min or 10 min for cells grown in two-dimensional or three-dimensional culture, respectively. Cells were resuspended in FACS buffer comprising 2% BSA in PBS (Sigma-Aldrich), and the cell number was determined using a Neubauer hemocytometer. About 3 × 10⁵ cells were incubated with a 1:400 dilution of anti-human SSEA-4 as primary antibody or mouse IgG3κ isotype control (both from BioLegend, San Diego, CA; 500 μg/ml) in FACS buffer and subsequently with a 1:1200 dilution of Alexa Fluor® 488 F(ab′)2 fragment of goat anti-mouse IgG (H+L) in FACS buffer (Invitrogen) as a secondary antibody. Both steps were performed with shaking on a thermomixer (Eppendorf, Hamburg, Germany) for 60 min at 700 rpm and room temperature. After each staining step, cells were washed twice with 400 μl of FACS buffer. For flow cytometry, cells were resuspended in 150 μl of FACS buffer and analyzed on an Accuri® C6 Flow Cytometer (BD Biosciences, Franklin Lakes, NJ) recording at least 10,000 cells per sample at a flow rate of 60 μl/min. Particles below a forward scatter of 80,000 were excluded from the analysis (CFlow®Plus software v1.0.264.15). To determine the percentage of SSEA-4-positive cells, the threshold was set at 1% positive cells for the IgG3κ isotype control (FlowJo software v10.0.5).
Immunofluorescence Microscopy
For immunofluorescence microscopy, cells were seeded onto 3.5-cm plastic dishes and grown for 2 to 4 days until they reached the desired density or colony size (two-dimensional culture), or spheroids were generated as described for three-dimensional culture. Cells were washed with PBS and fixed with 4% paraformaldehyde (AppliChem, Darmstadt, Germany) in PBS for 30 min. Suspension culture spheroids were subsequently embedded into Tissue-Tek® O.C.TTM Compound (Sakura, Alphen aan den Rijn, The Netherlands), and 5-μm sections were prepared using a Cryostat CM3050 (Leica, Wetzlar, Germany). Sections were placed on SuperFrost® Plus microscope slides (Thermo Fisher Scientific). For immunostaining, cells were blocked with 2% (w/v) BSA in PBS (Sigma-Aldrich) for 20 min. Incubation with antibodies was performed for 1 h at room temperature for each primary or secondary antibody. Between the different staining steps, the cells were washed with PBS. For staining of intracellular epitopes, cells were permeabilized in 0.1% Triton X-100 for 15 min. Permeabilized cells were blocked in 2% (w/v) BSA/0.1% (v/v) Triton X-100 in PBS for 20 min. Antibodies and dilutions used for immunofluorescence microscopy were anti-OCT3/4 [C-10] sc-5279 (Santa Cruz Biotechnology, Santa Cruz, CA) 1:50, anti-SSEA-4 (BioLegend) 1:100, anti-mouse-IgG F(ab′)2 fragment-Cy3 (Sigma-Aldrich) 1:400, and Alexa Fluor® 488 Goat Anti-Mouse IgG2b (γ2b) (Invitrogen) 1:400. Antibodies were diluted in 2% (w/v) BSA in PBS. For staining of intracellular epitopes (i.e. OCT3/4), 0.1% Triton X-100 was added to the antibody solution. Cell nuclei were counterstained with Hoechst 32258 (AppliChem, Darmstadt, Germany). Coverslips were mounted onto the plastic dishes after staining using one droplet of Dako fluorescence mounting medium (Agilent Technologies) and analyzed using a Zeiss Axiovert 200 M microscope equipped with an AxioCam MRm digital camera and Axio Vision software v4.7 (Zeiss, Oberkochen, Germany).
Western Blotting
For Western blotting, SDS-PAGE gels were blotted on nitrocellulose membranes and incubated with the respective primary antibodies (supplemental Table S4). IRDye® 800 and 680 (LI-COR, Lincoln, NE) were used as fluorescently labeled secondary antibodies and detected via an Odyssey® infrared imaging system (LI-COR). Blots were analyzed using Odyssey v3.0 (LI-COR).
Cultivation of hPSCs with Calpain Inhibitors
Calpain inhibitor I (Sigma-Aldrich) and calpain inhibitor II (Sigma-Aldrich) were dissolved in 100% ethanol at 20 mg/ml and 10 mg/ml, respectively, and diluted with double-deionized H2O to concentrations of 1 mg/ml and 2 mg/ml, respectively, to obtain the stock solution. Calpeptin (Santa Cruz Biotechnology, Santa Cruz, CA) was dissolved in cell-culture-grade dimethyl sulfoxide (AppliChem, Darmstadt, Germany) to obtain a 50 mm stock solution. The effect of calpain inhibitors on spheroid formation was assessed by supplementing the standard inoculum for suspension cultures with the respective inhibitor at concentrations ranging from 20 μm to 200 μm. Spheroid formation was assessed via light microscopy after 4 days. In order to analyze the effect of calpain inhibitors on preformed spheroids, day-4 spheroids were treated with calpain inhibitors I and II and calpeptin at the given concentrations. Disassembly of spheroids after addition of the respective inhibitors was observed via light microscopy at different time points within 42 h. Light microscopy was performed using an ECLIPSE TS 100 (Nikon, Tokyo, Japan) equipped with a DS-Fi2 digital camera (Nikon). Pictures were further processed using NIS-Elements Analysis D software v4.13.01 (Nikon).
RESULTS
SILAC Labeling of hPSCs Is Compatible with Pluripotency
In order to quantitatively compare the proteomes of hESCs and hiPSCs that were grown either in two-dimensional or in three-dimensional culture, we utilized a SILAC-based approach (Fig. 1). For proteomic analysis of living cells, SILAC (47, 48) is an apt method (30, 32, 49) allowing relative quantitative assessments. The application of SILAC in hPSC cultures depended on two major prerequisites: (i) the efficient integration of labeled amino acids into the sample cells and (ii) the maintenance of hPSC pluripotency. MaxQuant analyses of mass spectra were carried out to determine SILAC labeling and revealed mean incorporation efficiencies greater than 95% for the analyzed peptides (Fig. 2A and supplemental Fig. S1). The pluripotency of cells under SILAC conditions in two-dimensional and three-dimensional culture was tested by use of a comprehensive array of standard tests including (i) qPCR analyses of common pluripotency markers (Fig. 2B), (ii) Western blot analysis of the pluripotency marker OCT3/4 (Fig. 2C), (iii) flow cytometry analysis for the surface-associated pluripotency marker SSEA-4 (Fig. 2D and supplemental Fig. S2A), and (iv) fluorescence microscopy after staining against OCT3/4 and SSEA-4 (supplemental Figs. S2B and S2C). Moreover, SILAC-labeled hESCs and hiPSCs were successfully differentiated into derivatives of all three germ layers (supplemental Fig. S3), and the application of a cardiomyogenic differentiation protocol led to the generation of beating cardiomyocytes (supplemental Fig. S3D, supplemental Movie S1). Taken together, these tests indicated that the SILAC labeling strategy used was compatible with the maintenance of hPSC pluripotency.
Fig. 2.

Quality control of SILAC-labeled hPSCs for SILAC amino acid incorporation (A) and pluripotency (B–D). A, incorporation ratios of medium (m) or heavy (h) labeled lysine and arginine in hESCs or hiPSCs grown in either two-dimensional or three-dimensional culture, presented as histograms with error bars (± S.D.); see also supplemental Fig. S1. B, qPCR-based determination of expression ratios for common pluripotency-associated genes. hESCs and hiPSCs were grown in either two-dimensional or three-dimensional culture under SILAC conditions in MEF-CM. The control sample represents a pool of hESCs and hiPSCs grown in MEF-CM and mTeSRTM1 under standard (two-dimensional) conditions. Histograms with error bars (± S.D.) represent the mean value of light, medium, or heavy labeled samples under the indicated culture conditions (equates to three biological repeats). C, Western blot analysis of the pluripotency marker OCT3/4. Expression of OCT3/4 was analyzed in hESCs and hiPSCs grown under the indicated SILAC conditions (l, light; m, medium; h, heavy) in MEF-CM under either two-dimensional or three-dimensional conditions and compared with cells grown in mTeSRTM1 under two-dimensional or three-dimensional conditions. The SILAC MEF-CM samples were derived from the same growth experiments that were used for proteomics and transcriptomics. D, flow cytometry analysis of hESCs and hiPSCs grown either in SILAC MEF-CM or in mTeSRTM1 under two-dimensional or three-dimensional culture conditions. Per definition, cells were SSEA-4 positive if they exhibited higher fluorescence intensities than 99% of cells of the negative control. Histograms with error bars (± S.D.) represent the mean value of light, medium, or heavy amino acids. Individual flow cytometric analyses of the different SILAC samples are shown in supplemental Fig. S2.
Proteomic and Transcriptomic Comparison of Two-dimensional versus Three-dimensional Cultures Revealed Similar Patterns of Differentially Expressed Genes in hESCs and hiPSCs
To identify differences in the proteomes that were associated with three-dimensional versus two-dimensional culture conditions, the SILAC-labeled pooled hESC and hiPSC samples (Fig. 1) were measured via mass spectrometry. In total, 3742 different proteins were identified via MaxQuant analysis. When we compared the three-dimensional and two-dimensional cultures in each group, we found 53 and 54 up-regulated proteins in hESCs and hiPSCs, respectively, with 22 proteins overlapping in both cell lines. Considerably more—namely, 265 and 416 proteins—were down-regulated from two-dimensional to three-dimensional culture in hESCs and hiPSCs, respectively, whereas 188 proteins were down-regulated in both cell lines (Fig. 3A, supplemental Table S1). Venn diagrams constructed from these data showed that many proteins were differentially regulated and did not overlap between hESCs and hiPSCs (Fig. 3A). The reason for this poor overlap is that in many cases a protein was identified as significantly differentially regulated in hESCs but just missed the significance threshold in hiPSCs, and vice versa. However, when heatmaps were constructed to present three-dimensional versus two-dimensional ratios, it was revealed that culture-dependent changes were comparable for the vast majority of differentially regulated proteins (Fig. 3B). In a parallel approach, transcriptomics was used to analyze culture-dependent differences in mRNA levels. Of the 16,907 detected transcripts, 285 (hESCs) and 258 (hiPSCs) were significantly (p < 0.05) up-regulated and 590 (hESCs) and 510 (hiPSCs) significantly (p < 0.05) down-regulated in three-dimensional culture (Fig. 3C, supplemental Table S2); the threshold was set at 2-fold. Equivalent to the proteomic analysis, several transcripts were identified in only one of the two cell lines as significantly differentially expressed. However, when we compared these three-dimensional versus two-dimensional ratios of both cell lines using a heatmap, we observed considerable overlap (Fig. 3D).
Fig. 3.
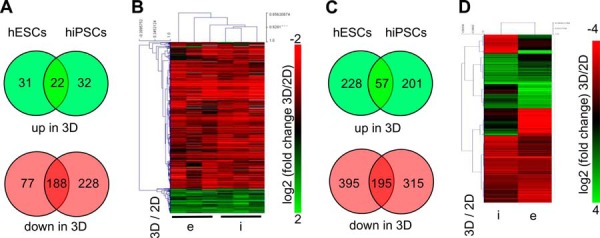
Bioinformatics analysis of SILAC-based proteomics (A, B) and deep-sequencing-based transcriptomics (C, D). A, Venn diagrams showing the numbers and the overlap of proteins that were significantly (p < 0.05) up- or down-regulated (>1.5-fold) either in hESCs or in hiPSCs, or in both, comparing three-dimensional versus two-dimensional culture. This figure was made applying the VENNY tool obtained from BioinfoGP (88). B, three-dimensional versus two-dimensional ratios for hESCs (e) and hiPSCs (i) of 585 proteins shown in A were log2 transformed and presented as a heatmap generated with MeV V4.8.1. Hierarchical clustering was performed using “Pearson Uncentered” as “Distance Metric Selection” and “Average Linkage Analysis” was performed. C, Venn diagrams showing the numbers and the overlap of transcripts that were significantly (p < 0.05) up- or down-regulated (>2-fold) in hESCs or in hiPSCs, or in both, comparing two-dimensional versus three-dimensional culture. D, three-dimensional versus two-dimensional ratios for hiPSCs (i) and hESCs (e) of the 1383 transcripts shown in (e) presented as a heatmap (generated as described for B).
In order to display the culture-dependent behavior of hPSCs in general, we decided to also perform a joint analysis merging the two different pluripotent cell lines for the proteomic (supplemental Figs. S4A and S4B, supplemental Table S1) and transcriptomic approaches (supplemental Fig. S4C, supplemental Table S2). When changes measured on the proteome level were plotted against transcriptomic changes of the respective samples, a considerable degree of similarity was observed (supplemental Fig. S4D).
Factors Involved in Cell–Cell and Cell–ECM Interactions Are Down-regulated in Three-dimensional Culture
To localize gene products significantly down-regulated (p < 0.05, >1.5-fold) after the transfer from two-dimensional to three-dimensional culture conditions in biological pathways, we used the STRING database (50) to perform KEGG pathway enrichment analyses. We selected categories for which at least three out of four screens (two cell lines for proteomics and two for transcriptomics) resulted in a significant enrichment. As shown in Fig. 4A, the enriched categories comprised pathways involved in cell–ECM interactions (e.g. the “focal adhesion” and “ECM receptor interaction” pathways) and cell–cell interactions (e.g. the “desmosome,” “tight junction,” and “adherens junction” pathways). The most significantly enriched KEGG pathway was the focal adhesion pathway. Focal adhesions are structures formed at cell–ECM contact points that connect the actin cytoskeleton with the ECM via transmembrane adhesion receptors (51). The combined analysis of proteomic and transcriptomic data from hESCs and hiPSCs (supplemental Fig. S4) revealed that components of structural elements forming focal adhesions were down-regulated in three-dimensionally cultured hPSCs. Among others were (i) collagens and laminins constituting ECM components; (ii) integrins, which are part of transmembrane adhesion receptors and contribute to signaling processes (52, 53); (iii) the heparan sulfate proteoglycan syndecan-4, a transmembrane protein that contributes to the formation of focal adhesions and modifies integrin-mediated adhesion and signaling (54); (iv) the receptors for epidermal growth factor, insulin-like growth factor-1, and the kinase insert domain, which all can associate and cross-talk with integrins (55); (v) the cytoskeletal proteins α-actinin-1, α-actinin-4, filamin B, and filamin C, all capable of interacting with the cytoplasmic tail of the integrin β subunit (51); and (vi) integrin interacting proteins such as focal adhesion kinase, a key regulator of focal adhesion sites and cell movement (56), paxillin, a regulator of cell spread and motility (57), and vinculin, a protein that links microfilaments to areas of cell–ECM or cell–cell contact (58).
Fig. 4.

Enrichment analyses of proteins and transcripts regulated by transition from two-dimensional to three-dimensional culture. A, enrichment analysis searching KEGG pathway performed with STRING (50) for proteins and transcripts significantly down-regulated (p < 0.05; >1.5-fold) in three-dimensional culture of hESCs or hiPSCs. Only KEGG pathways for which at least three out of four enrichment analyses (individual enrichment analyses with proteomic data for hESCs (i) and hiPSCs (ii) and transcriptomic data for hESCs (iii) and hiPSCs (iv)) led to a significant enrichment are shown. The numbers of proteins or transcripts belonging to the respective enriched pathways are given by histograms; the p values obtained from the enrichment analyses are depicted by circles as indicated in the figure. B, enrichment analysis of proteins and transcripts significantly up-regulated (p < 0.05; >1.5-fold) in three-dimensional culture. Enrichment analysis of up-regulated factors was performed for “GO biological process”, and the presentation is the same as for panel A.
Closely related with the KEGG pathway focal adhesion pathway is the pathway for regulation of actin cytoskeleton. Also in this pathway several components were found to be down-regulated in three-dimensional cultures. This concerned, for instance, the cytoplasmic ACTB and other actin regulating proteins such as zyxin, a protein implicated in actin remodeling and found at focal adhesions (59). Finally, we found p130CAS (BCAR1), an interaction partner of focal adhesion kinase known to be involved in actin stress fiber formation (60), down-regulated in this pathway.
Other proteins involved in the formation of cell–cell interaction complexes like adherens junctions, tight junctions, and desmosomes were down-regulated in samples isolated from three-dimensional cultures. Adherens junctions bridge the actin cytoskeletons of two neighboring cells that interact via E-cadherins (61), and down-regulated factors also included the E-cadherin interaction partners β-catenin and p120 catenin and α-catenin, which interacts with β-catenin and the α-catenin binding proteins VLC, α-actinin-1, α-actinin-4, ZO-1, afadin (AF6), formin (FMN), EPLIN (LIMA1), and ACTB (62) (supplemental Fig. S4E). Analyses equivalent to those carried out for down-regulated factors were performed for factors significantly up-regulated (p < 0.05, >1.5-fold) in three-dimensional culture. Here, the enrichment analysis was carried out with “GO Biological Process” in the STRING database and revealed a strong enrichment of genes that encode nuclear factors (Fig. 4B). This finding is further discussed in the supplemental material.
Up-regulation of Secreted Wnt Antagonists Is Associated with the Down-regulated Expression of Direct Wnt Target Genes in Three-dimensional Culture
It was shown previously that in suspension cultures of hESCs, Wnt signaling is affected by the up-regulation of the central adherens junction component E-cadherin (22). As the enrichment analysis revealed that components of the KEGG adherens junction pathway and of other pathways that contribute to cell–cell and cell–ECM interactions were down-regulated, we focused our analysis on the Wnt signaling pathway. In the transcriptomic analysis of hESCs, three different secreted Wnt antagonists, namely, secreted frizzled-related protein 1 (SFRP1), secreted frizzled-related protein 3 (SFRP3 or FRZB), and cerberus (CER1) (63), were found to be significantly up-regulated in three-dimensional culture (supplemental Table S2). SFRP1 was strongly up-regulated in the SILAC experiment in hESCs and hiPSCs (Fig. 5A), and qPCR analyses corroborated the up-regulation of genes coding for SFRP1, FRZB, and cerberus on the gene-expression level in both cell lines (Fig. 5B). Notably, transcripts encoding for other important Wnt antagonists, namely, Wnt inhibitory factor 1 (WIF1) and dickkopf-related proteins 1 and 4 (DKK1 and 4) (63), were also up-regulated in three-dimensional culture samples, as shown by qPCR (Fig. 5B). Concomitant with the increased expression of Wnt antagonists was a significant down-regulation of Wnt target genes. These included the known Wnt targets cyclin-D1 (CCND1) (64), MYC proto-oncogene protein (c-MYC) (65), ETS translocation variant 4 (ETV4) (66), zinc finger protein SNAI1 (or SLUG) (67), CD44 antigen (68), Fos-related antigen 1 (FOSL1) (69), L1 cell adhesion molecule (L1CAM) (70), and the urokinase receptor (PLAUR) (69) (Fig. 5C).
Fig. 5.

Three-dimensional culture induces up-regulation of Wnt antagonist and down-regulation of Wnt target genes. A, Western blot of SFRP1 for hESCs and hiPSCs grown under either two-dimensional or three-dimensional culture conditions. 10 μg of protein were loaded per lane. B, qPCR analysis revealing relative expression levels of Wnt antagonists in hESCs and hiPSCs, comparing expression under three-dimensional conditions to that under two-dimensional conditions for hESCs and hiPSCs individually. The mean value of two-dimensional culture for each cell line was set to 1. The y-axis has a log2 scale. p values were calculated using an unpaired two-tailed homoscedastic Student's t test. C, qPCR analysis revealing relative expression levels of Wnt target genes in hESCs and hiPSCs grown under either two-dimensional or three-dimensional culture conditions. Generation of the diagram and t test are as described for panel B.
E-Cadherin and β-Catenin Are Cleaved by Calpain under Three-dimensional Culture Conditions
In the scenario proposed by Azarin et al. (22), E-cadherin scavenges β-catenin at adherens junctions, thereby retracting it from its role as a transcriptional cofactor for Wnt signaling. As the analytical procedures used in the current study did not show a significantly and considerably altered expression of E-cadherin in three-dimensional cultures for either cell line (Fig. 6A), we decided to further trace this issue via Western blot analysis. When we used the anti-E-cadherin antibody C36, which recognizes the cytoplasmic part of the molecule, a fragment of 100 kDa appeared exclusively in suspension cultured hPSCs, whereas the full-length E-cadherin band was visible in all samples (Fig. 6C, upper panel). The same pattern was obtained with antibody 24E10 recognizing an E-cadherin epitope that localizes around amino acid residue 780 (71) (Fig. 6D, upper panel).
Fig. 6.

E-cadherin and β-catenin are cleaved by calpain under three-dimensional culture conditions. A, qPCR analysis revealing relative expression levels of E-cadherin and β-catenin in hESCs and hiPSCs grown under either two-dimensional or three-dimensional culture conditions. Diagram and t test were generated as described for Fig. 5B. B, schematic of E-cadherin domain organization with known protease cleavage sites (modified from Ref. 89). Calpain cleavage of E-cadherin leads to a 100-kDa fragment. “EC1–5” denotes the extracellular repeat units of E-cadherin, and “TM” indicates the transmembrane region. p120ctn and β-catenin and γ-catenin binding sites are shown. Epitopes recognized by the antibody clones C36, 24E10, and C19 are indicated. C, Western blot using antibody C36 detecting full-length E-cadherin (fl E-cad) at 120 kDa for two-dimensional and three-dimensional culture and the E-cadherin 100-kDa fragment (E-cad100) for three-dimensional culture conditions only. 10 μg of hESCs or hiPSCs grown under either two-dimensional or three-dimensional culture conditions were loaded. D, Western blot using antibody 24E10 showing the E-cadherin 100-kDa fragment for three-dimensional culture conditions (upper panel, red) and antibody C19 detecting only the full-length version of E-cadherin (second panel, green). Sample loading was identical to that described for C. E, schematic of β-catenin domain organization with calpain cleavage site leading to a 75-kDa fragment of β-catenin (modified from Ref. 75). The transactivation (“ta”) domains are located at the N and C termini. The core region of β-catenin interacts with E-cadherin, TCF-4, and APC. “rd” denotes the regulatory domain containing the GSK3β phosphorylation sites. “?” denotes a site putatively cleaved by an unknown protease. Epitopes recognized by the antibody clones ABE208, 8E7 (both binding in the regulatory domain at the N terminus), and D10A (binding at the C terminus) are indicated. 8E7 binds only active β-catenin, which is dephosphorylated at Ser37 and Thr41, whereas ABE208 detects the same epitope independent of the phosphorylation state. F, Western blot using antibody D10A detecting full-length β-catenin (fl β-cat) in two-dimensional and three-dimensional cultures, the 90-kDa fragment of β-catenin exclusively in two-dimensional cultures, and the 75-kDa fragment of β-catenin (β-cat75) only for three-dimensional culture conditions (upper panel, red). Antibody 8E7 shows reduction of full-length active β-catenin (fl active β-cat) for three-dimensional culture conditions (second panel, green). Sample loading was identical to that described for C. G, Western blot using antibody ABE208 detecting the 90-kDa fragment of β-catenin for two-dimensional culture conditions but not detecting the 75-kDa fragment of β-catenin for three-dimensional culture conditions (upper panel, red). Similar to the Western blot presented in F, antibody 8E7 shows a reduction of active β-catenin for three-dimensional culture conditions (second panel, green). Sample loading was identical to that described for C. H, Western blot using the antibody AA6 against α-spectrin, which is a well-known substrate of calpain. The expected calpain cleavage product of α-spectrin occurring at 145 kDa (77) was increased under three-dimensional culture conditions at the expense of the uncleaved α-spectrin occurring at 250 kDa. Sample loading was identical to that described for C.
Several proteases are known to cleave E-cadherin (71), but only a few, including leukocyte elastase (72), meprin β (73), and calpain (74), produce a fragment of about 100 kDa. Of these, only calpain has been shown to cleave off the C terminus (Fig. 6B). When we used the antibody C-19, which binds to the very C-terminal region of E-cadherin (residues 863–882) that is released by calpain treatment (71, 74), the full-length E-cadherin but not the 100-kDa fragment could be displayed in both two-dimensional and three-dimensional culture samples (Fig. 6D, second panel). Together, these data provide strong evidence that the 100-kDa E-cadherin fragment identified in suspension culture was the result of calpain cleavage. As calpain has additionally been described to cleave off an N-terminal fragment of β-catenin resulting in the formation of a 75-kDa fragment (Fig. 6E) (75), we explored via the consecutive application of available antibodies whether this enzymatic reaction also takes place in three-dimensionally cultured cells. With the antibody D10A recognizing the C-terminal part of β-catenin, the full-length protein (∼95 kDa) was visible in cells cultured in two and three dimensions, whereas the band representing the 75-kDa β-catenin fragment was discovered in cells isolated from three-dimensional culture only (Fig. 6F, upper panel). Instead, a ∼90-kDa β-catenin band that had been described previously (75) was seen in two-dimensional samples; this fragment disappeared in three-dimensional culture. Another antibody (ABE208) recognizing the N-terminal domain released by calpain detected the full-length β-catenin but not the 75-kDa fragment in samples of both culture conditions (Fig. 6G, upper panel). Moreover, this antibody detected the 90-kDa β-catenin fragment in two-dimensionally cultured hPSCs only. Finally, we used the antibody 8E7 to prove that under three-dimensional conditions the nonphosphorylated, active form of β-catenin (i.e. the β-catenin subfraction that is transcriptionally active in the Wnt signaling pathway) is considerably reduced (Figs. 6F and 6G, second panel). The binding epitope of 8E7 overlaps with the binding epitope of ABE208, but 8E7 does not detect β-catenin if cleaved by calpain or if phosphorylated by glycogen synthase kinase 3 in response to Wnt pathway inhibition (76). Taken together, the Western blot results are in perfect congruence with the observed up-regulation of Wnt antagonists (Figs. 5A and 5B) and the down-regulation of Wnt target gene expression (Fig. 5C). Of note, the expression level of β-catenin did not change significantly under the different culture conditions (Fig. 6A). These data strongly suggest that calpain is activated in three-dimensional culture conditions and cleaves E-cadherin as well as β-catenin.
To confirm this hypothesis, calpain activity under three-dimensional conditions was analyzed with the well-known calpain substrate α-spectrin (77). As shown in Fig. 6H, the known ∼150-kDa α-spectrin cleavage product was unequivocally identified in this assay. In summary, these data confirm the presence of active calpain in three-dimensionally cultured hPSCs.
Inhibition of Calpain Prevents Formation of Spheroids in Suspension Culture and Induces Dissociation of Pre-formed Spheroids
Our results also predicted that the inhibition of calpain activity should hamper the formation of spheroids under three-dimensional conditions. In initial experiments, calpain inhibitor I was added to the established, single-cell-based inoculum of suspension cultures, and hPSCs did not form spheroids even after 4 days in culture, whereas efficient spheroid formation was observed in parallel mock controls as expected (Fig. 7 and supplemental Fig. S5A). Furthermore, the addition of calpain inhibitor I to pre-formed, regular spheroids was sufficient to cause disaggregation of MSCs. After 16 to 18 h in the presence of the inhibitor, spheroids lost their sharp contours and eventually disintegrated; the process was completed after 36 h (Fig. 7 and supplemental Fig. S5A). Notably, similar results were obtained if cultures were treated with calpain inhibitor II or with calpeptin (supplemental Figs. S5B and S5C). A model describing the observations made in this study is shown in Fig. 8.
Fig. 7.
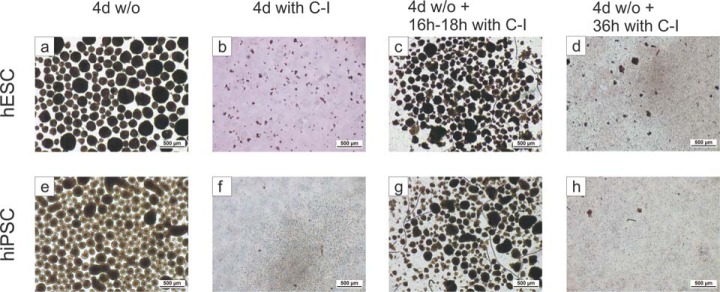
Effects of calpain inhibitors on spheroid genesis and on pre-formed spheroids. Free-floating suspension culture spheroids of hESCs and hiPSCs developed within 4 days under standard culture conditions (a, e). The addition of 20 μm calpain inhibitor I (C-I) to the inoculum abolished spheroid formation completely (b, f). The addition of C-I to already built 4-day-old spheroids caused gradual disassembly, which was clearly visible after 18 h (c, g) and led to complete disassembly of spheroids after 36 h (d, h) when cells were slightly pipetted up and down. Disassembly of spheroids was achieved with 20 μm or 50 μm C-I for hESCs (c, d) and hiPSCs (g, h), respectively. Pictures were taken at 4-fold magnification. Further results using calpain inhibitors are shown in supplemental Fig. S5.
Fig. 8.

Schematic showing effects of two-dimensional and three-dimensional culture on Wnt signaling and cell–cell interactions influenced by the activation of calpain. A, effect of three-dimensional culture on Wnt signaling. Expression of secreted Wnt antagonist is up-regulated in three-dimensional cultures (depicted in green), causing inhibition of Wnt signaling accompanied by degradation of cytosolic β-catenin and down-regulation of Wnt target gene expression (depicted in red). Concomitantly, E-cadherin and β-catenin are cleaved by calpain (depicted in yellow), leading to the release of a putatively stabilized form of β-catenin from adherens junctions, which counteracts the down-regulation of Wnt target gene expression, finally leading to an only slightly reduced level of direct Wnt target gene expression. B, effect of three-dimensional culture on cell–cell interactions. Under three-dimensional culture conditions E-cadherin is cleaved by calpain at its cytosolic domain (depicted in yellow). Thus E-cadherin interaction with β-catenin and components of the actin cytoskeleton is abolished, leading to a disassembly of adherens junctions. Instead E-cadherin can distribute over the entire cell surface, establishing homophilic interactions with E-cadherin molecules of neighboring cells, leading to compaction of spheroids. “AJs” denotes adherens junctions.
DISCUSSION
Three-dimensional culture systems are indispensable for the envisioned mass production of hPSCs for therapeutic applications and drug testing (3). Although three-dimensional culture systems have been successfully established by us and others (4–9), the molecular changes associated with the switch from two-dimensional to three-dimensional culture are barely understood. Based on a comprehensive approach that included quantitative proteomics and transcriptomics, our current study demonstrates that under three-dimensional culture conditions factors involved in cell–cell and cell–ECM interactions are down-regulated; Wnt signaling is inhibited by the up-regulation of secreted Wnt antagonists, and activation of calpain results in the processing of E-cadherin and β-catenin. By demonstrating that calpain activity is required for spheroid formation, we have revealed a yet unappreciated key function of calpain in the interplay of E-cadherin and β-catenin-mediated intercellular adhesion and the canonical Wnt signaling pathway (see Fig. 8).
Factors that were down-regulated in three-dimensional cultures were enriched in KEGG pathways reflecting junctional complexes such as the focal adhesion, ECM receptor interaction, tight junction, and adherens junction pathways. Congruent with this, the cysteine protease calpain, known to selectively degrade junctional proteins (78), was found to be activated under three-dimensional culture conditions. The observed decrease in the expression of focal-adhesion-associated proteins in three-dimensional cultures appears to be a trivial consequence of morphological changes that cells undergo in floating spheroids. It should be noted that RI (13) was always added to hPSCs in our experimental system (i.e. in two-dimensional and three-dimensional culture). The presence of RI kept our two-dimensionally cultured hPSCs in monolayers with cells appearing in a spread morphology and with numerous membrane protrusions, in contrast to two-dimensional conditions without RI, in which hPSCs grow as compact colonies. Differences in focal adhesion components identified between two-dimensional and three-dimensional samples may therefore be enhanced by our culture conditions.
Components of the adhesion apparatus not only have structural functions but also contribute to signaling processes, integrating cell morphology and gene expression (79). β-Catenin is a key component of adherens junctions and a transcriptional cofactor in the Wnt signaling pathway (21) as well. Importantly, a loss of E-cadherin-mediated cell adhesions has been shown to promote β-catenin release and subsequently activation of the Wnt signaling pathway (80). This observation, at first glance, is seemingly in conflict with our data showing inhibition of Wnt signaling. However, this discrepancy is resolved by our finding that three-dimensionally cultured hPSCs turned on the expression of secreted Wnt antagonists, including SFRP1, FRZB, cerberus, dickkopf-related protein 1 and 4, and Wnt inhibitory factor 1. These Wnt antagonists activate glycogen synthase kinase 3, which in turn phosphorylates β-catenin and primes it for proteasomal degradation (81). We have demonstrated that the nonphosphorylated, active form of β-catenin was strongly reduced in three-dimensionally cultured cells, whereas total β-catenin levels remained unaffected. Consequently, the expression of several direct Wnt target genes was found to be down-regulated.
The inhibition of Wnt signaling has recently also been described for hESCs grown in a three-dimensional microwell culture model (22). In contrast to our findings, Azarin et al. (22) identified elevated E-cadherin levels in their microwell three-dimensional system and suggested that E-cadherin scavenges β-catenin at adherens junctions, thereby preventing its availability as a transcriptional cofactor for Wnt signaling. In the free-floating spheroid culture system used in our study, the expression of E-cadherin remained unchanged relative to two-dimensional cultures. However, in a detailed Western blot analysis we demonstrated that E-cadherin was cleaved by calpain under three-dimensional conditions, leading to a C-terminally truncated 100-kDa fragment. This 100-kDa fragment, which was previously identified in prostate epithelial cells upon experimental calpain activation, is known to lack the capacity to bind to β- and γ-catenin, in contrast to the full-length form of the protein (74). Moreover, in multicellular tumor spheroids (82) and in lymphovascular tumor emboli (71), the 100-kDa E-cadherin fragment was also discovered and attributed to endogenous activity of calpain (71). Another important finding of our study was the appearance of a 75-kDa β-catenin fragment under suspension culture conditions. This fragment was previously also detected in tumor cells and attributed to calpain cleavage of β-catenin (75). Considering that the endogenous calpain inhibitor calpastatin was downregulated in three-dimensional cultures in our study (supplemental Table S1), these data led to the hypothesis that the activation of calpain is the underlying reason for the cleavage of E-cadherin and β-catenin in three-dimensional cultures.
It is worth highlighting, however, that calpain's effects on the transcriptional activity of β-catenin are controversial. The activation of calpain has been described as causing nuclear export and cytoplasmic degradation of β-catenin, thereby negatively affecting Wnt target gene expression (83, 84), but in stark contrast, other studies suggest that N-terminal cleavage of β-catenin by calpain removes the regulatory phosphorylation sites, thereby increasing the stability of a transcriptionally active form of β-catenin (75, 85). Our current data show a strong up-regulation of secreted Wnt antagonist and a drastic reduction in the level of active β-catenin. The down-regulation of Wnt target gene expression, however, was moderate. To integrate these data, we suggest that calpain-cleaved β-catenin may in fact be stabilized and remain transcriptionally active. This fraction might then counterbalance the β-catenin lost through proteasomal degradation, which is induced by Wnt pathway inhibition as a consequence of the observed elevation of secreted Wnt inhibitors.
We have shown that the inhibition of calpain negatively interfered with spheroid formation and was further sufficient to cause the disassembly of pre-formed spheroids. These findings are in accordance with recent results on lymphovascular tumor emboli and tumor spheroids (71), representing three-dimensional aggregates of stem-cell-related cells (86). In accordance with a previously proposed model (71), we suggest that calpain-mediated cleavage of E-cadherin facilitates its disassembly from adherens junctions, thereby supporting distribution of the truncated E-cadherin over the entire cell surface and subsequently increasing homophilic cell–cell interactions. Tumor cells and stem cells have many common features (87). Our results now reveal that they also share a common mechanism required for the formation of three-dimensional spheroids and that calpain is a key player in this process. Its distinguished role also highlights calpain as a target for novel biotechnological applications regarding the systematic improvement of three-dimensional stem cell culture, as (i) calpain inhibition might aid in the establishment of single-cell-based suspension cultures, a theory supported by the finding that calpain inhibition increases apoptosis resistance (71), or (ii) calpain activation could promote spheroid formation and might support the reassembly of cells in freshly inoculated suspension cultures, thereby preventing the substantial cell death associated with single-cell-based suspension culture inoculation, even in the presence of RI.
Considering all of our findings, we propose the following model: The formation of free-floating hPSC spheroids leads to the activation of calpain. Calpain activity is indispensable in this process, as it cleaves E-cadherin, resulting in the disassembly of adherens junctions, which are characteristic of two-dimensional surface-adherent hPSCs. The disassembly of adherens junctions is accompanied by the release of β-catenin, which can subsequently feed into the Wnt pathway. Because β-catenin is also cleaved by calpain, this process seems to further stabilize a transcriptionally active fragment of β-catenin. Both effects supposedly lead to boosted Wnt pathway activation. However, as supported by our data, these mechanisms are counteracted and thus balanced by the up-regulation of Wnt antagonists, subsequently stabilizing the pluripotent status of hPSCs in cell-only spheroids in suspension (Fig. 8).
The insight acquired in the current study increases the general understanding of how stem cells “adapt” to changing growth conditions and will have practical implications for the development of superior protocols for pluripotent stem cell expansion on a large scale, as well as for the improvement of differentiation routines starting from suspension culture spheroids.
Supplementary Material
Acknowledgments
The authors thank Prof. Dr. Gerardy-Schahn, head of the Institute for Cellular Chemistry, Hannover Medical Schools, for providing general laboratory equipment and for carefully reading this manuscript. We thank Prof. Dr. Scheper (Institute of Technical Chemistry, Leibniz University of Hannover) for providing bFGF and RI, Prof. Dr. Martin (LEBAO, MHH) for providing hiPSCs, and Prof. Dr. Gaestel (Institute for Physiological Chemistry, MHH) for providing access to flow cytometry. We also thank Astrid Oberbeck for practical assistance and Julia Tschirka for doing a practical internship on this project.
Footnotes
Author contributions: F.F.B. designed research; S.A.K., L.V., R.O., H.M., and F.F.B. performed research; L.V., A.S., A.P., and A.W.K. contributed new reagents or analytic tools; S.A.K., L.V., R.W., A.W.K., R.Z., and F.F.B. analyzed data; S.A.K., R.Z., and F.F.B. wrote the paper.
* This work is supported by funding from the Deutsche Forschungsgemeinschaft (DFG, German Research Foundation) for the Cluster of Excellence REBIRTH (From Regenerative Biology to Reconstructive Therapy).
 This article contains supplemental material.
1 The abbreviations used are:
- hESC
- human embryonic stem cell
- hiPSC
- human induced pluripotent stem cell
- hPSC
- human pluripotent stem cell
- ECM
- extracellular matrix
- MEM
- minimum Eagle's medium
- ACN
- acetonitrile
- ACTB
- β-actin
- MCS
- multicellular spheroid
- MEF-CM
- mouse embryonic fibroblast–conditioned medium
- qPCR
- quantitative real-time polymerase chain reaction
- RI
- Rho-associated coiled-coil kinase inhibitor Y27632
- SILAC
- stable isotope labeling by amino acids in cell culture
- SFRP
- secreted frizzled-related protein.
REFERENCES
- 1. Takahashi K., Yamanaka S. (2006) Induction of pluripotent stem cells from mouse embryonic and adult fibroblast cultures by defined factors. Cell 126, 663–676 [DOI] [PubMed] [Google Scholar]
- 2. Thomson J. A., Itskovitz-Eldor J., Shapiro S. S., Waknitz M. A., Swiergiel J. J., Marshall V. S., Jones J. M. (1998) Embryonic stem cell lines derived from human blastocysts. Science 282, 1145–1147 [DOI] [PubMed] [Google Scholar]
- 3. Zweigerdt R. (2009) Large scale production of stem cells and their derivatives. Adv. Biochem. Eng. Biotechnol. 114, 201–235 [DOI] [PubMed] [Google Scholar]
- 4. Amit M., Laevsky I., Miropolsky Y., Shariki K., Peri M., Itskovitz-Eldor J. (2011) Dynamic suspension culture for scalable expansion of undifferentiated human pluripotent stem cells. Nat. Protoc. 6, 572–579 [DOI] [PubMed] [Google Scholar]
- 5. Krawetz R., Taiani J. T., Liu S., Meng G., Li X., Kallos M. S., Rancourt D. E. (2010) Large-scale expansion of pluripotent human embryonic stem cells in stirred-suspension bioreactors. Tissue Eng. Part C Methods 16, 573–582 [DOI] [PubMed] [Google Scholar]
- 6. Larijani M. R., Seifinejad A., Pournasr B., Hajihoseini V., Hassani S. N., Totonchi M., Yousefi M., Shamsi F., Salekdeh G. H., Baharvand H. (2011) Long-term maintenance of undifferentiated human embryonic and induced pluripotent stem cells in suspension. Stem Cells Dev. 20, 1911–1923 [DOI] [PubMed] [Google Scholar]
- 7. Olmer R., Haase A., Merkert S., Cui W., Palecek J., Ran C., Kirschning A., Scheper T., Glage S., Miller K., Curnow E. C., Hayes E. S., Martin U. (2010) Long term expansion of undifferentiated human iPS and ES cells in suspension culture using a defined medium. Stem Cell Res. 5, 51–64 [DOI] [PubMed] [Google Scholar]
- 8. Singh H., Mok P., Balakrishnan T., Rahmat S. N., Zweigerdt R. (2010) Up-scaling single cell-inoculated suspension culture of human embryonic stem cells. Stem Cell Res. 4, 165–179 [DOI] [PubMed] [Google Scholar]
- 9. Zweigerdt R., Olmer R., Singh H., Haverich A., Martin U. (2011) Scalable expansion of human pluripotent stem cells in suspension culture. Nat. Protoc. 6, 689–700 [DOI] [PubMed] [Google Scholar]
- 10. Abbasalizadeh S., Larijani M. R., Samadian A., Baharvand H. (2012) Bioprocess development for mass production of size-controlled human pluripotent stem cell aggregates in stirred suspension bioreactor. Tissue Eng. Part C Methods 18, 831–851 [DOI] [PubMed] [Google Scholar]
- 11. Chen V. C., Couture S. M., Ye J., Lin Z., Hua G., Huang H. I., Wu J., Hsu D., Carpenter M. K., Couture L. A. (2012) Scalable GMP compliant suspension culture system for human ES cells. Stem Cell Res. 8, 388–402 [DOI] [PubMed] [Google Scholar]
- 12. Olmer R., Lange A., Selzer S., Kasper C., Haverich A., Martin U., Zweigerdt R. (2012) Suspension culture of human pluripotent stem cells in controlled, stirred bioreactors. Tissue Eng. Part C Methods 18, 772–784 [DOI] [PMC free article] [PubMed] [Google Scholar]
- 13. Watanabe K., Ueno M., Kamiya D., Nishiyama A., Matsumura M., Wataya T., Takahashi J. B., Nishikawa S., Nishikawa S., Muguruma K., Sasai Y. (2007) A ROCK inhibitor permits survival of dissociated human embryonic stem cells. Nat. Biotechnol. 25, 681–686 [DOI] [PubMed] [Google Scholar]
- 14. Sasai Y. (2013) Next-generation regenerative medicine: organogenesis from stem cells in 3D culture. Cell Stem Cell 12, 520–530 [DOI] [PubMed] [Google Scholar]
- 15. Bratt-Leal A. M., Carpenedo R. L., McDevitt T. C. (2009) Engineering the embryoid body microenvironment to direct embryonic stem cell differentiation. Biotechnol. Prog. 25, 43–51 [DOI] [PMC free article] [PubMed] [Google Scholar]
- 16. Giobbe G. G., Zagallo M., Riello M., Serena E., Masi G., Barzon L., Di Camillo B., Elvassore N. (2012) Confined 3D microenvironment regulates early differentiation in human pluripotent stem cells. Biotechnol. Bioeng. 109, 3119–3132 [DOI] [PubMed] [Google Scholar]
- 17. Lin R. Z., Chang H. Y. (2008) Recent advances in three-dimensional multicellular spheroid culture for biomedical research. Biotechnol. J. 3, 1172–1184 [DOI] [PubMed] [Google Scholar]
- 18. Dang S. M., Gerecht-Nir S., Chen J., Itskovitz-Eldor J., Zandstra P. W. (2004) Controlled, scalable embryonic stem cell differentiation culture. Stem Cells 22, 275–282 [DOI] [PubMed] [Google Scholar]
- 19. Ivascu A., Kubbies M. (2007) Diversity of cell-mediated adhesions in breast cancer spheroids. Int. J. Oncol. 31, 1403–1413 [PubMed] [Google Scholar]
- 20. Lin R. Z., Chou L. F., Chien C. C., Chang H. Y. (2006) Dynamic analysis of hepatoma spheroid formation: roles of E-cadherin and beta1-integrin. Cell Tissue Res. 324, 411–422 [DOI] [PubMed] [Google Scholar]
- 21. Nelson W. J., Nusse R. (2004) Convergence of Wnt, beta-catenin, and cadherin pathways. Science 303, 1483–1487 [DOI] [PMC free article] [PubMed] [Google Scholar]
- 22. Azarin S. M., Lian X., Larson E. A., Popelka H. M., de Pablo J. J., Palecek S. P. (2012) Modulation of Wnt/beta-catenin signaling in human embryonic stem cells using a 3-D microwell array. Biomaterials 33, 2041–2049 [DOI] [PMC free article] [PubMed] [Google Scholar]
- 23. McMahon K. M., Volpato M., Chi H. Y., Musiwaro P., Poterlowicz K., Peng Y., Scally A. J., Patterson L. H., Phillips R. M., Sutton C. W. (2012) Characterization of changes in the proteome in different regions of 3D multicell tumor spheroids. J. Proteome Res. 11, 2863–2875 [DOI] [PubMed] [Google Scholar]
- 24. Hirschhaeuser F., Menne H., Dittfeld C., West J., Mueller-Klieser W., Kunz-Schughart L. A. (2010) Multicellular tumor spheroids: an underestimated tool is catching up again. J. Biotechnol. 148, 3–15 [DOI] [PubMed] [Google Scholar]
- 25. Gaedtke L., Thoenes L., Culmsee C., Mayer B., Wagner E. (2007) Proteomic analysis reveals differences in protein expression in spheroid versus monolayer cultures of low-passage colon carcinoma cells. J. Proteome Res. 6, 4111–4118 [DOI] [PubMed] [Google Scholar]
- 26. Fathi A., Pakzad M., Taei A., Brink T. C., Pirhaji L., Ruiz G., Sharif Tabe B. M., Gourabi H., Adjaye J., Baharvand H., Salekdeh G. H. (2009) Comparative proteome and transcriptome analyses of embryonic stem cells during embryoid body-based differentiation. Proteomics 9, 4859–4870 [DOI] [PubMed] [Google Scholar]
- 27. Van Hoof D., Krijgsveld J., Mummery C. (2012) Proteomic analysis of stem cell differentiation and early development. Cold Spring Harb. Perspect. Biol. 4, 500–501 [DOI] [PMC free article] [PubMed] [Google Scholar]
- 28. Adewumi O., Aflatoonian B., Ahrlund-Richter L., Amit M., Andrews P. W., Beighton G., Bello P. A., Benvenisty N., Berry L. S., Bevan S., Blum B., Brooking J., Chen K. G., Choo A. B., Churchill G. A., Corbel M., Damjanov I., Draper J. S., Dvorak P., Emanuelsson K., Fleck R. A., Ford A., Gertow K., Gertsenstein M., Gokhale P. J., Hamilton R. S., Hampl A., Healy L. E., Hovatta O., Hyllner J., Imreh M. P., Itskovitz-Eldor J., Jackson J., Johnson J. L., Jones M., Kee K., King B. L., Knowles B. B., Lako M., Lebrin F., Mallon B. S., Manning D., Mayshar Y., McKay R. D., Michalska A. E., Mikkola M., Mileikovsky M., Minger S. L., Moore H. D., Mummery C. L., Nagy A., Nakatsuji N., O'Brien C. M., Oh S. K., Olsson C., Otonkoski T., Park K. Y., Passier R., Patel H., Patel M., Pedersen R., Pera M. F., Piekarczyk M. S., Pera R. A., Reubinoff B. E., Robins A. J., Rossant J., Rugg-Gunn P., Schulz T. C., Semb H., Sherrer E. S., Siemen H., Stacey G. N., Stojkovic M., Suemori H., Szatkiewicz J., Turetsky T., Tuuri T., van den B. S., Vintersten K., Vuoristo S., Ward D., Weaver T. A., Young L. A., Zhang W. (2007) Characterization of human embryonic stem cell lines by the International Stem Cell Initiative. Nat. Biotechnol. 25, 803–816 [DOI] [PubMed] [Google Scholar]
- 29. Haase A., Olmer R., Schwanke K., Wunderlich S., Merkert S., Hess C., Zweigerdt R., Gruh I., Meyer J., Wagner S., Maier L. S., Han D. W., Glage S., Miller K., Fischer P., Scholer H. R., Martin U. (2009) Generation of induced pluripotent stem cells from human cord blood. Cell Stem Cell 5, 434–441 [DOI] [PubMed] [Google Scholar]
- 30. Tian R., Wang S., Elisma F., Li L., Zhou H., Wang L., Figeys D. (2011) Rare cell proteomic reactor applied to stable isotope labeling by amino acids in cell culture (SILAC)-based quantitative proteomics study of human embryonic stem cell differentiation. Mol. Cell. Proteomics 10, M110.000679 DOI: 10.1074/mcp.M110.000679 [DOI] [PMC free article] [PubMed] [Google Scholar]
- 31. Wang S., Tian R., Li L., Figeys D., Wang L. (2011) An enhanced chemically defined SILAC culture system for quantitative proteomics study of human embryonic stem cells. Proteomics 11, 4040–4046 [DOI] [PubMed] [Google Scholar]
- 32. Prokhorova T. A., Rigbolt K. T., Johansen P. T., Henningsen J., Kratchmarova I., Kassem M., Blagoev B. (2009) Stable isotope labeling by amino acids in cell culture (SILAC) and quantitative comparison of the membrane proteomes of self-renewing and differentiating human embryonic stem cells. Mol. Cell. Proteomics 8, 959–970 [DOI] [PMC free article] [PubMed] [Google Scholar]
- 33. Bendall S. C., Hughes C., Stewart M. H., Doble B., Bhatia M., Lajoie G. A. (2008) Prevention of amino acid conversion in SILAC experiments with embryonic stem cells. Mol. Cell. Proteomics 7, 1587–1597 [DOI] [PMC free article] [PubMed] [Google Scholar]
- 34. Van Hoof D., Munoz J., Braam S. R., Pinkse M. W., Linding R., Heck A. J., Mummery C. L., Krijgsveld J. (2009) Phosphorylation dynamics during early differentiation of human embryonic stem cells. Cell Stem Cell 5, 214–226 [DOI] [PubMed] [Google Scholar]
- 35. Lian X., Hsiao C., Wilson G., Zhu K., Hazeltine L. B., Azarin S. M., Raval K. K., Zhang J., Kamp T. J., Palecek S. P. (2012) Robust cardiomyocyte differentiation from human pluripotent stem cells via temporal modulation of canonical Wnt signaling. Proc. Natl. Acad. Sci. U.S.A. 109,, E1848–E1857 [DOI] [PMC free article] [PubMed] [Google Scholar]
- 36. Xu X. Q., Graichen R., Soo S. Y., Balakrishnan T., Rahmat S. N., Sieh S., Tham S. C., Freund C., Moore J., Mummery C., Colman A., Zweigerdt R., Davidson B. P. (2008) Chemically defined medium supporting cardiomyocyte differentiation of human embryonic stem cells. Differentiation 76, 958–970 [DOI] [PubMed] [Google Scholar]
- 37. Cai J., Zhao Y., Liu Y., Ye F., Song Z., Qin H., Meng S., Chen Y., Zhou R., Song X., Guo Y., Ding M., Deng H. (2007) Directed differentiation of human embryonic stem cells into functional hepatic cells. Hepatology 45, 1229–1239 [DOI] [PubMed] [Google Scholar]
- 38. Zhuang S., Zhang Q., Zhuang T., Evans S. M., Liang X., Sun Y. (2013) Expression of Isl1 during mouse development. Gene Expr. Patterns 13, 407–412 [DOI] [PMC free article] [PubMed] [Google Scholar]
- 39. Shevchenko A., Tomas H., Havlis J., Olsen J. V., Mann M. (2006) In-gel digestion for mass spectrometric characterization of proteins and proteomes. Nat. Protoc. 1, 2856–2860 [DOI] [PubMed] [Google Scholar]
- 40. Zeiser J., Gerhard R., Just I., Pich A. (2013) Substrate specificity of clostridial glucosylating toxins and their function on colonocytes analyzed by proteomics techniques. J. Proteome Res. 12, 1604–1618 [DOI] [PubMed] [Google Scholar]
- 41. Cox J., Mann M. (2008) MaxQuant enables high peptide identification rates, individualized p.p.b.-range mass accuracies and proteome-wide protein quantification. Nat. Biotechnol. 26, 1367–1372 [DOI] [PubMed] [Google Scholar]
- 42. Cox J., Neuhauser N., Michalski A., Scheltema R. A., Olsen J. V., Mann M. (2011) Andromeda: a peptide search engine integrated into the MaxQuant environment. J. Proteome Res. 10, 1794–1805 [DOI] [PubMed] [Google Scholar]
- 43. R Development Core Team (2008) R: a language and environment for statistical computing, R Foundation for Statistical Computing, Vienna, Austria [Google Scholar]
- 44. Risso D., Schwartz K., Sherlock G., Dudoit S. (2011) GC-content normalization for RNA-Seq data. BMC Bioinformatics 12, 480. [DOI] [PMC free article] [PubMed] [Google Scholar]
- 45. Anders S., Huber W. (2010) Differential expression analysis for sequence count data. Genome Biol. 11, R106. [DOI] [PMC free article] [PubMed] [Google Scholar]
- 46. Huang d. W., Sherman B. T., Lempicki R. A. (2009) Systematic and integrative analysis of large gene lists using DAVID bioinformatics resources. Nat. Protoc. 4, 44–57 [DOI] [PubMed] [Google Scholar]
- 47. Mann M. (2006) Functional and quantitative proteomics using SILAC. Nat. Rev. Mol. Cell Biol. 7, 952–958 [DOI] [PubMed] [Google Scholar]
- 48. Ong S. E., Blagoev B., Kratchmarova I., Kristensen D. B., Steen H., Pandey A., Mann M. (2002) Stable isotope labeling by amino acids in cell culture, SILAC, as a simple and accurate approach to expression proteomics. Mol. Cell. Proteomics 1, 376–386 [DOI] [PubMed] [Google Scholar]
- 49. Graumann J., Hubner N. C., Kim J. B., Ko K., Moser M., Kumar C., Cox J., Scholer H., Mann M. (2008) Stable isotope labeling by amino acids in cell culture (SILAC) and proteome quantitation of mouse embryonic stem cells to a depth of 5,111 proteins. Mol. Cell. Proteomics 7, 672–683 [DOI] [PubMed] [Google Scholar]
- 50. Franceschini A., Szklarczyk D., Frankild S., Kuhn M., Simonovic M., Roth A., Lin J., Minguez P., Bork P., von Mering C., Jensen L. J. (2013) STRING v9.1: protein-protein interaction networks, with increased coverage and integration. Nucleic Acids Res. 41, D808–D815 [DOI] [PMC free article] [PubMed] [Google Scholar]
- 51. Petit V., Thiery J. P. (2000) Focal adhesions: structure and dynamics. Biol. Cell 92, 477–494 [DOI] [PubMed] [Google Scholar]
- 52. Hynes R. O. (2002) Integrins: bidirectional, allosteric signaling machines. Cell 110, 673–687 [DOI] [PubMed] [Google Scholar]
- 53. Miranti C. K., Brugge J. S. (2002) Sensing the environment: a historical perspective on integrin signal transduction. Nat. Cell Biol. 4, E83–E90 [DOI] [PubMed] [Google Scholar]
- 54. Couchman J. R., Woods A. (1999) Syndecan-4 and integrins: combinatorial signaling in cell adhesion. J. Cell Sci. 112(Pt 20), 3415–3420 [DOI] [PubMed] [Google Scholar]
- 55. Eliceiri B. P. (2001) Integrin and growth factor receptor crosstalk. Circ. Res. 89, 1104–1110 [DOI] [PubMed] [Google Scholar]
- 56. Mitra S. K., Hanson D. A., Schlaepfer D. D. (2005) Focal adhesion kinase: in command and control of cell motility. Nat. Rev. Mol. Cell Biol. 6, 56–68 [DOI] [PubMed] [Google Scholar]
- 57. Schaller M. D. (2001) Paxillin: a focal adhesion-associated adaptor protein. Oncogene 20, 6459–6472 [DOI] [PubMed] [Google Scholar]
- 58. Coll J. L., Ben Ze'ev A., Ezzell R. M., Rodriguez Fernandez J. L., Baribault H., Oshima R. G., Adamson E. D. (1995) Targeted disruption of vinculin genes in F9 and embryonic stem cells changes cell morphology, adhesion, and locomotion. Proc. Natl. Acad. Sci. U.S.A. 92, 9161–9165 [DOI] [PMC free article] [PubMed] [Google Scholar]
- 59. Yoshigi M., Hoffman L. M., Jensen C. C., Yost H. J., Beckerle M. C. (2005) Mechanical force mobilizes zyxin from focal adhesions to actin filaments and regulates cytoskeletal reinforcement. J. Cell Biol. 171, 209–215 [DOI] [PMC free article] [PubMed] [Google Scholar]
- 60. Harte M. T., Hildebrand J. D., Burnham M. R., Bouton A. H., Parsons J. T. (1996) p130Cas, a substrate associated with v-Src and v-Crk, localizes to focal adhesions and binds to focal adhesion kinase. J. Biol. Chem. 271, 13649–13655 [DOI] [PubMed] [Google Scholar]
- 61. Nagafuchi A. (2001) Molecular architecture of adherens junctions. Curr. Opin. Cell Biol. 13, 600–603 [DOI] [PubMed] [Google Scholar]
- 62. Harris T. J., Tepass U. (2010) Adherens junctions: from molecules to morphogenesis. Nat. Rev. Mol. Cell Biol. 11, 502–514 [DOI] [PubMed] [Google Scholar]
- 63. Kawano Y., Kypta R. (2003) Secreted antagonists of the Wnt signalling pathway. J. Cell Sci. 116, 2627–2634 [DOI] [PubMed] [Google Scholar]
- 64. Tetsu O., McCormick F. (1999) Beta-catenin regulates expression of cyclin D1 in colon carcinoma cells. Nature 398, 422–426 [DOI] [PubMed] [Google Scholar]
- 65. He T. C., Sparks A. B., Rago C., Hermeking H., Zawel L., da Costa L. T., Morin P. J., Vogelstein B., Kinzler K. W. (1998) Identification of c-MYC as a target of the APC pathway. Science 281, 1509–1512 [DOI] [PubMed] [Google Scholar]
- 66. Howe L. R., Crawford H. C., Subbaramaiah K., Hassell J. A., Dannenberg A. J., Brown A. M. (2001) PEA3 is up-regulated in response to Wnt1 and activates the expression of cyclooxygenase-2. J. Biol. Chem. 276, 20108–20115 [DOI] [PubMed] [Google Scholar]
- 67. Vallin J., Thuret R., Giacomello E., Faraldo M. M., Thiery J. P., Broders F. (2001) Cloning and characterization of three Xenopus slug promoters reveal direct regulation by Lef/beta-catenin signaling. J. Biol. Chem. 276, 30350–30358 [DOI] [PubMed] [Google Scholar]
- 68. Wielenga V. J., Smits R., Korinek V., Smit L., Kielman M., Fodde R., Clevers H., Pals S. T. (1999) Expression of CD44 in Apc and Tcf mutant mice implies regulation by the WNT pathway. Am. J. Pathol. 154, 515–523 [DOI] [PMC free article] [PubMed] [Google Scholar]
- 69. Mann B., Gelos M., Siedow A., Hanski M. L., Gratchev A., Ilyas M., Bodmer W. F., Moyer M. P., Riecken E. O., Buhr H. J., Hanski C. (1999) Target genes of beta-catenin-T cell-factor/lymphoid-enhancer-factor signaling in human colorectal carcinomas. Proc. Natl. Acad. Sci. U.S.A. 96, 1603–1608 [DOI] [PMC free article] [PubMed] [Google Scholar]
- 70. Gavert N., Conacci-Sorrell M., Gast D., Schneider A., Altevogt P., Brabletz T., Ben Ze'ev A. (2005) L1, a novel target of beta-catenin signaling, transforms cells and is expressed at the invasive front of colon cancers. J. Cell Biol. 168, 633–642 [DOI] [PMC free article] [PubMed] [Google Scholar]
- 71. Ye Y., Tian H., Lange A. R., Yearsley K., Robertson F. M., Barsky S. H. (2013) The genesis and unique properties of the lymphovascular tumor embolus are because of calpain-regulated proteolysis of E-cadherin. Oncogene 32, 1702–1713 [DOI] [PubMed] [Google Scholar]
- 72. Mayerle J., Schnekenburger J., Kruger B., Kellermann J., Ruthenburger M., Weiss F. U., Nalli A., Domschke W., Lerch M. M. (2005) Extracellular cleavage of E-cadherin by leukocyte elastase during acute experimental pancreatitis in rats. Gastroenterology 129, 1251–1267 [DOI] [PubMed] [Google Scholar]
- 73. Huguenin M., Muller E. J., Trachsel-Rosmann S., Oneda B., Ambort D., Sterchi E. E., Lottaz D. (2008) The metalloprotease meprinbeta processes E-cadherin and weakens intercellular adhesion. PLoS One 3, e2153. [DOI] [PMC free article] [PubMed] [Google Scholar]
- 74. Rios-Doria J., Day K. C., Kuefer R., Rashid M. G., Chinnaiyan A. M., Rubin M. A., Day M. L. (2003) The role of calpain in the proteolytic cleavage of E-cadherin in prostate and mammary epithelial cells. J. Biol. Chem. 278, 1372–1379 [DOI] [PubMed] [Google Scholar]
- 75. Rios-Doria J., Kuefer R., Ethier S. P., Day M. L. (2004) Cleavage of beta-catenin by calpain in prostate and mammary tumor cells. Cancer Res. 64, 7237–7240 [DOI] [PubMed] [Google Scholar]
- 76. Polakis P. (2000) Wnt signaling and cancer. Genes Dev. 14, 1837–1851 [PubMed] [Google Scholar]
- 77. Nath R., Raser K. J., Stafford D., Hajimohammadreza I., Posner A., Allen H., Talanian R. V., Yuen P., Gilbertsen R. B., Wang K. K. (1996) Non-erythroid alpha-spectrin breakdown by calpain and interleukin 1 beta-converting-enzyme-like protease(s) in apoptotic cells: contributory roles of both protease families in neuronal apoptosis. Biochem. J. 319(Pt 3), 683–690 [DOI] [PMC free article] [PubMed] [Google Scholar]
- 78. Franco S. J., Huttenlocher A. (2005) Regulating cell migration: calpains make the cut. J. Cell Sci. 118, 3829–3838 [DOI] [PubMed] [Google Scholar]
- 79. Jamora C., Fuchs E. (2002) Intercellular adhesion, signalling and the cytoskeleton. Nat. Cell Biol. 4, E101–E108 [DOI] [PubMed] [Google Scholar]
- 80. Heuberger J., Birchmeier W. (2010) Interplay of cadherin-mediated cell adhesion and canonical Wnt signaling. Cold Spring Harb. Perspect. Biol. 2, a002915. [DOI] [PMC free article] [PubMed] [Google Scholar]
- 81. Logan C. Y., Nusse R. (2004) The Wnt signaling pathway in development and disease. Annu. Rev. Cell Dev. Biol. 20, 781–810 [DOI] [PubMed] [Google Scholar]
- 82. Haga T., Uchide N., Tugizov S., Palefsky J. M. (2008) Role of E-cadherin in the induction of apoptosis of HPV16-positive CaSki cervical cancer cells during multicellular tumor spheroid formation. Apoptosis 13, 97–108 [DOI] [PubMed] [Google Scholar]
- 83. Benetti R., Copetti T., Dell'Orso S., Melloni E., Brancolini C., Monte M., Schneider C. (2005) The calpain system is involved in the constitutive regulation of beta-catenin signaling functions. J. Biol. Chem. 280, 22070–22080 [DOI] [PubMed] [Google Scholar]
- 84. Li G., Iyengar R. (2002) Calpain as an effector of the Gq signaling pathway for inhibition of Wnt/beta-catenin-regulated cell proliferation. Proc. Natl. Acad. Sci. U.S.A. 99, 13254–13259 [DOI] [PMC free article] [PubMed] [Google Scholar]
- 85. Abe K., Takeichi M. (2007) NMDA-receptor activation induces calpain-mediated beta-catenin cleavages for triggering gene expression. Neuron 53, 387–397 [DOI] [PubMed] [Google Scholar]
- 86. Xiao Y., Ye Y., Yearsley K., Jones S., Barsky S. H. (2008) The lymphovascular embolus of inflammatory breast cancer expresses a stem cell-like phenotype. Am. J. Pathol. 173, 561–574 [DOI] [PMC free article] [PubMed] [Google Scholar]
- 87. Reya T., Morrison S. J., Clarke M. F., Weissman I. L. (2001) Stem cells, cancer, and cancer stem cells. Nature 414, 105–111 [DOI] [PubMed] [Google Scholar]
- 88. Oliveros J. C. (2007) VENNY. An interactive tool for comparing lists with Venn diagrams. Available: http://bioinfogp.cnb.csic.es/tools/venny/ Accessed 27 September 2012
- 89. Marambaud P., Shioi J., Serban G., Georgakopoulos A., Sarner S., Nagy V., Baki L., Wen P., Efthimiopoulos S., Shao Z., Wisniewski T., Robakis N. K. (2002) A presenilin-1/gamma-secretase cleavage releases the E-cadherin intracellular domain and regulates disassembly of adherens junctions. EMBO J. 21, 1948–1956 [DOI] [PMC free article] [PubMed] [Google Scholar]
Associated Data
This section collects any data citations, data availability statements, or supplementary materials included in this article.