

Significance
Eye, hair, and skin pigmentation are highly variable in humans, particularly in western Eurasian populations. This diversity may be explained by population history, the relaxation of selection pressures, or positive selection. To investigate whether positive natural selection is responsible for depigmentation within Europe, we estimated the strength of selection acting on three genes known to have significant effects on human pigmentation. In a direct approach, these estimates were made using ancient DNA from prehistoric Europeans and computer simulations. This allowed us to determine selection coefficients for a precisely bounded period in the deep past. Our results indicate that strong selection has been operating on pigmentation-related genes within western Eurasia for the past 5,000 y.
Keywords: ancient DNA, computer simulations, natural selection, Neolithic/Bronze Age, Eastern Europe
Abstract
Pigmentation is a polygenic trait encompassing some of the most visible phenotypic variation observed in humans. Here we present direct estimates of selection acting on functional alleles in three key genes known to be involved in human pigmentation pathways—HERC2, SLC45A2, and TYR—using allele frequency estimates from Eneolithic, Bronze Age, and modern Eastern European samples and forward simulations. Neutrality was overwhelmingly rejected for all alleles studied, with point estimates of selection ranging from around 2–10% per generation. Our results provide direct evidence that strong selection favoring lighter skin, hair, and eye pigmentation has been operating in European populations over the last 5,000 y.
Genomic signatures of natural selection in humans are usually obtained from modern population genetic data and take the form of patterns of variation outside those expected under neutrality (1), including strong correlations between allele frequencies and hypothesized ecological drivers of selection (2) and identifying alleles with unusually recent age estimates for their frequencies (1). All such indirect approaches have poor sensitivity and temporal resolution, most are confounded by past demographic processes, and many are insensitive to selection acting on standing variation (3). With advances in ancient DNA analysis techniques it is possible to obtain direct estimates of natural selection over specific time periods by estimating allele frequency change, permitting changes in selection intensity to be detected through time and a more detailed understanding of the forces shaping human evolution. However, to date no such estimates have been made.
Pigmentation is a particularly conspicuous human phenotypic variation and in the past has been misleadingly used as a proxy for deep biogeographical origins (4). Dark pigmentation is thought to be the ancestral state in humans and to have been maintained by purifying selection in low-latitude, high-UVR regions to protect against folate photolysis, UV radiation (UVR)-induced DNA damage, and possibly damage to immunoglobulins (5, 6). Continental-scale correlations between skin pigmentation and incident UVR levels strongly indicate positive ecological adaptation (5), although sexual selection—particularly in relation to eye and hair coloration (7)—and relaxation of selective constraints (6) may also have been important.
Melanin, a derivative of tyrosine, is the primary biopolymer responsible for constitutive animal pigmentation and is found in two forms in humans, eumelanin (black-brown) and pheomelanin (red-yellow). It is synthesized in melanosomes, organelles located in melanocytes in several tissues including the basal layer of the epidermis, hair follicles, and the iris. Variation in pigmentation depends mainly on differences in the amount and type of melanin synthesized and the shape and distribution of melanosomes in different tissues (8). The products of several genes are involved in melanin synthesis and distribution, and known DNA polymorphism in those genes explains a substantial proportion of human pigmentation variation (9–12). Signatures of recent natural selection have been detected in some pigmentation genes, including both shared and regionally specific alleles associated with lighter skin pigmentation in eastern and western Eurasia (13, 14), using modern population genetic data (1, 12, 13, 15, 16).
To obtain direct estimates of the strength of natural selection driving depigmentation we analyzed three polymorphic sites in ancient and modern samples (Table 1) that had previously been identified through genome-wide association studies (GWAS) (1, 17) and fine-mapping SNP association (18) as influencing pigmentation in modern Europeans: HERC2 (rs12913832 A > G) (18), SLC45A2 (rs16891982 C > G) (13), and TYR (rs1042602 C > A) (11). The product of the TYR gene, tyrosinase, catalyzes the first two steps of the melanogenesis pathway (8), and its absence generates an epistatic mask on downstream pigment-coding genes, halting melanin production. The TYR SNP rs1042602 is highly polymorphic in Europeans, and the derived A allele has been associated with light skin (19) and eye color (20) and the absence of freckles (11). SLC45A2 (MATP) is involved in the distribution and intracellular processing of tyrosinase and other pigmentation enzymes (21). The derived rs16891982 G allele, which decreases in frequency along a north–south cline in Europe (13), is associated with lighter skin, hair, and eye pigmentation in modern populations (13, 22). The HERC2 SNP rs12913832 A > G is the main determinant of iris pigmentation (brown/blue) (18, 23) and is also associated with skin and hair pigmentation and the propensity to tan (24). It is located within an intron of the Hect Domain and RCC1-like Domain2 (HERC2) gene 21 kb upstream from the OCA2 promoter and serves as an enhancer for OCA2 expression (23, 25). OCA2 expression is increased in the melanocytes of carriers of the ancestral A allele, and attenuated in carriers of the derived G allele (25). OCA2 encodes a melanosomal transmembrane protein, protein P, which is involved in the trafficking and processing of tyrosinase, the regulation of melanosomal pH, and glutathione metabolism (26). Selection favoring the SLC45A2 rs16891982 G allele has been estimated to have begun between 11,000 and 19,000 y ago (14), well after the expansion of anatomically modern humans out-of-Africa. The age of the derived TYR rs1042602 allele has been estimated using two different methods: rho statistics place its emergence around 6,100 y ago, whereas the Bayesian coalescent approach using BEAST dates the allele to ∼15,600 y ago (27).
Table 1.
Allele frequencies of three functional SNPs associated with pigmentation in ancient and modern populations
| Derived allele frequency |
|||||||
| Gene | SNP | Polymorphism | Europe | Asia | Africa | Modern Ukrainian sample | Ancient sample |
| HERC2 | rs12913832 regulatory element (OCA2) | A > G | 0.710 [758] | 0.002 [572] | 0.000 [370] | 0.651 (0.546–0.744) [86] | 0.160 (0.099–0.247) [94] |
| SLC45A2 (MATP) | rs16891982 Leu374Phe | C > G | 0.970 [758] | 0.007 [572] | 0.000 [370] | 0.927 (0.849–0.965) [82] | 0.432 (0.296–0.578) [44] |
| TYR | rs1042602 Ser192Tyr | C > A | 0.368 [758] | 0.002 [572] | 0.000 [370] | 0.367 (0.279–0.466) [98] | 0.043 (0.018–0.106) [92] |
Modern allele frequencies are from 1000 Genomes (http://browser.1000genomes.org) (65). Range in parentheses indicates the equal-tailed 95% confidence interval calculated as described using the qbeta function in R (66). Numbers in square brackets indicate 2N individuals. The African American (ASW) data from 1000 Genomes were excluded because this population is admixed to an unknown extent.
However, these estimates were made by assuming that the selected allele arose at the time selection started and so do not accommodate the possibility of selection acting on standing variation (3). Furthermore, such estimates are themselves dependent on estimates of mutation and recombination rates. No estimates of the strength of selection or when it started to act on HERC2/OCA2 and TYR are available at present.
Results
Ancient DNA was retrieved from 63 out of 150 Eneolithic (ca. 6,500–5,000 y ago) and Bronze Age (ca. 5,000–4,000 y ago) samples from the Pontic–Caspian steppe, mainly from modern-day Ukraine. We used multiplex-PCR enrichment and next-generation sequencing to genotype the three pigmentation-associated SNPs (rs12913832, rs16891982, and rs1042602) and mtDNA hypervariable region 1 (HVR1) sequences plus 32 mtDNA coding region SNPs and a 9-bp-indel from these individuals (Tables S1 and S2). Consensus HVR1 sequences were successfully assembled from 60 individuals. Pigmentation gene data were obtained from 48 samples. We also genotyped the three pigmentation-associated SNPs in a sample of 60 modern Ukrainians (28) and observed an increase in frequency of all derived alleles between the ancient and modern samples from the same geographic region (Table 1 and Fig. S1). This implies that the pigmentation of the prehistoric population is likely to have differed from that of modern humans living in the same area. Modern frequencies of the derived alleles within all of Europe and outside of Europe are provided for comparison (Table 1).
Inferring natural selection based on temporal differences in allele frequency requires the assumption of population continuity. To this end we compared the 60 mtDNA HVR1 sequences obtained from our ancient sample to 246 homologous modern sequences (29–31) from the same geographic region and found low genetic differentiation (FST = 0.00551; P = 0.0663) (32). Coalescent simulations based on the mtDNA data, accommodating uncertainty in the ancient sample age, failed to reject population continuity under a wide range of assumed ancestral population size combinations (Fig. 1).
Fig. 1.

Probabilities of obtaining FST equal to or greater than that observed (0.00551) between 60 Eneolithic (ca. 6,500–5,000 y ago) and Bronze Age (ca. 5,000–4,000 y ago) samples from the Pontic–Caspian steppe, and a combined sample of 246 homologous modern sequences from the same geographic region, across a range of assumed ancestral population size combinations. Two phases of exponential growth were modeled, the first after the initial colonization of Europe 45,000 y ago, of assumed effective female population size NUP (y axis), and ending when farming began in the region considered 7,000 y ago, when the assumed effective female population size was NN (x axis), and the second leading up to the present, when the assumed effective female population size is 5,444,812. The initial colonizers of Europe were sampled from a constant ancestral African population of 5,000 effective females. Gray shaded areas indicate P values >0.05.
Conversely, continuity between early central European farmers and modern Europeans has been rejected in a previous study (33). However, the Eneolithic and Bronze Age sequences presented here are ∼500–2,000 y younger than the early Neolithic and belong to lineages identified both in early farmers and late hunter–gatherers from central Europe (33). A plausible explanation for this is that the prehistoric populations sampled in this study are a product of admixture between in situ hunter–gatherers and immigrant early farmers during the centuries after the arrival of farming, and that this admixture was a major process shaping modern patterns of mtDNA variation (34) and possibly also the variability observed in European hair, eye, and skin color.
To test whether the observed increases in the three light pigmentation-associated alleles can be explained by genetic drift alone or whether natural selection needs to be invoked, we performed forward computer simulations of drift plus selection, accommodating uncertainty in ancient and modern allele frequency, population size, and ancient sample age. We assumed codominance for both SLC45A2 rs16891982 G and TYR rs1042602 A alleles (22, 35) and that the derived HERC2 rs12913832 G allele is recessive (36). Using these simulations, neutrality (S = 0) was rejected under all assumed ancestral effective population sizes—ranging from 103 to 105 at the time of the ancient sample (SLC45A2 P < 1 × 10⁻⁵, TYR P < 2 × 10⁻⁵, and HERC2 P < 1 × 10⁻⁵). The values of selection acting on the SLC45A2 rs16891982 G allele, the TYR rs1042602 A allele, and the HERC2 rs12913832 G allele that best explained the observed derived allele frequency changes were 0.030, 0.026, and 0.036, respectively (Fig. 2). Whereas there is strong evidence that the derived HERC2 rs12913832 G allele is recessive (36), it is less clear whether the SLC45A2 and TYR derived alleles are codominant, recessive, or dominant (22, 35). Under the assumption that both SLC45A2 and TYR derived alleles are recessive, the selection values that best explain the observed changes in frequency are 0.022 and 0.104, respectively, and under the assumption that they are dominant the selection values are 0.088 and 0.016, respectively; again, neutrality was rejected for all three alleles (P < 4 × 10⁻⁵) under all ancestral population sizes modeled and all assumptions of dominance/codominance/recessivity (Fig. S2).
Fig. 2.
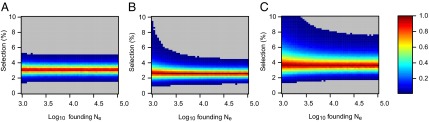
Two-tailed empirical P values for obtaining the observed (A) SLC45A2 G allele, (B) TYR A allele, and (C) HERC2 G allele frequency increase. P values were obtained by forward simulation of drift and natural selection across a range of assumed ancestral population sizes and selection coefficients, assuming exponential growth to a modern Ne of 4,845,710. The SLC45A2 rs16891982 G allele and the TYR rs1042602 A allele were assumed to be codominant. The HERC2 rs12913832 G allele was assumed to be recessive (values less than 0.01 are shaded gray).
Discussion
Our analysis indicates that positive selection on pigmentation variants associated with depigmented hair, skin, and eyes was still ongoing after the time period represented by our archaeological population, 6,500–4,000 y ago. This finding suggests that either the selection pressures that initiated the selective sweep during the Late Pleistocene or early Holocene were still operative or that a new selective environment had arisen in which depigmentation was favored for a different reason.
The high selection coefficients estimated for pigmentation genes HERC2, SLC45A2, and TYR are best understood in the context of estimates obtained for other recently selected loci. Using spatially explicit simulation and approximate Bayesian computation, selection on the LCT -13,910*T allele—which is strongly associated with lactase persistence in Europeans and southern Asians—was inferred to fall in the range 0.0259–0.0795 and to have begun around 7,500 y ago in the region between the Balkans and central Europe (37). However, another simulation-based study incorporating latitudinal effects on selection resulted in a lower estimate of S (0.008–0.018) (38). The selective advantage of the G6PD A− and Med deficiency alleles conferring resistance to malaria have been estimated at 0.019–0.048 and 0.014–0.049, respectively, in regions where malaria is endemic (39). These alleles are estimated to have arisen ∼6,357 y ago (G6PD A−) and 3,330 y ago (G6PD Med) (39). Thus, the estimates of S for the three pigmentation genes examined in this study are comparable to those for the most strongly selected loci in the human genome.
Although these estimated selection coefficients are high, they are comparable to previous estimates for genes in the pigmentation complex. The selective sweeps favoring the SLC45A2 derived allele, as well as the derived alleles of SNPs in SLC24A5 and TYRP1, which are also implicated in the lightening of skin pigmentation, are estimated to have begun between 11,000 and 19,000 y ago, after the separation of the ancestors of modern Europeans and East Asians (the ages of the selective sweeps affecting HERC2 and TYR have not yet been estimated) (14, 40). Beleza et al. (14) recently estimated the coefficient of selection at the SLC45A2 locus to be 0.05 under a dominant model of inheritance and 0.04 under an additive model. Selection favoring the derived alleles of SNPs in SLC24A5 and TYRP1 was found to be similarly strong.
Estimating selection coefficients using the ancient DNA-based simulation approach presented here offers considerable advantages over traditional methods based on allele age and frequency estimates (1): Selection coefficients are estimated over a defined period; selection acting on standing variation can be accommodated; and our approach is insensitive to the frequently unaccounted for uncertainties associated with allele age estimation using molecular or recombination clocks. This latter advantage is likely to result in considerable improvements in precision. However, our approach does require the assumption of population continuity and will not provide direct estimates of when a selective sweep began.
Although the strength of the selection coefficients in a certain time window can be estimated with improved precision using our ancient DNA-based simulation approach, the actual nature of the selection pressure remains unknown. However, temporal and geographical information from the prehistoric skeletal population under study can help in formulating reasonable hypotheses. Geographic variation in many functional skin pigmentation gene polymorphisms (13), and lighter skin pigmentation more generally, correlate strongly with distance from the equator in long-established populations, suggesting that selective pressure also occurred along a latitudinal gradient. The samples in our study were from between 42°N and 54°N, a latitudinal belt in which yearly average UVR is insufficient for vitamin D3 photosynthesis in highly melanized skin (4, 41). Constraints on the ability to photosynthesize vitamin D3 imposed by low incident UVR intensity may have provided significant selective pressure favoring lighter pigmentation populations in high-latitude regions such as the northern Pontic steppe belt. The need to admit UVB radiation to catalyze the synthesis of vitamin D3, together with the decreased danger of folate photolysis at higher latitudes, may account for the observed skin depigmentation from prehistoric to modern times in this region (5).
Dietary change during the Neolithization process may have reinforced selection pressure favoring depigmented skin. The individuals analyzed in this study lived ∼500–2,000 y after the arrival of farming in the region north of the Black Sea (42, 43). In many parts of Europe, the Mesolithic–Neolithic transition is associated with a switch from a vitamin D-rich aquatic or game-based hunter–gatherer diet (44) to a vitamin D-poor agriculturalist diet. In low-UV regimes such as the one prevailing in our study region, it is difficult to meet vitamin D requirements without the consumption of significant quantities of oily fish or animal liver (45, 46). The vitamin D recommended dietary allowance of 800–1,000 IU for adults requires the daily consumption of the equivalent of 100 g of wild salmon (the dietary input with the greatest measured vitamin D concentration). Isotopic evidence suggests that the populations sampled in our study continued to access aquatic resources, primarily river fish, in the Neolithic, Eneolithic, and Bronze Age, although there was considerable heterogeneity in fish consumption within the study region (47–50). However, any diminution in fish consumption may have been sufficient to generate additional selective pressure favoring depigmentation at this low-incident-UVR latitude.
Although ecological and environmental factors may be sufficient to explain the observed change in European skin pigmentation, these explanations are unlikely to hold for eye and hair color. The geographic distribution of iris and hair pigmentation variation does not conform as well to a latitudinal cline model, with much of the observed phenotypic variation restricted to Europe and closely related neighboring populations (51, 52). The blue iris phenotype characteristic of the HERC2 rs12913832 G allele, for example, is almost completely restricted to western Eurasia and some adjacent regions, its descendant populations, and populations containing European admixture (51, 52). It is possible that depigmented irises or the various human hair color morphs in Europeans are by-products of selection on skin pigmentation. There is evidence for gene–gene interaction within the polygenic system governing complex pigmentation traits; interactions between HERC2, OCA2, and MC1R, in particular, have been found to have a statistically significant effect on hair, iris, and skin color (36). There is also evidence for epistatic interactions between components of the melanin synthesis pathway in other mammalian model systems, including interactions between the products of ASIP, MC1R, and TYR (53). Additionally, many pigmentation genes, including TYR, HERC2, and SLC45A2 have pleiotropic effects on skin, hair, and eye color (11, 36).
Given that intraspecific pigmentation variability in other taxa, particularly avians, has been attributed to signaling and other factors associated with mate choice (54) it is possible that depigmented irises and the various hair colors observed in Europeans arose through sexual selection (7). Frequency-dependent sexual selection in favor of rare variants has been observed in vertebrates (55, 56), and such selection favoring rare pigmentation morphs could have driven alleles associated with lighter hair and eye colors to higher frequency. Once lighter hair and eye pigmentation phenotypes reached appreciable frequencies in European populations, these novel traits may have continued to be preferred as indicators of group membership, facilitating assortative mating. Assortative mating based on coloration is common in vertebrates (57), and skin pigmentation has been observed as a criterion for endogamy in modern human populations (58, 59). In addition, there is some evidence that lighter iris colors, because of their recessive mode of inheritance, may be preferred by males in assortative mating regimes to improve paternity confidence (60). Consistent with positive assortative mating, an exact test of Hardy–Weinberg equilibrium reveals an excess of HERC2 rs12913832 homozygotes in both the modern (P = 0.0543) and ancient (P = 0.0084) East European samples genotyped here (Table S3), despite the relatively small sample sizes.
The observed excess of HERC2 rs12913832 homozygotes in the ancient sample might be explained by population stratification in a temporally heterogeneous population sample. Although we do not observe any chronological or spatial patterning of the pigmentation markers in our prehistoric sample, we cannot exclude population stratification in the absence of additional neutral SNPs. However, we note that neither the TYR nor the SLC45A2 SNPs investigated here, nor three additional SNPs investigated in the same ancient and modern samples, showed any significant observable excess of homozygotes (Table S3), suggesting that the excess of HERC2 rs12913832 homozygotes is less likely to be due to population stratification.
In sum, a combination of selective pressures associated with living in northern latitudes, the adoption of an agriculturalist diet, and assortative mating may sufficiently explain the observed change from a darker phenotype during the Eneolithic/Early Bronze age to a generally lighter one in modern Eastern Europeans, although other selective factors cannot be discounted. The selection coefficients inferred directly from serially sampled data at these pigmentation loci range from 2 to 10% and are among the strongest signals of recent selection in humans.
Methods
Ancient DNA Extraction, Amplification, and Sequencing.
Sample information, detailed descriptions of DNA extraction, amplification, and sequencing methods as well as validation of the ancient DNA data are provided in Supporting Information owing to the extensive nature of the experimental setup.
Skeletal material from 150 Eneolithic and Bronze Age individuals from the west and north Pontic region were available for ancient DNA analyses. From all but one sample DNA was extracted twice independently using 0.5–1.0 g bone powder; 403 bp of the hypervariable region 1 [nucleotide positions (np) 16,011–16,413] were amplified using seven overlapping primer pairs (Table S4). They were integrated in a triple multiplex setup that included 32 clade-determining coding region SNPs and a 9-bp-indel (Table S5), as well as used in single-locus PCRs. rs12913832, rs16891982, and rs1042602 were amplified in a multiplex PCR together with 18 other nuclear loci (Table S4).
Sequencing of the PCR products was primarily done by 454 sequencing by GATC Biotech. Before that, samples were pooled according to a protocol modified after Meyer et al. (61). Raw data (454) were sorted by barcode and primer sequences of the multiplex PCRs and then analyzed with SeqMan ProTM (DNASTAR Lasergene 8, 9, and 10). For authentication purposes mitochondrial haplotypes are based on at least three, and SNP genotypes on at least four, independent amplification products from two extracts. In cases where the authentication scheme could not be fulfilled using the available 454 data, those loci were additionally amplified in single-locus PCRs, followed by direct sequencing after Sanger.
Population Genetic Analyses.
Continuity between Neolithic and present-day populations in the geographic region encompassing Bulgaria, Romania, Ukraine, and the southwest of the Russian Federation was tested by calculating the FST between ancient and modern observed mtDNA HVR1 samples (29–32) and comparing this with FSTs between ancient and modern DNA samples generated by coalescent simulation (33). These simulated DNA samples were generated using the program Fastsimcoal (62) under the null model of a single continuous population, using plausible population parameter ranges, and serial ancient and modern samples that replicated the observed sample numbers and dates. Details of the continuity test are provided in Supporting Information.
To test whether changes in HERC2 rs12913832 G, TYR rs1042602 A, or SLC45A2 rs16891982 G allele frequencies (Fig. S1) can be explained by genetic drift, or whether natural selection needs to be invoked, and to estimate the strength of natural selection where appropriate, we used a forward simulation approach. In each forward simulation we first drew the ancestral allele frequency estimate from a random Beta (np+1, nq+1) distribution, where np and nq were the number of ancestral and derived alleles observed in our ancient sample, respectively, to reflect uncertainty in ancestral allele frequencies. Then drift and natural selection were forward-simulated by binomial sampling across generations and using a standard selection equation (63), respectively. We assumed codominance for both SLC45A2 rs16891982 G and TYR rs1042602 A alleles (22, 35) and that the derived HERC2 rs12913832 G allele is recessive (36) (Fig. 2). However, although there is strong evidence that the derived HERC2 rs12913832 G allele is recessive (36), it is less clear whether the SLC45A2 and TYR derived alleles are codominant, recessive, or dominant (22, 35). For this reason we also performed the same simulations assuming both dominance and recessivity for the SLC45A2 and TYR derived alleles (Fig. S2). Exponential population growth was modeled from a range of values of Ne at the time of the ancient sample (50 equally spaced log10 values between 1,000 and 100,000) to a modern Ne of 4,845,710 (1/10 of the census population size of Ukraine in 2001, the year that the modern Ukrainian sample was collected; http://en.wikipedia.org/wiki/Demographics_of_Ukraine). The number of generations forward-simulated was drawn at random from a pool of 600,000 date estimates for the ancient samples reported here, generated by pooling each set of 10,000 date estimates for all 60 ancient samples. In the final generation of each forward simulation, simulated modern sample allele frequencies were picked from a random binomial with N equal to the modern sample size (HERC2 n = 86, SLC45A2 n = 82, and TYR n = 98). Forward simulations were repeated 100,000 times for each combination of the 50 assumed Ne values at the time the ancient sample and 50 selection coefficient (S) values, starting at zero. Finally, the simulated distribution of modern derived allele frequencies was compared with those observed using the equation 1 − 2 × |0.5 – P|, where P is the proportion of simulated modern allele frequencies that are greater than that observed. This yielded a two-tailed empirical P value for the observed allele frequency increase for each combination of the demographic and natural selection model parameters (64) (Fig. 2 and Fig. S2).
Supplementary Material
Acknowledgments
We thank all colleagues who contributed their archaeological knowledge and samples to this project, notably D. Agre, St. Alexandrov, V. Bubulici, A. N. Gei, A. A. Khokhlov, I. N. Klyuchneva, A. Kozak, N. Neradenko, A. V. Nikolova, V. P. Petrenko, Yu. Ya. Rassamakin, V. A. Romashko, S. N. Sanzharov, E. N. Sava, N. N. Shishlina, and D. Ya. Teslenko. We also thank Tom Gilbert and colleagues for giving us a hands-on introduction to bar coding and 454 sequencing workflow, and providing us with protocols. Thanks to Benjamin Rieger for his “sort3” perl script. The radiocarbon dates were provided by the Research Laboratory for Archaeology and the History of Art (University of Oxford), and financially supported by the Excellence Cluster 264 Topoi, Berlin. The authors acknowledge the use of the UCL Legion High Performance Computing Facility and associated support services in the completion of this work. The project was funded by German Federal Ministry of Education and Research Grant 01UA0809A.
Footnotes
The authors declare no conflict of interest.
This article is a PNAS Direct Submission. N.G.J. is a guest editor invited by the Editorial Board.
This article contains supporting information online at www.pnas.org/lookup/suppl/doi:10.1073/pnas.1316513111/-/DCSupplemental.
References
- 1.Sabeti PC, et al. International HapMap Consortium Genome-wide detection and characterization of positive selection in human populations. Nature. 2007;449(7164):913–918. doi: 10.1038/nature06250. [DOI] [PMC free article] [PubMed] [Google Scholar]
- 2.Coop G, Witonsky D, Di Rienzo A, Pritchard JK. Using environmental correlations to identify loci underlying local adaptation. Genetics. 2010;185(4):1411–1423. doi: 10.1534/genetics.110.114819. [DOI] [PMC free article] [PubMed] [Google Scholar]
- 3.Peter BM, Huerta-Sanchez E, Nielsen R. Distinguishing between selective sweeps from standing variation and from a de novo mutation. PLoS Genet. 2012;8(10):e1003011. doi: 10.1371/journal.pgen.1003011. [DOI] [PMC free article] [PubMed] [Google Scholar]
- 4.Jablonski NG, Chaplin G. The evolution of human skin coloration. J Hum Evol. 2000;39(1):57–106. doi: 10.1006/jhev.2000.0403. [DOI] [PubMed] [Google Scholar]
- 5.Jablonski NG, Chaplin G. Colloquium paper: Human skin pigmentation as an adaptation to UV radiation. Proc Natl Acad Sci USA. 2010;107(Suppl 2):8962–8968. doi: 10.1073/pnas.0914628107. [DOI] [PMC free article] [PubMed] [Google Scholar]
- 6.Harding RM, et al. Evidence for variable selective pressures at MC1R. Am J Hum Genet. 2000;66(4):1351–1361. doi: 10.1086/302863. [DOI] [PMC free article] [PubMed] [Google Scholar]
- 7.Darwin C. The Descent of Man, and Selection in Relation to Sex. London: John Murray; 1871. [Google Scholar]
- 8.Sturm RA, Teasdale RD, Box NF. Human pigmentation genes: Identification, structure and consequences of polymorphic variation. Gene. 2001;277(1-2):49–62. doi: 10.1016/s0378-1119(01)00694-1. [DOI] [PubMed] [Google Scholar]
- 9.Rees JL, Harding RM. Understanding the evolution of human pigmentation: Recent contributions from population genetics. J Invest Dermatol. 2012;132(3 Pt 2):846–853. doi: 10.1038/jid.2011.358. [DOI] [PubMed] [Google Scholar]
- 10.Myles S, Somel M, Tang K, Kelso J, Stoneking M. Identifying genes underlying skin pigmentation differences among human populations. Hum Genet. 2007;120(5):613–621. doi: 10.1007/s00439-006-0256-4. [DOI] [PubMed] [Google Scholar]
- 11.Sulem P, et al. Genetic determinants of hair, eye and skin pigmentation in Europeans. Nat Genet. 2007;39(12):1443–1452. doi: 10.1038/ng.2007.13. [DOI] [PubMed] [Google Scholar]
- 12.Lao O, de Gruijter JM, van Duijn K, Navarro A, Kayser M. Signatures of positive selection in genes associated with human skin pigmentation as revealed from analyses of single nucleotide polymorphisms. Ann Hum Genet. 2007;71(Pt 3):354–369. doi: 10.1111/j.1469-1809.2006.00341.x. [DOI] [PubMed] [Google Scholar]
- 13.Norton HL, et al. Genetic evidence for the convergent evolution of light skin in Europeans and East Asians. Mol Biol Evol. 2007;24(3):710–722. doi: 10.1093/molbev/msl203. [DOI] [PubMed] [Google Scholar]
- 14.Beleza S, et al. The timing of pigmentation lightening in Europeans. Mol Biol Evol. 2013;30(1):24–35. doi: 10.1093/molbev/mss207. [DOI] [PMC free article] [PubMed] [Google Scholar]
- 15.Alonso S, et al. Complex signatures of selection for the melanogenic loci TYR, TYRP1 and DCT in humans. BMC Evol Biol. 2008;8:74. doi: 10.1186/1471-2148-8-74. [DOI] [PMC free article] [PubMed] [Google Scholar]
- 16.Chen H, Patterson N, Reich D. Population differentiation as a test for selective sweeps. Genome Res. 2010;20(3):393–402. doi: 10.1101/gr.100545.109. [DOI] [PMC free article] [PubMed] [Google Scholar]
- 17.Sulem P, et al. Two newly identified genetic determinants of pigmentation in Europeans. Nat Genet. 2008;40(7):835–837. doi: 10.1038/ng.160. [DOI] [PubMed] [Google Scholar]
- 18.Eiberg H, et al. Blue eye color in humans may be caused by a perfectly associated founder mutation in a regulatory element located within the HERC2 gene inhibiting OCA2 expression. Hum Genet. 2008;123(2):177–187. doi: 10.1007/s00439-007-0460-x. [DOI] [PubMed] [Google Scholar]
- 19.Shriver MD, et al. Skin pigmentation, biogeographical ancestry and admixture mapping. Hum Genet. 2003;112(4):387–399. doi: 10.1007/s00439-002-0896-y. [DOI] [PubMed] [Google Scholar]
- 20.Frudakis T, et al. Sequences associated with human iris pigmentation. Genetics. 2003;165(4):2071–2083. doi: 10.1093/genetics/165.4.2071. [DOI] [PMC free article] [PubMed] [Google Scholar]
- 21.Costin GE, Valencia JC, Vieira WD, Lamoreux ML, Hearing VJ. Tyrosinase processing and intracellular trafficking is disrupted in mouse primary melanocytes carrying the underwhite (uw) mutation. A model for oculocutaneous albinism (OCA) type 4. J Cell Sci. 2003;116(Pt 15):3203–3212. doi: 10.1242/jcs.00598. [DOI] [PubMed] [Google Scholar]
- 22.Cook AL, et al. Analysis of cultured human melanocytes based on polymorphisms within the SLC45A2/MATP, SLC24A5/NCKX5, and OCA2/P loci. J Invest Dermatol. 2009;129(2):392–405. doi: 10.1038/jid.2008.211. [DOI] [PubMed] [Google Scholar]
- 23.Sturm RA, et al. A single SNP in an evolutionary conserved region within intron 86 of the HERC2 gene determines human blue-brown eye color. Am J Hum Genet. 2008;82(2):424–431. doi: 10.1016/j.ajhg.2007.11.005. [DOI] [PMC free article] [PubMed] [Google Scholar]
- 24.Han J, et al. A genome-wide association study identifies novel alleles associated with hair color and skin pigmentation. PLoS Genet. 2008;4(5):e1000074. doi: 10.1371/journal.pgen.1000074. [DOI] [PMC free article] [PubMed] [Google Scholar]
- 25.Visser M, Kayser M, Palstra R-J. HERC2 rs12913832 modulates human pigmentation by attenuating chromatin-loop formation between a long-range enhancer and the OCA2 promoter. Genome Res. 2012;22(3):446–455. doi: 10.1101/gr.128652.111. [DOI] [PMC free article] [PubMed] [Google Scholar]
- 26.Donnelly MP, et al. A global view of the OCA2-HERC2 region and pigmentation. Hum Genet. 2012;131(5):683–696. doi: 10.1007/s00439-011-1110-x. [DOI] [PMC free article] [PubMed] [Google Scholar]
- 27.Hudjashov G, Villems R, Kivisild T. Global patterns of diversity and selection in human tyrosinase gene. PLoS ONE. 2013;8(9):e74307. doi: 10.1371/journal.pone.0074307. [DOI] [PMC free article] [PubMed] [Google Scholar]
- 28.Nadkarni NA, Weale ME, von Schantz M, Thomas MG. Evolution of a length polymorphism in the human PER3 gene, a component of the circadian system. J Biol Rhythms. 2005;20(6):490–499. doi: 10.1177/0748730405281332. [DOI] [PubMed] [Google Scholar]
- 29.Malyarchuk BA, Derenko MV. Mitochondrial DNA variability in Russians and Ukrainians: Implication to the origin of the Eastern Slavs. Ann Hum Genet. 2001;65(Pt 1):63–78. doi: 10.1046/j.1469-1809.2001.6510063.x. [DOI] [PubMed] [Google Scholar]
- 30.Malyarchuk BA, et al. Mitochondrial DNA variability in Poles and Russians. Ann Hum Genet. 2002;66(Pt 4):261–283. doi: 10.1017/S0003480002001161. [DOI] [PubMed] [Google Scholar]
- 31.Calafell F, Underhill P, Tolun A, Angelicheva D, Kalaydjieva L. From Asia to Europe: Mitochondrial DNA sequence variability in Bulgarians and Turks. Ann Hum Genet. 1996;60(Pt 1):35–49. doi: 10.1111/j.1469-1809.1996.tb01170.x. [DOI] [PubMed] [Google Scholar]
- 32.Excoffier L, Smouse PE, Quattro JM. Analysis of molecular variance inferred from metric distances among DNA haplotypes: Application to human mitochondrial DNA restriction data. Genetics. 1992;131(2):479–491. doi: 10.1093/genetics/131.2.479. [DOI] [PMC free article] [PubMed] [Google Scholar]
- 33.Bramanti B, et al. Genetic discontinuity between local hunter-gatherers and central Europe’s first farmers. Science. 2009;326(5949):137–140. doi: 10.1126/science.1176869. [DOI] [PubMed] [Google Scholar]
- 34.Bollongino R, et al. 2000 years of parallel societies in Stone Age Central Europe. Science. 2013;342(6157):479–481. doi: 10.1126/science.1245049. [DOI] [PubMed] [Google Scholar]
- 35.Stokowski RP, et al. A genomewide association study of skin pigmentation in a South Asian population. Am J Hum Genet. 2007;81(6):1119–1132. doi: 10.1086/522235. [DOI] [PMC free article] [PubMed] [Google Scholar]
- 36.Branicki W, Brudnik U, Wojas-Pelc A. Interactions between HERC2, OCA2 and MC1R may influence human pigmentation phenotype. Ann Hum Genet. 2009;73(2):160–170. doi: 10.1111/j.1469-1809.2009.00504.x. [DOI] [PubMed] [Google Scholar]
- 37.Itan Y, Powell A, Beaumont MA, Burger J, Thomas MG. The origins of lactase persistence in Europe. PLOS Comput Biol. 2009;5(8):e1000491. doi: 10.1371/journal.pcbi.1000491. [DOI] [PMC free article] [PubMed] [Google Scholar]
- 38.Gerbault P, Moret C, Currat M, Sanchez-Mazas A. Impact of selection and demography on the diffusion of lactase persistence. PLoS ONE. 2009;4(7):e6369. doi: 10.1371/journal.pone.0006369. [DOI] [PMC free article] [PubMed] [Google Scholar]
- 39.Tishkoff SA, et al. Haplotype diversity and linkage disequilibrium at human G6PD: Recent origin of alleles that confer malarial resistance. Science. 2001;293(5529):455–462. doi: 10.1126/science.1061573. [DOI] [PubMed] [Google Scholar]
- 40.Soejima M, Tachida H, Ishida T, Sano A, Koda Y. Evidence for recent positive selection at the human AIM1 locus in a European population. Mol Biol Evol. 2006;23(1):179–188. doi: 10.1093/molbev/msj018. [DOI] [PubMed] [Google Scholar]
- 41.Jablonski NG, Chaplin G. Human skin pigmentation, migration and disease susceptibility. Philos Trans R Soc Lond B Biol Sci. 2012;367(1590):785–792. doi: 10.1098/rstb.2011.0308. [DOI] [PMC free article] [PubMed] [Google Scholar]
- 42.Kotova N. The Neolithization of Northern Black Sea area in the context of climate changes. Documenta Praehistorica. 2009;36:159–174. [Google Scholar]
- 43.Kotova N, Makhortykh S. Human adaptation to past climate changes in the northern Pontic steppe. Quat Int. 2010;220(1-2):88–94. [Google Scholar]
- 44.Richards MP, Schulting RJ, Hedges RE. Archaeology: Sharp shift in diet at onset of Neolithic. Nature. 2003;425(6956):366. doi: 10.1038/425366a. [DOI] [PubMed] [Google Scholar]
- 45.Lu Z, et al. An evaluation of the vitamin D3 content in fish: Is the vitamin D content adequate to satisfy the dietary requirement for vitamin D? J Steroid Biochem Mol Biol. 2007;103(3-5):642–644. doi: 10.1016/j.jsbmb.2006.12.010. [DOI] [PMC free article] [PubMed] [Google Scholar]
- 46.Holick MF. Sunlight and vitamin D for bone health and prevention of autoimmune diseases, cancers, and cardiovascular disease. Am J Clin Nutr. 2004;80(6) Suppl:1678S–1688S. doi: 10.1093/ajcn/80.6.1678S. [DOI] [PubMed] [Google Scholar]
- 47.Lillie M, Budd C, Potekhina I. Stable isotope analysis of prehistoric populations from the cemeteries of the Middle and Lower Dnieper Basin, Ukraine. J Archaeol Sci. 2011;38(1):57–68. [Google Scholar]
- 48.Lillie MC, Richards M. Stable isotope analysis and dental evidence of diet at the Mesolithic–Neolithic transition in Ukraine. J Archaeol Sci. 2000;27(10):965–972. [Google Scholar]
- 49.Shishlina NI, et al. Paleoecology, subsistence, and C-14 chronology of the Eurasian Caspian Steppe Bronze Age. Radiocarbon. 2009;51(2):481–499. [Google Scholar]
- 50.Hollund HI, Higham T, Belinskij A, Korenevskij S. Investigation of palaeodiet in the North Caucasus (South Russia) Bronze Age using stable isotope analysis and AMS dating of human and animal bones. J Archaeol Sci. 2010;37(12):2971–2983. [Google Scholar]
- 51.Sturm RA, Frudakis TN. Eye colour: Portals into pigmentation genes and ancestry. Trends Genet. 2004;20(8):327–332. doi: 10.1016/j.tig.2004.06.010. [DOI] [PubMed] [Google Scholar]
- 52.Walsh S, et al. The HIrisPlex system for simultaneous prediction of hair and eye colour from DNA. Forensic Sci Int Genet. 2013;7(1):98–115. doi: 10.1016/j.fsigen.2012.07.005. [DOI] [PubMed] [Google Scholar]
- 53.Phillips PC. Epistasis—the essential role of gene interactions in the structure and evolution of genetic systems. Nat Rev Genet. 2008;9(11):855–867. doi: 10.1038/nrg2452. [DOI] [PMC free article] [PubMed] [Google Scholar]
- 54.Dale J. Intraspecific variation in coloration. Bird Coloration. 2006;2:36–86. [Google Scholar]
- 55.Hughes KA, Houde AE, Price AC, Rodd FH. Mating advantage for rare males in wild guppy populations. Nature. 2013;503(7474):108–110. doi: 10.1038/nature12717. [DOI] [PubMed] [Google Scholar]
- 56.Farr JA. Male rarity or novelty, female choice behavior, and sexual selection in the guppy, Poecilia reticulata Peters (Pisces: Poeciliidae) Evolution. 1977;31(1):162–168. doi: 10.1111/j.1558-5646.1977.tb00993.x. [DOI] [PubMed] [Google Scholar]
- 57.Hofreiter M, Schöneberg T. The genetic and evolutionary basis of colour variation in vertebrates. Cell Mol Life Sci. 2010;67(15):2591–2603. doi: 10.1007/s00018-010-0333-7. [DOI] [PMC free article] [PubMed] [Google Scholar]
- 58.Banerjee S. Assortative mating for colour in Indian populations. J Biosoc Sci. 1985;17(2):205–209. doi: 10.1017/s0021932000015650. [DOI] [PubMed] [Google Scholar]
- 59.Roberts DF, Kahlon DP. Skin pigmentation and assortative mating in Sikhs. J Biosoc Sci. 1972;4(1):91–100. doi: 10.1017/s002193200000835x. [DOI] [PubMed] [Google Scholar]
- 60.Laeng B, Mathisen R, Johnsen J-A. Why do blue-eyed men prefer women with the same eye color? Behav Ecol Sociobiol. 2007;61(3):371–384. [Google Scholar]
- 61.Meyer M, Stenzel U, Hofreiter M. Parallel tagged sequencing on the 454 platform. Nat Protoc. 2008;3(2):267–278. doi: 10.1038/nprot.2007.520. [DOI] [PubMed] [Google Scholar]
- 62.Excoffier L, Foll M. fastsimcoal: A continuous-time coalescent simulator of genomic diversity under arbitrarily complex evolutionary scenarios. Bioinformatics. 2011;27(9):1332–1334. doi: 10.1093/bioinformatics/btr124. [DOI] [PubMed] [Google Scholar]
- 63.Maynard Smith J. Evolutionary Genetics. 2nd Ed. New York: Oxford Univ Press; 1998. [Google Scholar]
- 64.Voight BF, et al. Interrogating multiple aspects of variation in a full resequencing data set to infer human population size changes. Proc Natl Acad Sci USA. 2005;102(51):18508–18513. doi: 10.1073/pnas.0507325102. [DOI] [PMC free article] [PubMed] [Google Scholar]
- 65.The 1000 Genomes Project Consortium An integrated map of genetic variation from 1,092 human genomes. Nature. 2012;491(7422):56–65. doi: 10.1038/nature11632. [DOI] [PMC free article] [PubMed] [Google Scholar]
- 66.R Core Team . R: A Language and Environment for Statistical Computing. Vienna: R Foundation for Statistical Computing; 2012. [Google Scholar]
Associated Data
This section collects any data citations, data availability statements, or supplementary materials included in this article.