

ABSTRACT
The relationship between the selection affecting codon usage and selection on protein sequences of orthologous genes in diverse groups of bacteria and archaea was examined by using the Alignable Tight Genome Clusters database of prokaryote genomes. The codon usage bias is generally low, with 57.5% of the gene-specific optimal codon frequencies (Fopt) being below 0.55. This apparent weak selection on codon usage contrasts with the strong purifying selection on amino acid sequences, with 65.8% of the gene-specific dN/dS ratios being below 0.1. For most of the genomes compared, a limited but statistically significant negative correlation between Fopt and dN/dS was observed, which is indicative of a link between selection on protein sequence and selection on codon usage. The strength of the coupling between the protein level selection and codon usage bias showed a strong positive correlation with the genomic GC content. Combined with previous observations on the selection for GC-rich codons in bacteria and archaea with GC-rich genomes, these findings suggest that selection for translational fine-tuning could be an important factor in microbial evolution that drives the evolution of genome GC content away from mutational equilibrium. This type of selection is particularly pronounced in slowly evolving, “high-status” genes. A significantly stronger link between the two aspects of selection is observed in free-living bacteria than in parasitic bacteria and in genes encoding metabolic enzymes and transporters than in informational genes. These differences might reflect the special importance of translational fine-tuning for the adaptability of gene expression to environmental changes. The results of this work establish the coupling between protein level selection and selection for translational optimization as a distinct and potentially important factor in microbial evolution.
IMPORTANCE
Selection affects the evolution of microbial genomes at many levels, including both the structure of proteins and the regulation of their production. Here we demonstrate the coupling between the selection on protein sequences and the optimization of codon usage in a broad range of bacteria and archaea. The strength of this coupling varies over a wide range and strongly and positively correlates with the genomic GC content. The cause(s) of the evolution of high GC content is a long-standing open question, given the universal mutational bias toward AT. We propose that optimization of codon usage could be one of the key factors that determine the evolution of GC-rich genomes. This work establishes the coupling between selection at the level of protein sequence and at the level of codon choice optimization as a distinct aspect of genome evolution.
INTRODUCTION
The amino acid sequences of the great majority of proteins evolve under the pressure of purifying selection that can be measured through the ratio of the rates of nonsynonymous and synonymous substitutions (dN/dS) in protein-coding sequences (1–4). The strength of purifying selection shows broad variation between sites within a protein-coding gene, between genes within an evolving genome, and between evolving genomes in different organismal lineages (5–8). Generally, purifying selection is strong in organisms with large effective population sizes, such as bacteria, but substantially weaker in organisms with small effective population sizes, such as multicellular eukaryotes (9, 10). Within a bacterial or archaeal genome, which typically encompasses between 1,000 and 10,000 protein-coding genes, the dN/dS ratio varies within approximately 2 orders of magnitude, from ~0.01 to ~1.00, with the mean and median of the distribution being close to 0.1 (11–13). Furthermore, comparative analysis of the dN/dS ratios across a broad range of bacterial and archaeal genomes that were collected in the database of Alignable Tight Genome Clusters (ATGC) (14) has shown that the median dN/dS ratio is stable within each ATGC but differs between ATGC, with the implication that this ratio is a robust, lineage-specific gauge of purifying selection (12).
The use of dN/dS as a measure of selection on protein sequences is based on the assumption that synonymous substitutions are neutral. This assumption can be a reasonable approximation inasmuch as selection affecting nonsynonymous sites is substantially stronger than that affecting synonymous sites. However, it is well established that synonymous sites in protein-coding sequences actually are subject to selection driven by at least two factors, RNA secondary structure and codon usage (15–18). The study of codon usage bias (CUB) is a long-standing direction in molecular evolution. Two fundamentally different but not mutually exclusive types of explanations for the existence of CUB have been explored, namely, mutational (neutral) and selectional origins. The important contribution of neutral mutational processes is suggested by the observations that GC content is the variable that best explains the interspecies differences in codon usage (19, 20). Moreover, it has been shown that CUB in bacteria could be predicted from the nucleotide composition of intergenic regions (20). However, there are also multiple strong indications of the important role of selection in the evolution of codon usage. The key early observations, made primarily on classical model organisms, the bacterium Escherichia coli, and the yeast Saccharomyces cerevisiae, are compatible with the selectionist but not the neutral hypothesis: CUB is particularly strong in highly expressed genes, and the usage of a particular codon strongly correlates with the abundance of the cognate tRNAs (21–25).
Subsequent research in this area to a large extent concentrated on the nature and strength of the selection that affects CUB (26, 27). It has been reported that in enterobacteria, CUB is strongly and negatively correlated with the synonymous evolution rate, i.e., genes with strong CUB typically evolve slowly; in contrast, little correlation was detected between CUB and the rate of protein evolution (28, 29). However, a more recent analysis of a range of model organisms, including E. coli and several eukaryotes, has revealed roughly the same strength of inverse correlation between CUB and dN compared to dS (30). Hartl and colleagues applied population genetic theory to estimate the selection coefficient on synonymous codon positions in enterobacteria and arrived at values on the order of 10−9, indicative of weak selection that, however, could be consequential in large bacterial populations (31).
Two major factors underlying selection for CUB have been considered, namely, accuracy and rate of translation. The importance of translation accuracy was first suggested by experimental data indicating that codon choice strongly affected the rate of amino acid misincorporation during translation (32–34). Subsequently, it has been demonstrated that evolutionarily conserved amino acid sites showed a significantly stronger CUB than variable sites, as one would expect if selection acted to minimize the effect of amino acid misincorporation (35, 36). However, there are also substantial indications that selection for an increased rate or, more precisely, efficiency of translation contributes to the evolution of CUB. Indeed, optimal codons appear to be translated faster than suboptimal ones (37). Although this difference might not substantially affect the actual rate of protein production, which appears to be determined primarily by the rate of translation initiation (38), acceleration of elongation increases the supply of free ribosomes, a growth rate-limiting parameter in bacteria (26, 39). Indeed, a strong inverse correlation between codon bias and bacterial generation time has been detected, suggesting that the use of optimal codons is essential for fast growth (40–42). tRNA modifications also enhance translation speed and/or accuracy in different codon groups (43). A recent analysis of the codon usage of yeast took advantage of ribosome profiling data to show that optimal codons were actually not translated faster than suboptimal codons in vivo (44). Instead, it has been shown that, under conditions of tRNA shortage, the primary determinant of translation efficiency was the usage of codons proportional to the abundance of the cognate tRNAs (44). Analysis of codon usage in diverse bacteria by a recently developed statistical method yielded indications that selection for translation efficiency made a substantially greater contribution to the evolution of CUB than selection for translation accuracy (45).
The regulatory effects of CUB on cellular processes are likely to be multifaceted and remain only partially explored. For example, a recent study of the expression of bacterial operons that encode protein complexes with uneven subunit stoichiometry has shown that CUB is a key factor that provides for higher expression of the more abundant subunits (46).
Overall, the current view of CUB evolution centers around the selection-mutation-drift model, according to which there is (relatively) weak selection for preferred (major or optimal) codons but nonpreferred codons persist owing to mutational bias and genetic drift (26, 47–49). The strength of selection on CUB appears to vary broadly both across genes and across species, and translation accuracy and translation efficiency are both subject to selection, although the relative contributions of these two factors remain a matter of debate.
We were interested in exploring the connection between selection on CUB and selection on protein sequences. Generally, one would expect that the selective pressures at the two levels are coupled, given that high-expression genes, on the one hand, show a greater CUB than low-expression genes (21–25) and, on the other hand, on average evolve slowly (50–53).
However, previous studies have not resulted in certainty with regard to the existence and strength of this coupling, largely because CUB (measured as the fraction of optimal codons, Fopt) has been shown to depend similarly on dS and dN, with both dependencies thought to be uniformly gauged by the effective population size of an organism (30).
We performed a broad survey of the correlations between dN/dS and Fopt in bacteria and archaea, taking advantage of the database of ATGC, which encompasses groups of closely related genomes across the diversity of bacteria and archaea (14). We find that there is a nearly universal inverse correlation between these two variables; i.e., the two levels of selection are coupled. The strength of this coupling depends on the genomic GC content, suggesting that fine-tuning of translation efficiency and fidelity, especially in highly expressed genes, is an important factor in the evolution of the GC content of microbial genomes away from mutational equilibrium.
RESULTS
Universal coupling between selection on codon usage and selection on amino acid sequences and its dependence on genomic GC content.
We first calculated the Fopt value and the dN/dS ratio of each pair of orthologous genes in a randomly selected pair of genomes from each ATGC (or the only pair for the ATGC consisting of two genomes; see Materials and Methods for details). The CUB was found to be relatively low, with Fopt being below 0.55 for 57.5% of the genes (Fig. 1). This relatively weak selection on codon usage contrasts with the typically strong purifying selection on amino acid sequences, with 65.8% of the dN/dS ratios being below 0.10 (Fig. 1).
FIG 1 .


Quantitative characteristics of genome evolution of the 120 ATGC analyzed. R is the Spearman rank coefficient of correlation between Fopt and dN/dS in an ATGC. Column P includes the P values of R for each ATGC. Fopt is the median Fopt in an ATGC. dN/dS is the median dN/dS ratio in an ATGC. GS is the genome size of sample species. GC% is the GC content of sample species. deltaGC stands for ΔGC (see Results). The color code is explained at the bottom.
For the substantial majority of the 120 ATGC analyzed, a statistically significant negative correlation between the gene-specific Fopt value and the dN/dS ratio was detected (Fig. 1). As shown previously, the genome-wide median dN/dS ratio is a stable characteristic of an ATGC (12). Therefore, we used the median dN/dS ratios and Fopt values of all of the genes in each ATGC (that is, of a random pair of genomes in the case of a large ATGC) as ATGC properties; for the sake of simplicity, here we use dN/dS and Fopt to denote these median values. The dN/dS and Fopt values of the 120 ATGC showed a limited but statistically significant negative correlation (Fig. 2; Spearman’s ρ = −0.251, P = 0.0058 [Spearman test]; here we denote this correlation coefficient R). Thus, the generally expected coupling between selection at the level of protein sequences and selection at the level of codon usage indeed seems to exist across a broad range of bacterial and archaeal genomes.
FIG 2 .

Correlation between the genomic median dN/dS and Fopt values of the 120 ATGC.
Having established the existence of the coupling between the two levels of selection, we sought to identify its possible underlying causes. Given that codon usage depends strongly on genomic GC content, which itself is strongly positively correlated with genome size (GS) (54) (Fig. 3, Spearman’s ρ = 0.661, P < 2.2e-16), we turned to principal-component analysis (PCA) with five variables, dN/dS, Fopt, R, GS, and GC content (GC%). The first principal component explained more than half of the variation in the data, with the main contributions, with opposite signs, coming from GC content and R (Fig. 4). However, GS also makes a substantial contribution to principal component 1, conceivably because of the strong correlation between GC content and GS (Fig. 3). Principal component 2, which explains 22.5% of the data variance, reflects primarily the opposite contributions of Fopt and dN/dS, in agreement with the observed negative correlation (Fig. 2 and 3).
FIG 3 .
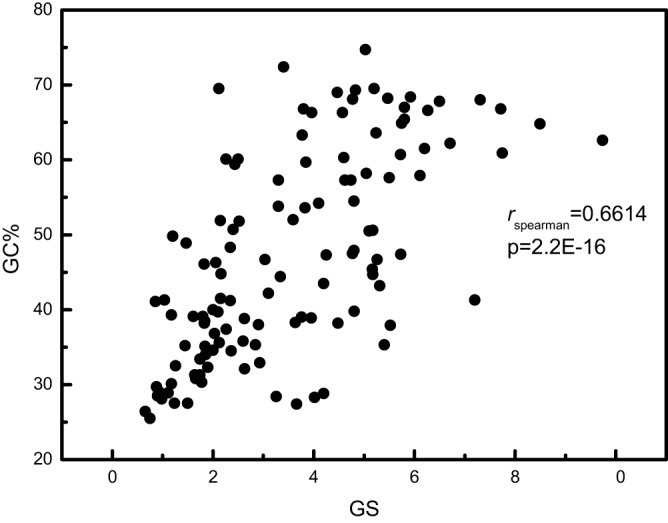
Correlation between the GC contents and GSs of the 120 ATGC. GSs are in megabases.
FIG 4 .

PCA of the 120 ATGC in the space of five variables, dN/dS, Fopt, R, GC content, and GS.
Pairwise correlation analysis showed that by far the strongest correlation exists between GC content and R (Fig. 5a), followed by the correlation between GS and R (Fig. 5b). Notably, the median dN/dS showed a relatively weak, albeit significant, negative correlation with GC content and GS (Fig. 5c and d), whereas there was no significant correlation between Fopt and either of these genomic characteristics (Fig. 5e and f). The peculiar, U-shaped dependence of Fopt on GC content most likely reflects the paucity of codon choices in extremely AT-rich and extremely GC-rich genomes, resulting in an inflation of Fopt values that does not reflect selective processes. Thus, the strong dependence of R on GC content appears to be a distinct phenomenon, with the implication that coupling between selection on protein sequence and selection on codon usage is a selectable trait in itself.
FIG 5 .

Pairwise correlation analysis of the five variables in the 120 ATGC. (a) R versus GC content. (b) R versus GS. (c) dN/dS versus GC content. (d) dN/dS versus GS. (e) Fopt versus GC content. (f) Fopt versus GS. GSs are in megabases.
To further explore the potential biological underpinning of the strong connection between R and genomic GC content, we used the parameter ΔGC, which was defined as the difference in GC content between optimal and nonoptimal codons as follows:
Here the sum is taken over 18 amino acids with more than one codon for all of the orthologous gene pairs in a given ATGC; and are the frequencies of the optimal and nonoptimal codons of amino acid i, respectively; and are, respectively, the GC contents of the optimal and nonoptimal codons of amino acid i; is the mean of all nonoptimal codes for amino acid i This parameter was designed to reflect the strength of selection for increased GC content in the optimal codon that could underlie the strong correlation between R and GC content. When the ΔGC values were plotted against the GC content for the 120 ATGC, a peculiar, nonmonotonic dependence was observed (Fig. 6). Whereas for low-GC genomes, ΔGC slightly decreased with the GC content, upward of ~45% GC, a steady increase in ΔGC was observed (Fig. 6). The small effect at a low GC content is likely to be purely statistical, caused by the strong bias toward AT. In contrast, at a high GC content, there seems to be strong selection for increased GC content of the optimal codons. Thus, the selection on codon bias indeed appears to be particularly pronounced in bacteria and archaea with GC-rich genomes.
FIG 6 .
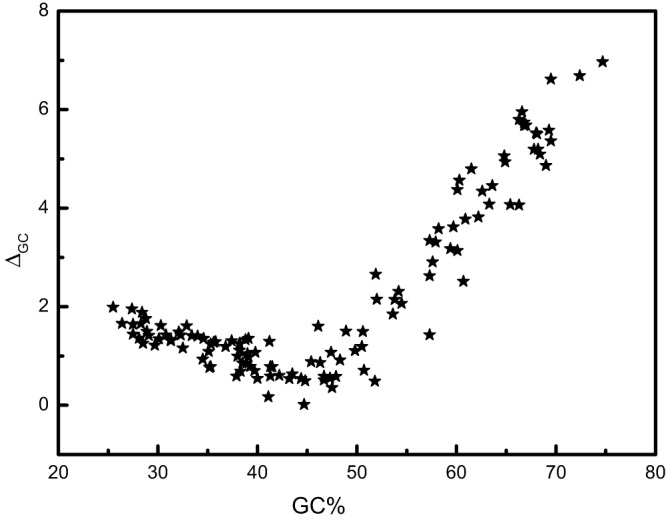
Dependence of ΔGC on the genomic GC contents of the 120 ATGC.
Dependence of coupling between the two levels of selection on lifestyle, biological function, and taxonomy of prokaryotes.
We further investigated possible connections of the coupling between the selection on amino acid sequences and on codon usage with various biological features of prokaryotes, including optimal growth temperature, cell shape, sporulation capacity, motility, and oxygen requirement. None of these biological properties showed a significant link with R (data not shown). It appeared particularly plausible that the coupling between the two levels of selection would be linked to the optimal growth rate (time between cell divisions under optimal growth conditions) of a microbe (55). Again, however, no connection between this parameter and R was found to exist (Fig. 7).
FIG 7 .
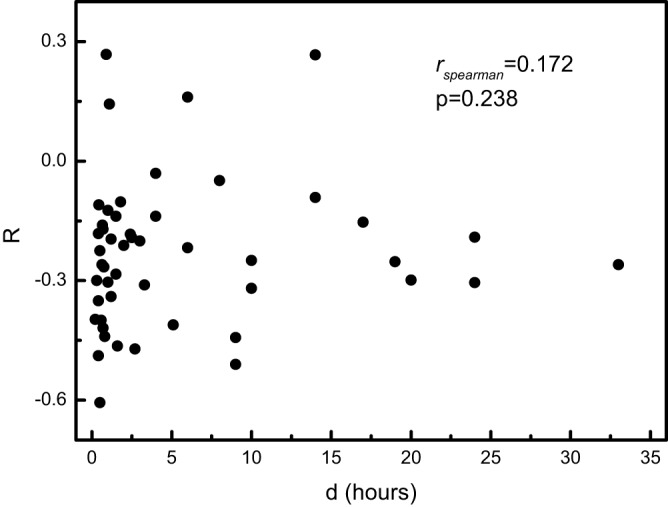
Dependence of R on optimal growth rates of bacteria and archaea. The optimal growth rate data (time between divisions under optimal growth conditions) are from reference 55.
In contrast, the partitioning of Proteobacteria (the most extensively sequenced bacterial phylum) into pathogens and nonpathogens revealed a significantly stronger coupling among nonpathogens (Fig. 8). No such connection of dN/dS or Fopt values was detected. In contrast, a significant difference between pathogenic and non-pathogenic bacteria was observed also with respect to GC content, with a higher GC content in nonparasites (Fig. 8). These observations are compatible with the conclusion that (i) coupling of the selective processes at the protein and codon levels and (ii) GC content are subject to the same or related selective pressures.
FIG 8 .

Comparison of the R values, dN/dS ratios, Fopt values, GSs, and GC contents of pathogens and nonpathogens in the phylum Proteobacteria. Of the 61 proteobacteria, 38 were classified as pathogens and 16 were classified as nonpathogens (data are from the GOLD [http://www.genomesonline.org/] and PATRIC [http://patric.vbi.vt.edu/] databases; the remaining 7 species were not classified in either of the two categories; see Table S1 in the supplemental material). The R values and GC contents of pathogens differ significantly from those of nonpathogens.
We further explored the coupling in different functional classes of genes by using the coarse-grain classification implemented in the Clusters of Orthologous Groups (COG) system (56, 57). Although the differences between functional classes of genes were small in magnitude, genes that encode proteins related to metabolic activities (enzymes and transporters) consistently showed stronger coupling than informational genes encoding components of the translation, transcription, and replication systems (Fig. 9a). The difference was found to be statistically significant when the metabolic genes were pooled and collectively compared to informational genes (Fig. 9b).
FIG 9 .

Correlation of the Fopt values and dN/dS ratios (R values) of different functional classes of genes of prokaryotes. The data for all 120 ATGC were pooled. (a) Comparison of R values of two broad categories of genes, those encoding proteins involved in information processing and cellular functions (e.g., cell division) (cell&infor) and those encoding proteins involved in metabolism (enzymes and transporters). The mean R value of the metabolic class (red box) is −0.242, which is significantly greater than the mean R value of −0.223 of the informational class (P < 0.02). (b) Comparison of R values of individual functional categories of genes. The functional categories are from the COG classifications.
Finally, we compared the strengths of the coupling between different bacterial and archaeal phyla (Fig. 10). Significant differences were detected, with Actinobacteria showing particularly strong coupling, in contrast to the weak coupling in Cyanobacteria and Firmicutes. Among the two most extensively sequenced phyla, Proteobacteria showed significantly stronger coupling than Firmicutes.
FIG 10 .

Comparison of R values of major prokaryotic taxa. The taxa shown belong to Actinobacteria (ACT), Archaea (ARC), the Bacteroidetes-Chlorobi group (BCg), Cyanobacteria (CYA), Firmicutes (FIR), other phyla (OTH), Proteobacteria (PRO), Spirochaetes (SPI), Tenericutes (TEN), and all phyla (ALL). One-way analysis of variance was used to test if any two groups differ significantly from each other. At the 0.05 level, the correlation in Actinobacteria is significantly stronger than those in the Bacteroidetes-Chlorobi group, Cyanobacteria, Firmicutes, Proteobacteria, Spirochaetes, Tenericutes, and other phyla, and the correlation in Archaea and Proteobacteria is significantly stronger than those in Cyanobacteria, Firmicutes, and Tenericutes.
DISCUSSION
The results of the present analysis demonstrate the coupling between selection forces that affect protein sequences and codon usage. This relationship could be readily anticipated from previous observations on the relationships between gene expression level and protein sequence conservation on the one hand and CUB on the other (30). The coupling between selection on protein sequence and selection on codon usage can be interpreted as a fine-tuning of translation via CUB that depends on the “status” of a gene in an organism. “High-status” genes that are highly expressed tend to occupy central positions in various biological networks and typically evolve slowly (65), the selection for translational fine-tuning apparently is measurably stronger than it is in lower-status genes, resulting in the observed negative correlations between dN/dS and Fopt.
The main, nontrivial observation in this work is that the strength of the coupling between the two levels of selection is effectively determined by the genomic GC content. It has been shown that mutational processes in all organisms are biased toward AT accumulation, so by inference, high GC content results from selection (58). The nature of this selection is not fully understood, but apparently, CUB is an important optimization criterion, as demonstrated by the finding that in bacteria, CUB tracks the nucleotide composition of the intergenic regions and in particular, that in sufficiently GC-rich genomes, the optimal codons typically contain G or C in synonymous positions. Moreover, the bias toward GC-rich codons is the strongest in highly expressed genes, such as those encoding translation system components (59). A subsequent, updated analysis indicates that the GC content in synonymous positions of codons tends to be higher than that in intergenic regions and that GC enrichment in synonymous positions without changing protein sequences results in increased fitness of bacteria expressing the respective genes (60). The results of the present study add an extra dimension to these observations by showing that the dependence of the translational fine-tuning on gene status is strongly correlated with the genomic GC content. In other words, in GC-rich genomes, the difference between the levels of translational fine-tuning in high- and low-status genes is greater than it is in AT-rich genomes, resulting in the observed strong correlation between strength of coupling and GC content.
This conclusion is clearly supported by the dependence of ΔGC on the genomic GC content (Fig. 6).
Although historically it is customary to speak of GC content determining other features of genomes, the causality could be reversed, with the selection for G and C at synonymous sites, which is particularly strong in high-status genes, driving the evolution toward high GC content (60). Furthermore, the overall optimization of the translational landscape of a microbial genome might enable the accumulation of genes via horizontal gene transfer and duplication, resulting in the strong positive correlation between GC content and GS (54) (Fig. 3).
In addition to demonstrating the coupling between protein level selection and CUB and its dependence on GC content, we observed that the strength of this coupling differs for parasites versus nonparasites and for genes encoding metabolic proteins versus those encoding informational proteins. Although subtle, these differences were found to be significant and did not appear to be by-products of the GC content connection. One might hypothesize that translational fine-tuning shows a stronger dependence on gene status in organisms and genes that are involved in frequent adaptation to changing environments and that this fine-tuning is particularly important in genes directly involved in such adaptation. Furthermore, some of the prokaryotic phyla significantly differ in the strength of coupling, which is suggestive of additional links with lifestyle and physiology.
The overall outcome of this analysis identifies the coupling between selection processes that act at the level of proteins and at the level of codon usage as a distinct characteristic of prokaryotic genome evolution. The strength of this coupling is tightly linked to genomic GC content and could be an important determinant of the nucleotide composition of genomes, the evolution of which remains poorly understood.
The biological factors behind the wide range of the strengths of coupling between the two levels of selection, from very strong negative correlation in many groups of microbes to a positive correlation in a few groups (Fig. 1 and 2), remain unclear. Explaining the nature of this variance and connecting it to specifics of microbial biology is a challenge for further research. Given the stronger coupling observed for operational genes than for informational genes (Fig. 9), it appears plausible that fine-tuning of CUB is subject to stronger selection in microbes whose lifestyle includes adaptation to changing environments that requires rapid protein dosage adjustment via translational regulation.
MATERIALS AND METHODS
The ATGC database and genome sequences.
The ATGC database was built in 2009 and included 446 prokaryotic genomes and 104 ATGC (14). We updated the data set to include 1,390 genomes and 120 ATGC; Firmicutes and Proteobacteria account for 63.3% of the genomes (880/1,390) because of the relative paucity of sequenced genomes from other phyla. All of the pairs of orthologous genes in this database are synteny-supported bidirectional best hits (12, 14, 61). Altogether, 2,817,540 orthologous gene pairs were analyzed.
Selection of genome pairs for analysis.
Suppose there are m species in an ATGC with the same gene number, n, which is the simplest case. The number of orthologous gene pairs is then n × {m!/[2!(m − 2)!]}. Obviously, the number of orthologous gene pairs rapidly increases with the number of species in an ATGC. If all of the orthologous gene pairs from all ATGC were taken into account in this analysis, the results would have been strongly biased toward large ATGC. Thus, we randomly chose a pair of species from each ATGC containing more than two species and used the orthologous gene pairs from these two species as a representative sample of the given ATGC.
Calculation of parameters.
For each orthologous gene pair in an ATGC, protein sequences were aligned with MUSCLE (62), and the protein alignment was used to generate the alignment of the respective nucleotide sequences extracted from the genomic sequences by using a custom script. Maximum-likelihood approximation (codeML) was used to calculate dS and dN (63). In order to eliminate those orthologous gene pairs for which the estimates of the parameters was deemed unreliable either because of the small number of substitutions or conversely because of extreme divergence, the gene pairs with a dN value of <0.0002, a dS value of <0.0002, a dS value of >3, or a dN/dS ratio of >3 were discarded. The orthologous gene pairs in which the lengths of the two genes differed by more than 20% (presumably because of gene misannotation) were discarded as well. Fopt is a widely used measure of CUB (64). The Fopt values of genes in an orthologous gene pair are very close in most cases (data not shown). Thus, the mean Fopt value of two orthologous genes was taken as the Fopt value for that gene pair.
SUPPLEMENTAL MATERIAL
List of pathogens and nonpathogens among Proteobacteria
ACKNOWLEDGMENTS
We thank Yuri Wolf for many helpful suggestions and critical reading of the manuscript and Koonin group members for useful discussions.
Our research is funded through the intramural fund of the U.S. Department of Health and Human Services (to the National Library of Medicine).
Footnotes
Citation Ran W, Kristensen DM, Koonin EV. 2014. Coupling between protein level selection and codon usage optimization in the evolution of bacteria and archaea. mBio 5(2):e00956-14. doi:10.1128/mBio.00956-14.
REFERENCES
- 1. Kimura M. 1983. The neutral theory of molecular evolution. Cambridge University Press, Cambridge [Google Scholar]
- 2. Li WH. 1997. Molecular evolution. Sinauer, Sunderland, MA [Google Scholar]
- 3. Yang Z, Bielawski JP. 2000. Statistical methods for detecting molecular adaptation. Trends Ecol. Evol. 15:496–503. 10.1016/S0169-5347(00)01994-7 [DOI] [PMC free article] [PubMed] [Google Scholar]
- 4. Hurst LD. 2002. The Ka/Ks ratio: diagnosing the form of sequence evolution. Trends Genet. 18:486. 10.1016/S0168-9525(02)02722-1 [DOI] [PubMed] [Google Scholar]
- 5. Grishin NV, Wolf YI, Koonin EV. 2000. From complete genomes to measures of substitution rate variability within and between proteins. Genome Res. 10:991–1000. 10.1101/gr.10.7.991 [DOI] [PMC free article] [PubMed] [Google Scholar]
- 6. Larracuente AM, Sackton TB, Greenberg AJ, Wong A, Singh ND, Sturgill D, Zhang Y, Oliver B, Clark AG. 2008. Evolution of protein-coding genes in Drosophila. Trends Genet. 24:114–123. 10.1016/j.tig.2007.12.001 [DOI] [PubMed] [Google Scholar]
- 7. Nielsen R. 2005. Molecular signatures of natural selection. Annu. Rev. Genet. 39:197–218. 10.1146/annurev.genet.39.073003.112420 [DOI] [PubMed] [Google Scholar]
- 8. Koonin EV, Wolf YI. 2010. Constraints and plasticity in genome and molecular-phenome evolution. Nat. Rev. Genet. 11:487–498. 10.1038/nrg2810 [DOI] [PMC free article] [PubMed] [Google Scholar]
- 9. Lynch M, Conery JS. 2003. The origins of genome complexity. Science 302:1401–1404. 10.1126/science.1089370 [DOI] [PubMed] [Google Scholar]
- 10. Lynch M. 2007. The origins of genome architecture. Sinauer Associates, Sunderland, MA [Google Scholar]
- 11. Jordan IK, Rogozin IB, Wolf YI, Koonin EV. 2002. Microevolutionary genomics of bacteria. Theor. Popul. Biol. 61:435–447. 10.1006/tpbi.2002.1588 [DOI] [PubMed] [Google Scholar]
- 12. Novichkov PS, Wolf YI, Dubchak I, Koonin EV. 2009. Trends in prokaryotic evolution revealed by comparison of closely related bacterial and archaeal genomes. J. Bacteriol. 191:65–73. 10.1128/JB.01237-08 [DOI] [PMC free article] [PubMed] [Google Scholar]
- 13. Takeuchi N, Wolf YI, Makarova KS, Koonin EV. 2012. Nature and intensity of selection pressure on CRISPR-associated genes. J. Bacteriol. 194:1216–1225. 10.1128/JB.06521-11 [DOI] [PMC free article] [PubMed] [Google Scholar]
- 14. Novichkov PS, Ratnere I, Wolf YI, Koonin EV, Dubchak I. 2009. ATGC: a database of orthologous genes from closely related prokaryotic genomes and a research platform for microevolution of prokaryotes. Nucleic Acids Res. 37:D448–D454. 10.1093/nar/gkn684 [DOI] [PMC free article] [PubMed] [Google Scholar]
- 15. Katz L, Burge CB. 2003. Widespread selection for local RNA secondary structure in coding regions of bacterial genes. Genome Res. 13:2042–2051. 10.1101/gr.1257503 [DOI] [PMC free article] [PubMed] [Google Scholar]
- 16. Stoletzki N. 2008. Conflicting selection pressures on synonymous codon use in yeast suggest selection on mRNA secondary structures. BMC Evol. Biol. 8:224. 10.1186/1471-2148-8-224 [DOI] [PMC free article] [PubMed] [Google Scholar]
- 17. Shabalina SA, Spiridonov NA, Kashina A. 2013. Sounds of silence: synonymous nucleotides as a key to biological regulation and complexity. Nucleic Acids Res. 41:2073–2094. 10.1093/nar/gks1205 [DOI] [PMC free article] [PubMed] [Google Scholar]
- 18. Resch AM, Carmel L, Mariño-Ramírez L, Ogurtsov AY, Shabalina SA, Rogozin IB, Koonin EV. 2007. Widespread positive selection in synonymous sites of mammalian genes. Mol. Biol. Evol. 24:1821–1831. 10.1093/molbev/msm100 [DOI] [PMC free article] [PubMed] [Google Scholar]
- 19. Knight RD, Freeland SJ, Landweber LF. 2001. A simple model based on mutation and selection explains trends in codon and amino-acid usage and GC composition within and across genomes. Genome Biol. 2:research0010–research0010.13. 10.1186/gb-2001-2-4-research0010 [DOI] [PMC free article] [PubMed] [Google Scholar]
- 20. Chen SL, Lee W, Hottes AK, Shapiro L, McAdams HH. 2004. Codon usage between genomes is constrained by genome-wide mutational processes. Proc. Natl. Acad. Sci. U. S. A. 101:3480–3485. 10.1073/pnas.0307827100 [DOI] [PMC free article] [PubMed] [Google Scholar]
- 21. Gouy M, Gautier C. 1982. Codon usage in bacteria: correlation with gene expressivity. Nucleic Acids Res. 10:7055–7074. 10.1093/nar/10.22.7055 [DOI] [PMC free article] [PubMed] [Google Scholar]
- 22. Ikemura T. 1985. Codon usage and tRNA content in unicellular and multicellular organisms. Mol. Biol. Evol. 2:13–34 [DOI] [PubMed] [Google Scholar]
- 23. Bulmer M. 1987. Coevolution of codon usage and transfer RNA abundance. Nature 325:728–730. 10.1038/325728a0 [DOI] [PubMed] [Google Scholar]
- 24. Kurland CG. 1991. Codon bias and gene expression. FEBS Lett. 285:165–169. 10.1016/0014-5793(91)80797-7 [DOI] [PubMed] [Google Scholar]
- 25. Karlin S, Mrázek J, Campbell AM. 1998. Codon usages in different gene classes of the Escherichia coli genome. Mol. Microbiol. 29:1341–1355. 10.1046/j.1365-2958.1998.01008.x [DOI] [PubMed] [Google Scholar]
- 26. Hershberg R, Petrov DA. 2008. Selection on codon bias. Annu. Rev. Genet. 42:287–299. 10.1146/annurev.genet.42.110807.091442 [DOI] [PubMed] [Google Scholar]
- 27. Plotkin JB, Kudla G. 2011. Synonymous but not the same: the causes and consequences of codon bias. Nat. Rev. Genet. 12:32–42. 10.1038/nrg2899 [DOI] [PMC free article] [PubMed] [Google Scholar]
- 28. Sharp PM, Li WH. 1986. An evolutionary perspective on synonymous codon usage in unicellular organisms. J. Mol. Evol. 24:28–38. 10.1007/BF02099948 [DOI] [PubMed] [Google Scholar]
- 29. Sharp PM, Li WH. 1987. The rate of synonymous substitution in enterobacterial genes is inversely related to codon usage bias. Mol. Biol. Evol. 4:222–230 [DOI] [PubMed] [Google Scholar]
- 30. Drummond DA, Wilke CO. 2008. Mistranslation-induced protein misfolding as a dominant constraint on coding-sequence evolution. Cell 134:341–352. 10.1016/j.cell.2008.05.042 [DOI] [PMC free article] [PubMed] [Google Scholar]
- 31. Hartl DL, Moriyama EN, Sawyer SA. 1994. Selection intensity for codon bias. Genetics 138:227–234 [DOI] [PMC free article] [PubMed] [Google Scholar]
- 32. Parker J, Johnston TC, Borgia PT, Holtz G, Remaut E, Fiers W. 1983. Codon usage and mistranslation. In Vivo basal level misreading MS 2 coat protein message. J. Biol. Chem. 258:10007–10012 [PubMed] [Google Scholar]
- 33. Precup J, Parker J. 1987. Missense misreading of asparagine codons as a function of codon identity and context. J. Biol. Chem. 262:11351–11355 [PubMed] [Google Scholar]
- 34. Sørensen MA, Kurland CG, Pedersen S. 1989. Codon usage determines translation rate in Escherichia coli. J. Mol. Biol. 207:365–377. 10.1016/0022-2836(89)90260-X [DOI] [PubMed] [Google Scholar]
- 35. Akashi H. 1994. Synonymous codon usage in Drosophila melanogaster: natural selection and translational accuracy. Genetics 136:927–935 [DOI] [PMC free article] [PubMed] [Google Scholar]
- 36. Stoletzki N, Eyre-Walker A. 2007. Synonymous codon usage in Escherichia coli: selection for translational accuracy. Mol. Biol. Evol. 24:374–381 [DOI] [PubMed] [Google Scholar]
- 37. Sørensen MA, Pedersen S. 1991. Absolute in vivo translation rates of individual codons in Escherichia coli. The two glutamic acid codons GAA and GAG are translated with a three-fold difference in rate. J. Mol. Biol. 222:265–280. 10.1016/0022-2836(91)90211-N [DOI] [PubMed] [Google Scholar]
- 38. Marintchev A, Wagner G. 2004. Translation initiation: structures, mechanisms and evolution. Q. Rev. Biophys. 37:197–284. 10.1017/S0033583505004026 [DOI] [PubMed] [Google Scholar]
- 39. Kudla G, Murray AW, Tollervey D, Plotkin JB. 2009. Coding-sequence determinants of gene expression in Escherichia coli. Science 324:255–258. 10.1126/science.1170160 [DOI] [PMC free article] [PubMed] [Google Scholar]
- 40. Sharp PM, Bailes E, Grocock RJ, Peden JF, Sockett RE. 2005. Variation in the strength of selected codon usage bias among bacteria. Nucleic Acids Res. 33:1141–1153. 10.1093/nar/gki242 [DOI] [PMC free article] [PubMed] [Google Scholar]
- 41. Higgs PG, Ran W. 2008. Coevolution of codon usage and tRNA genes leads to alternative stable states of biased codon usage. Mol. Biol. Evol. 25:2279–2291. 10.1093/molbev/msn173 [DOI] [PubMed] [Google Scholar]
- 42. Sharp PM, Emery LR, Zeng K. 2010. Forces that influence the evolution of codon bias. Philos. Trans. R. Soc. Lond. B Biol. Sci. 365:1203–1212. 10.1098/rstb.2009.0305 [DOI] [PMC free article] [PubMed] [Google Scholar]
- 43. Ran W, Higgs PG. 2010. The influence of anticodon-codon interactions and modified bases on codon usage bias in bacteria. Mol. Biol. Evol. 27:2129–2140. 10.1093/molbev/msq102 [DOI] [PubMed] [Google Scholar]
- 44. Qian W, Yang JR, Pearson NM, Maclean C, Zhang J. 2012. Balanced codon usage optimizes eukaryotic translational efficiency. PLoS Genet. 8:e1002603. 10.1371/journal.pgen.1002603 [DOI] [PMC free article] [PubMed] [Google Scholar]
- 45. Ran W, Higgs PG. 2012. Contributions of speed and accuracy to translational selection in bacteria. PLoS One 7:e51652. 10.1371/journal.pone.0051652 [DOI] [PMC free article] [PubMed] [Google Scholar]
- 46. Quax TE, Wolf YI, Koehorst JJ, Wurtzel O, van der Oost R, Ran W, Blombach F, Makarova KS, Brouns SJ, Forster AC, Wagner EG, Sorek R, Koonin EV, van der Oost J. 2013. Differential translation tunes uneven production of operon-encoded proteins. Cell Rep. 4:938–944. 10.1016/j.celrep.2013.07.049 [DOI] [PubMed] [Google Scholar]
- 47. Bulmer M. 1991. The selection-mutation-drift theory of synonymous codon usage. Genetics 129:897–907 [DOI] [PMC free article] [PubMed] [Google Scholar]
- 48. Akashi H. 1995. Inferring weak selection from patterns of polymorphism and divergence at “silent” sites in Drosophila DNA. Genetics 139:1067–1076 [DOI] [PMC free article] [PubMed] [Google Scholar]
- 49. Duret L. 2002. Evolution of synonymous codon usage in metazoans. Curr. Opin. Genet. Dev. 12:640–649. 10.1016/S0959-437X(02)00353-2 [DOI] [PubMed] [Google Scholar]
- 50. Pál C, Papp B, Hurst LD. 2001. Highly expressed genes in yeast evolve slowly. Genetics 158:927–931 (Letter.) [DOI] [PMC free article] [PubMed] [Google Scholar]
- 51. Krylov DM, Wolf YI, Rogozin IB, Koonin EV. 2003. Gene loss, protein sequence divergence, gene dispensability, expression level, and interactivity are correlated in eukaryotic evolution. Genome Res. 13:2229–2235. 10.1101/gr.1589103 [DOI] [PMC free article] [PubMed] [Google Scholar]
- 52. Drummond DA, Bloom JD, Adami C, Wilke CO, Arnold FH. 2005. Why highly expressed proteins evolve slowly. Proc. Natl. Acad. Sci. U. S. A. 102:14338–14343. 10.1073/pnas.0504070102 [DOI] [PMC free article] [PubMed] [Google Scholar]
- 53. Drummond DA, Raval A, Wilke CO. 2006. A single determinant dominates the rate of yeast protein evolution. Mol. Biol. Evol. 23:327–337. 10.1093/molbev/msj038 [DOI] [PubMed] [Google Scholar]
- 54. Nakabachi A, Yamashita A, Toh H, Ishikawa H, Dunbar HE, Moran NA, Hattori M. 2006. The 160-kilobase genome of the bacterial endosymbiont Carsonella. Science 314:267. 10.1126/science.1134196 [DOI] [PubMed] [Google Scholar]
- 55. Couturier E, Rocha EP. 2006. Replication-associated gene dosage effects shape the genomes of fast-growing bacteria but only for transcription and translation genes. Mol. Microbiol. 59:1506–1518. 10.1111/j.1365-2958.2006.05046.x [DOI] [PubMed] [Google Scholar]
- 56. Tatusov RL, Fedorova ND, Jackson JD, Jacobs AR, Kiryutin B, Koonin EV, Krylov DM, Mazumder R, Mekhedov SL, Nikolskaya AN, Rao BS, Smirnov S, Sverdlov AV, Vasudevan S, Wolf YI, Yin JJ, Natale DA. 2003. The COG database: an updated version includes eukaryotes. BMC Bioinformatics 4:41. 10.1186/1471-2105-4-41 [DOI] [PMC free article] [PubMed] [Google Scholar]
- 57. Tatusov RL, Koonin EV, Lipman DJ. 1997. A genomic perspective on protein families. Science 278:631–637. 10.1126/science.278.5338.631 [DOI] [PubMed] [Google Scholar]
- 58. Hershberg R, Petrov DA. 2010. Evidence that mutation is universally biased towards AT in bacteria. PLoS Genet. 6:e1001115. 10.1371/journal.pgen.1001115 [DOI] [PMC free article] [PubMed] [Google Scholar]
- 59. Hershberg R, Petrov DA. 2009. General rules for optimal codon choice. PLoS Genet. 5:e1000556. 10.1371/journal.pgen.1000556 [DOI] [PMC free article] [PubMed] [Google Scholar]
- 60. Raghavan R, Kelkar YD, Ochman H. 2012. A selective force favoring increased G+C content in bacterial genes. Proc. Natl. Acad. Sci. U. S. A. 109:14504–14507. 10.1073/pnas.1205683109 [DOI] [PMC free article] [PubMed] [Google Scholar]
- 61. Kristensen DM, Wolf YI, Mushegian AR, Koonin EV. 2011. Computational methods for gene orthology inference. Brief. Bioinform. 12:379–391. 10.1093/bib/bbr030 [DOI] [PMC free article] [PubMed] [Google Scholar]
- 62. Edgar RC. 2004. MUSCLE: multiple sequence alignment with high accuracy and high throughput. Nucleic Acids Res. 32:1792–1797. 10.1093/nar/gkh340 [DOI] [PMC free article] [PubMed] [Google Scholar]
- 63. Yang Z. 2007. PAML 4: phylogenetic analysis by maximum likelihood. Mol. Biol. Evol. 24:1586–1591. 10.1093/molbev/msm088 [DOI] [PubMed] [Google Scholar]
- 64. Ikemura T. 1981. Correlation between the abundance of Escherichia coli transfer RNAs and the occurrence of the respective codons in its protein genes: a proposal for a synonymous codon choice that is optimal for the E. coli translational system. J. Mol. Biol. 151:389–409. 10.1016/0022-2836(81)90003-6 [DOI] [PubMed] [Google Scholar]
- 65. Wolf YI, Carmel L, Koonin EV. 2006. Unifying measures of gene function and evolution. Proc. Biol. Sci. 273:1507–1515 [DOI] [PMC free article] [PubMed] [Google Scholar]
Associated Data
This section collects any data citations, data availability statements, or supplementary materials included in this article.
Supplementary Materials
List of pathogens and nonpathogens among Proteobacteria