

Abstract
Objectives
To describe the population pharmacokinetics of rifampicin, pyrazinamide and isoniazid in children and evaluate the adequacy of steady-state exposures.
Patients and methods
We used previously published data for 76 South African children with tuberculosis to describe the population pharmacokinetics of rifampicin, pyrazinamide and isoniazid. Monte Carlo simulations were used to predict steady-state exposures in children following doses in fixed-dose combination tablets in accordance with the revised guidelines. Reference exposures were derived from an ethnically similar adult population with tuberculosis taking currently recommended doses.
Results
The final models included allometric scaling of clearance and volume of distribution using body weight. Maturation was included for clearance of isoniazid and clearance and absorption transit time of rifampicin. For a 2-year-old child weighing 12.5 kg, the estimated typical oral clearances of rifampicin and pyrazinamide were 8.15 and 1.08 L/h, respectively. Isoniazid typical oral clearance (adjusted for bioavailability) was predicted to be 4.44, 11.6 and 14.6 L/h for slow, intermediate and fast acetylators, respectively. Higher oral clearance values in intermediate and fast acetylators also resulted from 23% lower bioavailability compared with slow acetylators.
Conclusions
Simulations based on our models suggest that with the new WHO dosing guidelines and utilizing available paediatric fixed-dose combinations, children will receive adequate rifampicin exposures when compared with adults, but with a larger degree of variability. However, pyrazinamide and isoniazid exposures in many children will be lower than in adults. Further studies are needed to confirm these findings in children administered the revised dosages and to optimize pragmatic approaches to dosing.
Keywords: pharmacometrics, anti-Mycobacterium, paediatrics, NONMEM, modelling and simulation
Introduction
Tuberculosis is the most frequent infectious cause of death worldwide with high impact in developing countries.1 In high-burden settings, children comprise 15%–20% of tuberculosis cases.2 Young children (<5 years of age) and children with HIV infection are prone to rapid progression to tuberculosis disease following infection and frequently experience severe forms of tuberculosis, including disseminated disease and meningitis.2 Isoniazid and rifampicin are important for their bactericidal activity against metabolically active Mycobacterium tuberculosis. The sterilizing activities of pyrazinamide and rifampicin prevent the relapse of disease after treatment.3,4 Isoniazid plays an important role in preventing the development of resistance to companion drugs such as rifampicin.5 Dosages of rifampicin higher than those currently employed have been suggested to improve efficacy.6
Until recently, the daily dosages of first-line antituberculosis drugs recommended in children were derived from the adult dosage based on the assumption that the same dose per kg is appropriate across all ages of patients. Even though rifampicin, isoniazid and pyrazinamide have been available for many years, the limited pharmacokinetic information in children suggests that young children receiving adult-derived dosages have drug exposures lower than adults.7–9 In children, factors such as maturation of metabolizing enzymes and transporters, body composition, organ function, nutritional status and the pathophysiology of severe forms of tuberculosis may contribute to changes in pharmacokinetics, drug response and toxicity.10 Previous studies have reported reduced tuberculosis drug concentrations in adults with HIV infection,11 but the effect of HIV infection on the pharmacokinetics of tuberculosis drugs has not been adequately evaluated in children. The WHO has recently recommended increased dosages of first-line antituberculosis drugs for children,12 which are to be implemented using dispersible fixed-dose combination (FDC) tablets for paediatric use, manufactured according to newly recommended specifications, with each tablet containing 50 mg of isoniazid, 75 mg of rifampicin and 150 mg of pyrazinamide.13
In this paper, we describe the population pharmacokinetics of rifampicin, pyrazinamide and isoniazid in non-linear mixed-effects models, using previously published data from children with tuberculosis aged 2 months to 11.3 years who were given a wide range of dosages.7,8,14,15 In addition, we used our final models to predict the steady-state area under the concentration–time curve (AUC) and maximum plasma concentration (Cmax) in a paediatric population and compared them with the corresponding pharmacokinetic measures in ethnically similar adults with tuberculosis.
Patients and methods
Patient population
Combined data of 76 children obtained from previously published studies describing the plasma concentrations of rifampicin, pyrazinamide and isoniazid in two cohorts of South African children with tuberculosis were used for analysis.7,8,14,15 On the basis of analysis of genetic polymorphisms of the arylamine N-acetyltransferase 2 (NAT2) gene, the children were categorized as slow-, intermediate- or fast-acetylator genotypes for acetylation of isoniazid. The methods used in the classification of NAT2 genotypes have been previously described for Cohort 19 and Cohort 2.15 The demographic and clinical characteristics of all the children are summarized in Table 1.
Table 1.
Patient demographic and clinical characteristics
| Covariate | Cohort 1a | Cohort 2a | Combined |
|---|---|---|---|
| Number of patients | 56 | 20 | 76 |
| Sex (males/females) | 29/27 | 11/9 | 40/36 |
| Genotype (S/I/F/Ms) | 20/24/8/4 | 8/4/8/0 | 28/28/16/4 |
| HIV positive (males/females) | 22 (12/10) | 5 (2/3) | 27 (14/13) |
| Age (years) | 3.22 (0.598, 10.9) | 1.10 (0.321, 1.99) | 2.17 (0.417, 10.7) |
| Weight (kg) | 12.5 (4.87, 26.9) | 7.80 (4.12, 12.8) | 10.5 (4.90, 21.8) |
| RIF dose 1st PK (mg/kg) | 9.54 (6.70, 13.3) | 10.1 (9.0, 10.5) | 9.71 (7.07, 13.2) |
| RIF dose 2nd PK (mg/kg) | 9.57 (5.46, 16.0) | 15.4 (10.4, 15.8) | 10.3 (6.37, 15.9) |
| PZA dose 1st PK (mg/kg) | 22.7 (15.9, 26.7) | 25.2 (22.5, 26.5) | 24.6 (17.6, 26.5) |
| PZA dose 2nd PK (mg/kg) | 22.2 (12.2, 26.3) | 36.2 (33.4, 39.5) | 33.7 (15.6, 39.1) |
| INH dose 1st PK (mg/kg) | 4.92 (3.35, 12.8) | 5.04 (4.50, 5.36) | 5.03 (3.56, 12.1) |
| INH dose 2nd PK (mg/kg) | 4.95 (2.36, 16.0) | 10.2 (8.74, 10.8) | 9.77 (2.73, 13.3) |
S/I/F, slow/intermediate/fast arylamine N-acetyltransferase acetylators; Ms, missing covariate data; RIF, rifampicin; PZA, pyrazinamide; INH, isoniazid; 1st PK and 2nd PK, first and second pharmacokinetic sampling occasion, respectively.
Patient treatment and pharmacokinetic sampling
Daily doses of rifampicin and isoniazid were given for 6 months with pyrazinamide added for the first 2 months. Dispersible FDC tablets formulated for children were used7,8,14,15 and details about the dosing are included in Table 1. In Cohort 1, the median daily doses of rifampicin, pyrazinamide and isoniazid approximated 10, 23 and 5 mg/kg, respectively. In Cohort 2, on the first pharmacokinetic occasion, the median daily doses were similar to Cohort 1: 10 mg/kg for rifampicin, 25 mg/kg for pyrazinamide and 5 mg/kg for isoniazid. For the second pharmacokinetic occasion, the doses were adjusted, so the median values increased: 15 mg/kg for rifampicin, 36 mg/kg for pyrazinamide and 10 mg/kg for isoniazid. For Cohort 1, blood sampling for pharmacokinetic analysis was conducted at 1 and 4 months after starting treatment. At each sampling occasion, venous blood was drawn at 0.75, 1.5, 3, 4 and 6 h post-dose. Cohort 2 underwent pharmacokinetic sampling ≥2 weeks after initiation of antituberculosis therapy and sampling was repeated 1 week later, with samples drawn pre-dose and at 0.5, 1.5, 3 and 5 h after the dose. Cohort 1 plasma concentrations of rifampicin, pyrazinamide and isoniazid were determined by liquid chromatography–tandem mass spectrometry (LC/MS/MS) as detailed previously.7,14,16 The lower limit of quantification (LLOQ) for both rifampicin and isoniazid was 0.1 mg/L and for pyrazinamide was 0.2 mg/L. In Cohort 2, isoniazid and pyrazinamide plasma concentrations were determined by HPLC and UV detection,15 whereas rifampicin was determined by LC/MS/MS.15 The lower limit of detection (LLOD) in Cohort 2, under which no concentration was reported, was 0.25, 0.5 and 0.15 mg/L for rifampicin, pyrazinamide and isoniazid, respectively. Moreover, the assay could not guarantee 5% precision between the LLOD (0.75, 1.5 and 1 mg/L for rifampicin, pyrazinamide and isoniazid, respectively) and LLOQ values.
Pharmacokinetic data analysis
The concentration–time data for each drug were analysed separately using a non-linear mixed-effects approach. The estimation of typical population pharmacokinetic parameters, along with their random inter-individual variability (IIV) and inter-occasional variability (IOV), was performed in NONMEM7 (Icon Development Solutions, Ellicott City, MD, USA)17 using a first-order conditional estimation method with ɛ–η interaction (FOCE INTER).18 For all three drugs (rifampicin, pyrazinamide and isoniazid), model development was carried out first by developing the structural and stochastic model, including allometric scaling, and then investigating covariate effects. Graphical diagnostics were created using Xpose 4.19 In all models, allometric scaling was applied on the oral clearance (CL) and apparent volume of distribution in plasma (Vc) according to Anderson and Holford.20 As reference, the median body weight of 12.5 kg from Cohort 1 (Table 1) was used.
 |
(1) |
 |
(2) |
CLi is the scaled typical value of CL for individual i, CLstd is the typical CL for an individual of 12.5 kg and WTi is the body weight of individual i in kg. A similar notation applies to Vi. In the case of a two-compartment model, allometric scaling was also applied on the inter-compartmental clearance (Q) (as in Equation 1) and on the apparent peripheral volume of distribution (Vp) (as in Equation 2). After allometric scaling was included, the need for including maturation models following the approach previously described by Anderson and Holford21 was evaluated. The maturation factor (MF) was calculated using Equation 3:
 |
(3) |
where PMA is age derived by adding 36 weeks to the post-natal age,22 assuming no premature birth. TM50 is the age at which maturation reaches 50% of the final value and Hill is the coefficient that regulates the rate of onset of the maturation. Models with and without the Hill factor fixed to 1 were tested.
The structural models tested included one- and two-compartment models with first-order elimination. Different absorption models were explored, such as first-order absorption or a sequence of zero- and first-order absorption incorporating either lag times or transit compartment absorption.23,24 The effect of a dose dependency on the pharmacokinetic parameters was also tested. For relative bioavailability (F), first-order absorption rate constant (ka), mean transit time (MTT) and CL of rifampicin (a substrate of polymorphic OATP1B1 transporter)25 and isoniazid (a substrate of polymorphic metabolizing enzyme NAT2) the possibility of subpopulations having different parameter estimates was tested using mixture models. A log-normal model for IIV and IOV was used and shrinkage in the post hoc estimates was derived. Additive and/or proportional models for the residual unexplained variability were evaluated. In Cohort 1, the drug concentrations reported as below the LLOQ were 0.6%, 0% and 3.4% for rifampicin, pyrazinamide and isoniazid, respectively. In Cohort 2, the values below the LLOD were 19%, 5.5% and 17.1% for rifampicin, pyrazinamide and isoniazid, respectively. Additionally, 4.5%, 3% and 24.1% of the concentrations of rifampicin, pyrazinamide and isoniazid, respectively, were in the ‘low precision’ range of the assay, but above the LLOD. The larger proportion of low concentrations in Cohort 2 is partly due to the collection of a pre-dose sample. All the data below the LLOQ in Cohort 1 were handled by fixing the error structure to additive with size LLOQ/2, to include these samples in the fit while accounting for the lower precision. In Cohort 2, values below the LLOD were replaced with LLOD/2, discarding consecutive undetectable concentrations in a series. Moreover, for all LLOD values and the samples in the ‘low precision’ range of the assay, the error structure was fixed to additive and with size half of the threshold of low precision of the assay, once again to account for the larger uncertainty in these measurements.
The effect of age, sex and HIV infection was tested on F, CL, Vc, Vp, ka and MTT. Arm muscle area (AMA) was tested as a predictor of CL, Vc and Vp while albumin and other nutritional status measures (weight-for-age, weight-for-height and height-for-age z scores) were tested on F, CL, Vc and Vp.
The AMA values were derived from percentiles from the US Health and Nutrition Examination Survey I from 1971 to 197426 and the z scores were derived from National Center for Health Statistics/CDC/WHO international reference standards.27 Missing continuous covariate data were replaced with the individual information from the other dosing and sampling occasion, if available. Otherwise, median values from the cohort were used. Missing categorical covariates were replaced with the most common category, except for acetylator genotype. For the missing genotype data (four individuals), a mixture model was used. The likelihood of belonging to each acetylator status was fixed to the frequency observed in the subjects for whom the information was available.
Potential covariate relationships were identified by clinical and statistical significance. The covariate relationships were tested in the model by stepwise addition (forward step) using a difference in the NONMEM objective function value (ΔOFV) of ≥3.84 (P ≤ 0.05) as the cut-off for inclusion, followed by stepwise deletion (backward step) using ΔOFV of ≥6.83 (P ≤ 0.01) as a requisite for covariate retention.
The effect of continuous covariates was parameterized as shown in Equation 4:
 |
(4) |
where θp is the parameter (PAR) estimate in a typical patient (a child with median covariate value of COVmed), while θcov is the fractional change in PAR with each unit change in the covariate (COV) from COVmed.
For categorical covariates, such as acetylator genotype, a separate typical value for the parameter under test was estimated in each group.
Model evaluation
Model selection was based on the graphical assessment of conditional weighted residuals versus time, basic goodness-of-fit plots, changes in the OFV, precision of parameter estimates as provided by the covariance step (if successfully completed) and visual predictive checks (VPCs).28
Simulations
Using Monte Carlo simulations, the final models were used to simulate the steady-state AUC and Cmax for children using pragmatic weight bands (adhering as closely as possible to the revised guidelines in dose per unit weight)12 using one to four undivided tablets of an FDC with the newly recommended specifications (i.e. 75/50/150 mg of rifampicin/isoniazid/pyrazinamide in each FDC tablet).13 The AUC and Cmax were predicted for children weighing 5.0–7.9, 8.0–11.9, 12.0–15.9 and 16.0–24.0 kg receiving respective daily doses of one, two, three and four FDC tablets. Individual weight and age values used in the simulations were additionally obtained from historical data of 246 South African children with tuberculosis; 72% were infected with HIV (2% with HIV status unknown) and 54% were males. Pooling these with the present data from the two cohorts (Table 1), we obtained a dataset of baseline values for 322 children. The pharmacokinetic models were applied (1000 repetitions) to this in silico population, using the WHO-recommended dosing guidelines, and the AUC and Cmax values were collected for each weight band. To obtain reference values for comparison, previously published pharmacokinetic models24,29,30 from an ethnically similar population of adult patients were used to simulate AUC and Cmax ranges using the current WHO-recommended dosing guidelines for adults.31 The respective daily doses used for simulations in adults weighing 30.0–37.9, 38.0–54.9, 55.0–69.9 and ≥70 kg were: 300, 450, 600 and 750 mg for rifampicin; 800, 1200, 1600 and 2000 mg for pyrazinamide; and 150, 225, 300 and 375 mg for isoniazid.
Results
Rifampicin
A total of 629 concentration–time data points were available for 67 children.8,15 The final pharmacokinetic model for rifampicin was a one-compartment model with transit compartments absorption23 and first-order elimination. The parameter estimates of the final model are shown in Table 2. The absorption transit model was simplified by fixing ka to the same value as the first-order transit rate constant (ktr), since the two were not significantly different. HIV status, age and albumin levels had no influence on the pharmacokinetics of rifampicin. Age maturation was supported for CL and MTT and resulted in a 23 point improvement in OFV, explaining 16% IIV in CL and 17% IOV in MTT (no IIV in MTT was present in the model). TM50 was estimated to be 58.2 weeks, which is 22.2 weeks (0.43 years) after birth for both CL and MTT. The proportional change of each parameter with post-natal age is shown in Figure 1. The final model included IIV, expressed as percentage coefficient of variation (%CV), in CL (33%) and Vc (43%), while IOV was significant for CL (25%), F (48%) and MTT (40%). The residual error model had both additive (0.122 mg/L for Cohort 1 and 0.63 mg/L for Cohort 2) and proportional (23% for both cohorts) terms. The final pharmacokinetic model described the data well, as shown in the VPC (Figure 2). When scaled to a 70 kg individual, the typical values for CL and Vc were 29.7 L/h and 90.7 L, respectively.
Table 2.
Parameter estimates of the final rifampicin pharmacokinetic model
| Parameter | Typical value [RSE (%)]a | IIVb [RSE (%)]a | IOVc [RSE (%)]a |
|---|---|---|---|
| CLstd (L/h) | 8.15 (9.00) | 32.6 (27.7) | 25.1 (20.0) |
| Vc.std (L) | 16.2 (10.2) | 43.4 (19.8) | |
| MTT (h) | 1.04 (6.10) | 40.6 (8.60) | |
| NN | 8.04 (11.9) | ||
| F (%) | 1 (fixed) | 48.1 (12.7) | |
| TM50 (weeks) | 58.2 (9.00) | ||
| Hill | 2.21 (11.7) | ||
| Additive error, Cohort 1 (mg/L) | 0.122 (24.6) | ||
| Additive error, Cohort 2 (mg/L) | 0.630 (30.3) | ||
| Proportional error (%) | 23.4 (4.50) |
CLstd and Vc.std, oral clearance and apparent volume of distribution, respectively (the values reported refer to a 12.5 kg child and for CL at full maturation); MTT, absorption mean transit time (value at full maturation); NN, number of transit compartments; F, relative bioavailability; TM50, post-menstrual age at which 50% of clearance and mean transit time maturation is achieved; Hill, steepness of the maturation function.
aRSE, relative standard error reported on the approximate standard deviation scale.
bIIV, inter-individual variability expressed as percentage coefficient of variation (%CV).
cIOV, inter-occasional variability expressed as percentage coefficient of variation (%CV).
Figure 1.

Maturation of oral clearance (CL) and mean transit time (MTT) of rifampicin and CL of isoniazid in a typical patient with post-natal age. The plot is not adjusted for covariate effects or allometric scaling.
Figure 2.
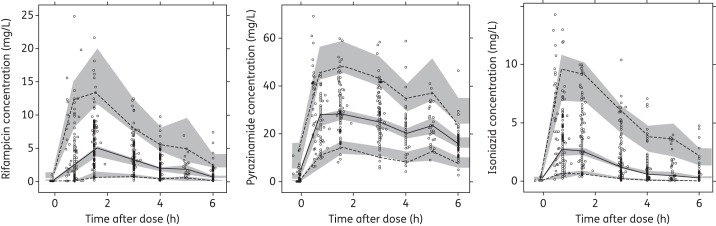
VPCs for the final models of rifampicin, pyrazinamide and isoniazid. The lower, middle and upper lines are the 5th percentile, median and 95th percentile of the observed data, respectively. The shaded areas are the 95% CIs for the 5th percentile, median and 95th percentile of the simulated data.
Pyrazinamide
A total of 518 concentration–time data points were available for 55 children.14,15 The final pharmacokinetic model for pyrazinamide was a one-compartment distribution model with absorption transit compartments, first-order absorption and elimination. The final parameter estimates are shown in Table 3. No significant covariate relationships were supported by the data. IIV, expressed as %CV, was supported for CL (27%), while IOV was significant for CL (26%), ka (86%), F (25%) and MTT (112%). The residual error model was proportional (10% for Cohort 1 and 6% for Cohort 2). The VPC for the final model is displayed in Figure 2, showing that the final model described the data well. The typical values of CL and Vc were 3.9 L/h and 54 L, respectively, when scaled to a 70 kg individual.
Table 3.
Parameter estimates of the final pyrazinamide pharmacokinetic model
| Parameter | Typical value [RSE (%)]a | IIVb [RSE (%)]a | IOVc [RSE (%)]a |
|---|---|---|---|
| CLstd (L/h) | 1.08 (5.60) | 27.1 (16.3) | 25.5 (11.3) |
| Vc.std (L) | 9.64 (2.60) | ||
| ka (h−1) | 4.48 (6.10) | 86.4 (14.6) | |
| MTT (h) | 0.10 (17.7) | 112 (22.5) | |
| NN | 3.94 (8.00) | ||
| F (%) | 1 (fixed) | 24.7 (8.40) | |
| Proportional error, Cohort 1 (%) | 10.0 (4.90) | ||
| Proportional error, Cohort 2 (%) | 5.53 (7.20) |
CLstd and Vc.std, oral clearance and apparent volume of distribution, respectively (the values reported refer to a 12.5 kg child); ka, first-order absorption rate constant; MTT, absorption mean transit time (value at full maturation); NN, number of transit compartments; F, relative bioavailability.
aRSE, relative standard error reported on the approximate standard deviation scale.
bIIV, inter-individual variability expressed as percentage coefficient of variation (%CV).
cIOV, inter-occasional variability expressed as percentage coefficient of variation (%CV).
Isoniazid
A total of 715 concentration–time data points were available for all 76 children.7,15 A two-compartment distribution model with absorption transit compartments and first-order elimination best described the pharmacokinetics of isoniazid. The final parameter estimates are shown in Table 4. The NAT2 genotype was a significant covariate for CL and F. The OFV improved by 55.7 points when including the acetylator status, which explained 45% of the IIV in CL. Estimation of F for intermediate and fast acetylators (relative to slow acetylators) and accounting for age maturation of CL further improved the OFV by 11 and 16 points, respectively. The age maturation explained 6% IIV in CL. With respect to intermediate acetylators (CL = 8.94 L/h), slow acetylators had 50% lower CL (4.44 L/h), while fast acetylators had 26% higher CL (11.3 L/h). Also, F in intermediate and fast acetylators was estimated to be 77.2%, which is 23% lower than in slow acetylators. Thus, combining the genotype effect on CL and bioavailability, the value of CL/F is 4.44, 11.6 and 14.6 L/h for slow, intermediate and fast acetylators, respectively. The final model included IIV, expressed as %CV, in CL (25%) and IOV in ka (61%), MTT (94%) and F (40%). The maturation of CL is represented in Figure 1 and the VPC for the final model is shown in Figure 2. When scaled to a 70 kg individual, the typical values of CL (not CL/F, so before adjusting for the effect of NAT2 genotype on F) were 16.2, 32.5 and 41.1 L/h for slow, intermediate and fast acetylators, respectively, and Vc and Vp were 61.6 and 28.2 L.
Table 4.
Final parameter estimates for isoniazid pharmacokinetics
| Parameter | Typical value [RSE (%)]a | IIVb [RSE (%)]a | IOVc [RSE (%)]a |
|---|---|---|---|
| CLstd.sa (L/h)d | 4.44 (11.6) | 25.1 (12.3) | |
| CLstd.ia (L/h)d | 8.94 (13.1) | 25.1 (12.3) | |
| CLstd.fa (L/h)d | 11.3 (14.8) | 25.1 (12.3) | |
| Vc.std (L)d | 11.0 (10.2) | ||
| ka (h−1) | 2.47 (12.8) | 61.6 (12.4) | |
| MTT (h) | 0.179 (10.9) | 93.9 (17.9) | |
| NN | 4 (fixed) | ||
| Qstd (L/h)d | 2.00 (26.3) | ||
| Vp.std (L)d | 5.03 (33.4) | ||
| Fsa | 1 (fixed) | 39.7 (5.80) | |
| Fim/fa | 0.772 (30.3) | 39.7 (5.80) | |
| TM50 (weeks) | 49.0 (13.5) | ||
| Hill | 2.19 (46.1) | ||
| Proportional error, Cohort 1 (%) | 20.6 (2.80) | ||
| Proportional error, Cohort 2 (%) | 7.00 (18.7) |
CLstd.sa, CLstd.ia and CLstd.fa, oral clearance for slow, intermediate and fast acetylators, respectively (they refer to a child weighing 12.5 kg and at full maturation); Vc.std, apparent volume of distribution in the central compartment for 12.5 kg child; ka, first-order absorption rate constant; MTT, absorption mean transit time; NN, number of hypothetical transit compartments; Qstd, inter-compartmental clearance for 12.5 kg child; Vp.std, volume of distribution in the peripheral compartment for 12.5 kg child; Fsa, relative bioavailability of slow acetylators; Fim/fa, relative bioavailability of intermediate and fast acetylators relative to slow acetylators; TM50, post-menstrual age at 50% of adult clearance; Hill, steepness of the maturation function.
aRSE, relative standard error reported on the approximate standard deviation scale.
bIIV, inter-individual variability expressed as percentage coefficient of variation (%CV).
cIOV, inter-occasional variability expressed as percentage coefficient of variation (%CV).
dIn order to obtain the values of CL/F, Vc/F, Q/F and Vp/F, the values in the table should be divided by the respective value of bioavailability, which changes according to acetylator status.
Simulations
Using the final models and WHO's newly recommended higher dosages utilizing revised FDC recommendations, the predicted steady-state AUCs for all weight bands are shown in Figures 3–5 for rifampicin, pyrazinamide and isoniazid, respectively. Median rifampicin exposures were similar to those in adults, although wider variability was present in the simulated paediatric AUCs, as shown in Figure 3. Exposures after pyrazinamide and isoniazid were adequate, but younger children, particularly those in the lowest weight band, had lower exposures than those in the reference adult population and intermediate and fast acetylators had reduced isoniazid exposures compared with the majority of adults. Our results also predicted that from 3 months to 2 years of age, the AUC decreased by 56% and 50% for rifampicin and isoniazid, respectively, but by only 18% for pyrazinamide [refer to Figures S1, S2 and S3 (available as Supplementary data at JAC Online), respectively].
Figure 3.

Box plot of simulated steady-state AUC of rifampicin across different age and weight bands, obtained adhering as closely as possible to the revised guidelines in dose per unit weight according to WHO 2010 dosing guidelines. Each box shows the 25th–75th percentile of simulated AUC and the symbol ‘x’ shows data falling outside 1.5 times the IQR (25th–75th). The lower, middle and upper broken lines are the derived 5th percentile (9.0 mg · h/L), median (30.7 mg · h/L) and 95th percentile (52.4 mg · h/L) of the adult AUC, respectively. The grey shaded area is the 25th–75th (21.9–39.5 mg · h/L) percentile of the adult AUC.
Figure 4.

Box plot of simulated steady-state AUC of pyrazinamide across different age and weight bands, obtained adhering as closely as possible to the revised guidelines in dose per unit weight according to WHO 2010 dosing guidelines. Each box shows the 25th–75th percentile of simulated AUC and the symbol ‘x’ shows data falling outside 1.5 times the IQR (25th–75th). The lower, middle and upper broken lines are the derived 5th percentile (244.0 mg · h/L), median (427.0 mg · h/L) and 95th percentile (675.0 mg · h/L) of the adult AUC, respectively. The grey shaded area is the 25th–75th (346–547 mg · h/L) percentile of the adult AUC.
Figure 5.

Box plot of simulated steady-state AUC of isoniazid in slow (S), intermediate (I) and fast (F) acetylators across different age and weight bands, obtained adhering as closely as possible to the revised guidelines in dose per unit weight according to WHO 2010 dosing guidelines. Each box shows the 25th–75th percentile of simulated AUC and the symbol ‘x’ shows data falling outside 1.5 times the IQR (25th–75th). The lower, middle and upper broken lines are the derived 5th percentile (9.8 mg · h/L), median (23.4 mg · h/L) and 95th percentile (55.6 mg · h/L) of the adult AUC, respectively. The grey shaded area is the 25th–75th (15.6–35.5 mg · h/L) percentile of the adult AUC.
Discussion
We described the population pharmacokinetics of rifampicin, pyrazinamide and isoniazid in South African children treated for tuberculosis. In addition, drug exposures resulting from the dosages recently recommended by the WHO were investigated. Our simulations predicted that, even with the increased dosages, smaller children would achieve relatively low exposures to pyrazinamide and isoniazid. Moreover, intermediate and fast acetylators (together comprising 61% of our population) may be underdosed with respect to isoniazid if exposures in an ethnically similar population of adults are considered therapeutic (Figure 5). It should be noted that the doses of pyrazinamide and isoniazid used for these predictions tended to be somewhat lower than the recommended dose per kg, especially in the youngest children. Our choice of weight bands was based on ongoing discussions about the optimal dose of the FDC by weight band, pragmatic considerations, such as the stability and equal distribution of active ingredients in each portion after breaking the FDC tablets, and concern that pharmacokinetic maturation could still be incomplete in young children.9,32,33 Our proposed doses were optimized assuming that dividing the FDC tablets should be avoided if possible.
The typical paediatric parameter estimates for rifampicin CL/F and Vc/F are in line with adult values reported in an ethnically similar population.24 After adjusting for the difference in body size (the median weight of the adult population used for comparison was 50 kg), CL/F was 23.1 L/h in children versus 19.2 L/h in adults and Vc/F was 64.8 versus 53.2 L, respectively. This suggests that pharmacokinetic differences between children and adults could mainly be explained by differences in body size (which was accounted for by allometric scaling in our models) and enzyme maturation. Our data did not support non-linearity in the pharmacokinetics of rifampicin, even though the doses given ranged from ∼5 to almost 18 mg/kg daily. Our results therefore suggest that at the doses used in the children studied, rifampicin may not display the dose-dependent non-linear pharmacokinetics in children that has been described in adults.34 However, further studies, including sufficient numbers of children being given the increased dosages, would be needed to confirm this. Low rifampicin concentrations are associated with the development of acquired rifamycin monoresistance (ARR)35 and a Cmax of 8 mg/L has been suggested for rifampicin,36 although even higher concentrations are likely necessary for maximal bactericidal activity.6 However, such concentrations are rarely achieved in children prescribed 8–12 mg/kg/day doses of rifampicin.8 If the pharmacokinetics in an ethnically similar adult population24 given the currently recommended doses is used for comparison, the majority of our children fall within the 5th–95th percentile range of exposures in the adult patients (Figure 3). The simulated adult exposures were similar to those found in a large pharmacokinetic study conducted in adults with pulmonary tuberculosis in Botswana.37 Our simulations for children using the newly recommended WHO paediatric guidelines predicted more variable rifampicin exposures than those for the reference adult population (Figure 3). Moreover, both the predicted mean Cmax using the revised paediatric guidelines (6.6 mg/L) and the current doses recommended by WHO in the adult reference population (4.8 mg/L) were lower than the proposed minimum Cmax of 8 mg/L,36 implying that even higher doses of rifampicin should be considered for both children and adults.
Using the final pyrazinamide model and parameter estimates for CL/F and Vc/F scaled to the median weight of the adult population used for comparison (51.5 kg),30 the children had similar CL/F (∼3.1 versus 3.42 L/h) and higher Vc/F (39.7 versus 29.2 L) compared with the adults. The higher Vc/F in children could partly be due to malnutrition and severe forms of tuberculosis disease. When we targeted previously reported exposures in an ethnically similar adult population who received doses recommended by WHO, our simulation results predicted that children weighing 5.0–7.9 kg may be underdosed (Figure 4). As noted above, children in the lowest weight band tended to receive doses somewhat lower than the 30–40 mg/kg target proposed in the revised guidelines. Our simulations suggest that a 50 mg/kg dose for children in the lowest weight band of 5.0–7.9 kg would achieve the same median AUC as that in the adults. The pyrazinamide exposures we simulated for our reference adult population were similar to those in the large cohort in Botswana.37 In addition, the majority of adults had simulated Cmax within the suggested range of 20–50 mg/L.36 Importantly, patients in the Botswana cohort with pyrazinamide Cmax <35 mg/L had an increased risk of poor treatment outcome.
Isoniazid pharmacokinetics is highly dependent on the polymorphic NAT2, which is a major determinant of isoniazid plasma concentrations.38 Targeting average exposures simulated for ethnically similar adults following doses currently recommended by WHO, the new doses recommended by the WHO for children are adequate for slow acetylators, but insufficient for intermediate and fast acetylators (Figure 5). We have noted wide IIV in the systemic concentrations and AUC mostly because children were not dosed according to the NAT2 acetylator genotype. Hence, further studies are needed to adequately define the implications of IIV for safety and efficacy in children. Interestingly, children who were younger than 1 year old had higher AUC irrespective of their weight band. In addition, isoniazid CL showed maturation with age and this supports the notion that finer weight bands in conjunction with age should be considered to avoid overdosing very young children. The reduced bioavailability for intermediate and fast acetylators is most likely a result of increased pre-systemic metabolism, which also correlates with systemic clearance. The lower exposure in intermediate and fast acetylators may predispose to the development of ARR. In the CDC Study 22,39 an association was found between low isoniazid plasma concentrations and the occurrence of relapse in patients on a regimen of once-weekly rifapentine and isoniazid, suggesting that isoniazid might have been ineffective in preventing the development of rifamycin resistance.
In all our models, we decided to scale clearance and volume with allometric scaling and this choice over using weight as a linear covariate was also supported by the data following general criteria such as the NONMEM OFV. The use of allometrics to account for differences in pharmacokinetics due to body size is supported by both empirical observation and biological theory, as discussed in depth by Anderson and Holford.20,21
Although our children received similar formulations across the two cohorts, formulation is known to be an important determinant of bioavailability.40,41 Other factors encountered when preparing suspensions and administering the drug are likely to play a role in young children who cannot swallow tablets. There is a need for studies to evaluate such sources of variability in paediatric drug exposure and to develop solutions to reduce it. Genetic diversity is also an important consideration when extrapolating the results of pharmacokinetic studies. There is considerable geographical variation in the distribution of NAT2 polymorphisms.42,43 Moreover, recent studies have identified polymorphisms of SLCO1B1 (which encodes the OATP1B1 transporter) occurring in relatively high frequencies in African populations, associated with substantially reduced rifampicin exposure.25,44 Hence, pharmacogenetic studies in children may allow further optimization of dosing strategies.
Limitations of our model include the fact that the AMA values and z scores used to test anthropometric associations with the pharmacokinetic parameters were not derived specifically from an African population and thus they may not have correctly described the children in our study population. Finally, a limitation of our simulation approach is that it does not account for any non-linearity in the pharmacokinetics that may occur at the higher doses; hence, our predictions should be confirmed in pharmacokinetic studies in children dosed according to the revised guidelines.
In conclusion, our models describe the population pharmacokinetics of rifampicin, pyrazinamide and isoniazid in children with tuberculosis. Simulations based on our models predict that the newly recommended weight band-based doses in WHO guidelines for children result in rifampicin exposures in our paediatric population that are similar to those in adults. However, when dosed in pragmatic weight bands, there is wide variability in drug exposure and pyrazinamide and isoniazid exposures in many children will be lower than those in an ethnically similar adult population. Hence, adjustment of the recommended doses may be warranted should the findings be confirmed in other populations.
Funding
The clinical study was funded by Bristol-Myers Squibb ‘Secure the Future’ Foundation. S. P. Z. and P. D. received support from the Wellcome Trust, UK (grant numbers WT081199/Z/06/Z and WT083851/Z/07/Z, respectively). P. R. D. and H. S. S. are supported by the South African National Research Foundation. J. A. S. was supported by a grant from the Sir Halley Stewart Trust.
Transparency declarations
None to declare.
Supplementary data
Acknowledgements
We acknowledge: A. C. Hesseling, K. Magdorf, B. Rosenkranz and other contributors to the clinical studies; J. J. Wilkins for providing data to support adult exposure estimations; and N. H. G. Holford for assistance when testing the enzyme maturation model.
References
- 1.WHO. Global Tuberculosis Report 2013. Geneva: WHO; http://apps.who.int/iris/bitstream/10665/91355/1/9789241564656_eng.pdf. (31 December 2013, date last accessed) [Google Scholar]
- 2.Marais BJ, Hesseling AC, Gie RP, et al. The burden of childhood tuberculosis and the accuracy of community-based surveillance data. Int J Tuberc Lung Dis. 2006;10:259–63. [PubMed] [Google Scholar]
- 3.Hu Y, Coates AR, Mitchison DA. Sterilising action of pyrazinamide in models of dormant and rifampicin-tolerant Mycobacterium tuberculosis. Int J Tuberc Lung Dis. 2006;10:317–22. [PubMed] [Google Scholar]
- 4.Steele MA, Des Prez RM. The role of pyrazinamide in tuberculosis chemotherapy. Chest. 1988;94:845–50. doi: 10.1378/chest.94.4.845. [DOI] [PubMed] [Google Scholar]
- 5.Mitchison DA. Role of individual drugs in the chemotherapy of tuberculosis. Int J Tuberc Lung Dis. 2000;4:796–806. [PubMed] [Google Scholar]
- 6.Gumbo T, Louie A, Deziel MR, et al. Concentration-dependent Mycobacterium tuberculosis killing and prevention of resistance by rifampin. Antimicrob Agents Chemother. 2007;51:3781–8. doi: 10.1128/AAC.01533-06. [DOI] [PMC free article] [PubMed] [Google Scholar]
- 7.McIlleron H, Willemse M, Werely CJ, et al. Isoniazid plasma concentrations in a cohort of South African children with tuberculosis: implications for international pediatric dosing guidelines. Clin Infect Dis. 2009;48:1547–53. doi: 10.1086/598192. [DOI] [PubMed] [Google Scholar]
- 8.Schaaf HS, Willemse M, Cilliers K, et al. Rifampin pharmacokinetics in children, with and without human immunodeficiency virus infection, hospitalized for the management of severe forms of tuberculosis. BMC Med. 2009;7:19. doi: 10.1186/1741-7015-7-19. [DOI] [PMC free article] [PubMed] [Google Scholar]
- 9.Schaaf HS, Parkin DP, Seifart HI, et al. Isoniazid pharmacokinetics in children treated for respiratory tuberculosis. Arch Dis Child. 2005;90:614–8. doi: 10.1136/adc.2004.052175. [DOI] [PMC free article] [PubMed] [Google Scholar]
- 10.Kearns GL, Abdel-Rahman SM, Alander SW, et al. Developmental pharmacology—drug disposition, action, and therapy in infants and children. N Engl J Med. 2003;349:1157–67. doi: 10.1056/NEJMra035092. [DOI] [PubMed] [Google Scholar]
- 11.Gurumurthy P, Ramachandran G, Hemanth Kumar AK, et al. Decreased bioavailability of rifampin and other antituberculosis drugs in patients with advanced human immunodeficiency virus disease. Antimicrob Agents Chemother. 2004;48:4473–5. doi: 10.1128/AAC.48.11.4473-4475.2004. [DOI] [PMC free article] [PubMed] [Google Scholar]
- 12.WHO. Rapid Advice: Treatment of Tuberculosis in Children. Geneva: WHO; 2010. http://whqlibdoc.who.int/publications/2010/9789241500449_eng.pdf. (14 September 2011, date last accessed) [PubMed] [Google Scholar]
- 13.WHO. Annual Meeting of the Childhood TB Subgroup, Kuala Lumpur, 11 November 2012: Meeting Report. Geneva: WHO, Stop TB Partnership; 2012. http://www.stoptb.org/wg/dots_expansion/childhoodtb/assets/documents/Report%20Child%20TB%20Subgroup%20Meeting%2011%20Nov%202012%20final.pdf. (18 February 2013, date last accessed) [Google Scholar]
- 14.McIlleron H, Willemse M, Schaaf HS, et al. Pyrazinamide plasma concentrations in young children with tuberculosis. Pediatr Infect Dis J. 2011;30:262–5. doi: 10.1097/inf.0b013e3181fbefe1. [DOI] [PubMed] [Google Scholar]
- 15.Thee S, Seddon JA, Donald PR, et al. Pharmacokinetics of isoniazid, rifampin, and pyrazinamide in children younger than two years of age with tuberculosis: evidence for implementation of revised World Health Organization recommendations. Antimicrob Agents Chemother. 2011;55:5560–7. doi: 10.1128/AAC.05429-11. [DOI] [PMC free article] [PubMed] [Google Scholar]
- 16.McIlleron H, Norman J, Kanyok TP, et al. Elevated gatifloxacin and reduced rifampicin concentrations in a single-dose interaction study amongst healthy volunteers. J Antimicrob Chemother. 2007;60:1398–401. doi: 10.1093/jac/dkm393. [DOI] [PubMed] [Google Scholar]
- 17.Beal S, Sheiner LB, Boeckmann A, et al. NONMEM User's Guides (1989–2009) Ellicott City, MD: Icon Development Solutions; 2009. [Google Scholar]
- 18.Karlsson MO, Sheiner LB. The importance of modeling interoccasion variability in population pharmacokinetic analyses. J Pharmacokinet Biopharm. 1993;21:735–50. doi: 10.1007/BF01113502. [DOI] [PubMed] [Google Scholar]
- 19.Jonsson EN, Karlsson MO. Xpose—an S-PLUS based population pharmacokinetic/pharmacodynamic model building aid for NONMEM. Comput Methods Programs Biomed. 1999;58:51–64. doi: 10.1016/s0169-2607(98)00067-4. [DOI] [PubMed] [Google Scholar]
- 20.Anderson BJ, Holford NH. Mechanism-based concepts of size and maturity in pharmacokinetics. Annu Rev Pharmacol Toxicol. 2008;48:303–32. doi: 10.1146/annurev.pharmtox.48.113006.094708. [DOI] [PubMed] [Google Scholar]
- 21.Anderson BJ, Holford NH. Mechanistic basis of using body size and maturation to predict clearance in humans. Drug Metab Pharmacokinet. 2009;24:25–36. doi: 10.2133/dmpk.24.25. [DOI] [PubMed] [Google Scholar]
- 22.Engle WA. Age terminology during the perinatal period. Pediatrics. 2004;114:1362–4. doi: 10.1542/peds.2004-1915. [DOI] [PubMed] [Google Scholar]
- 23.Savic RM, Jonker DM, Kerbusch T, et al. Implementation of a transit compartment model for describing drug absorption in pharmacokinetic studies. J Pharmacokinet Pharmacodyn. 2007;34:711–26. doi: 10.1007/s10928-007-9066-0. [DOI] [PubMed] [Google Scholar]
- 24.Wilkins JJ, Savic RM, Karlsson MO, et al. Population pharmacokinetics of rifampin in pulmonary tuberculosis patients, including a semimechanistic model to describe variable absorption. Antimicrob Agents Chemother. 2008;52:2138–48. doi: 10.1128/AAC.00461-07. [DOI] [PMC free article] [PubMed] [Google Scholar]
- 25.Chigutsa E, Visser ME, Swart EC, et al. The SLCO1B1 rs4149032 polymorphism is highly prevalent in South Africans and is associated with reduced rifampin concentrations: dosing implications. Antimicrob Agents Chemother. 2011;55:4122–7. doi: 10.1128/AAC.01833-10. [DOI] [PMC free article] [PubMed] [Google Scholar]
- 26.Heymsfield SB, Olafson RP, Kutner MH, et al. A radiographic method of quantifying protein-calorie undernutrition. Am J Clin Nutr. 1979;32:693–702. doi: 10.1093/ajcn/32.3.693. [DOI] [PubMed] [Google Scholar]
- 27.Gibson R. Principles of Nutritional Assessment, Second Edition. New York: Oxford University Press; 2005. Anthropometric assessment of body size; pp. 255–6. [Google Scholar]
- 28.Holford N. The visual predictive check—superiority to standard diagnostic (Rorschach) plots. Abstracts of the Fourteenth Population Approach Group in Europe Meeting, Pamplona, 2005; Abstract 738. http://www.page-meeting.org/?abstract=738. (10 January 2014, date last accessed) [Google Scholar]
- 29.Wilkins JJ, Langdon G, McIlleron H, et al. Variability in the population pharmacokinetics of isoniazid in South African tuberculosis patients. Br J Clin Pharmacol. 2011;72:51–62. doi: 10.1111/j.1365-2125.2011.03940.x. [DOI] [PMC free article] [PubMed] [Google Scholar]
- 30.Wilkins JJ, Langdon G, McIlleron H, et al. Variability in the population pharmacokinetics of pyrazinamide in South African tuberculosis patients. Eur J Clin Pharmacol. 2006;62:727–35. doi: 10.1007/s00228-006-0141-z. [DOI] [PubMed] [Google Scholar]
- 31.WHO. National Tuberculosis Management Guidelines 2008. Geneva: WHO; http://www.who.int/hiv/pub/guidelines/south_africa_tb.pdf. (10 February 2013, date last accessed) [Google Scholar]
- 32.Pariente-Khayat A, Rey E, Gendrel D, et al. Isoniazid acetylation metabolic ratio during maturation in children. Clin Pharmacol Ther. 1997;62:377–83. doi: 10.1016/S0009-9236(97)90115-6. [DOI] [PubMed] [Google Scholar]
- 33.Zhu R, Kiser JJ, Seifart HI, et al. The pharmacogenetics of NAT2 enzyme maturation in perinatally HIV exposed infants receiving isoniazid. J Clin Pharmacol. 2012;52:511–9. doi: 10.1177/0091270011402826. [DOI] [PMC free article] [PubMed] [Google Scholar]
- 34.Pargal A, Rani S. Non-linear pharmacokinetics of rifampicin in healthy Asian Indian volunteers. Int J Tuberc Lung Dis. 2001;5:70–9. [PubMed] [Google Scholar]
- 35.Mitchison DA. Development of rifapentine: the way ahead. Int J Tuberc Lung Dis. 1998;2:612–5. [PubMed] [Google Scholar]
- 36.Peloquin CA. Therapeutic drug monitoring in the treatment of tuberculosis. Drugs. 2002;62:2169–83. doi: 10.2165/00003495-200262150-00001. [DOI] [PubMed] [Google Scholar]
- 37.Chideya S, Winston CA, Peloquin CA, et al. Isoniazid, rifampin, ethambutol, and pyrazinamide pharmacokinetics and treatment outcomes among a predominantly HIV-infected cohort of adults with tuberculosis from Botswana. Clin Infect Dis. 2009;48:1685–94. doi: 10.1086/599040. [DOI] [PMC free article] [PubMed] [Google Scholar]
- 38.Parkin DP, Vandenplas S, Botha FJ, et al. Trimodality of isoniazid elimination: phenotype and genotype in patients with tuberculosis. Am J Respir Crit Care Med. 1997;155:1717–22. doi: 10.1164/ajrccm.155.5.9154882. [DOI] [PubMed] [Google Scholar]
- 39.Weiner M, Benator D, Burman W, et al. Association between acquired rifamycin resistance and the pharmacokinetics of rifabutin and isoniazid among patients with HIV and tuberculosis. Clin Infect Dis. 2005;40:1481–91. doi: 10.1086/429321. [DOI] [PubMed] [Google Scholar]
- 40.Agrawal S, Singh I, Kaur KJ, et al. Bioequivalence trials of rifampicin containing formulations: extrinsic and intrinsic factors in the absorption of rifampicin. Pharmacol Res. 2004;50:317–27. doi: 10.1016/j.phrs.2004.01.009. [DOI] [PubMed] [Google Scholar]
- 41.McIlleron H, Wash P, Burger A, et al. Determinants of rifampin, isoniazid, pyrazinamide, and ethambutol pharmacokinetics in a cohort of tuberculosis patients. Antimicrob Agents Chemother. 2006;50:1170–7. doi: 10.1128/AAC.50.4.1170-1177.2006. [DOI] [PMC free article] [PubMed] [Google Scholar]
- 42.Fuselli S, Gilman RH, Chanock SJ, et al. Analysis of nucleotide diversity of NAT2 coding region reveals homogeneity across Native American populations and high intra-population diversity. Pharmacogenomics J. 2007;7:144–52. doi: 10.1038/sj.tpj.6500407. [DOI] [PMC free article] [PubMed] [Google Scholar]
- 43.Sabbagh A, Darlu P, Crouau-Roy B, et al. Arylamine N-acetyltransferase 2 (NAT2) genetic diversity and traditional subsistence: a worldwide population survey. PLoS One. 2011;6:e18507. doi: 10.1371/journal.pone.0018507. [DOI] [PMC free article] [PubMed] [Google Scholar]
- 44.Weiner M, Peloquin C, Burman W, et al. Effects of tuberculosis, race, and human gene SLCO1B1 polymorphisms on rifampin concentrations. Antimicrob Agents Chemother. 2010;54:4192–200. doi: 10.1128/AAC.00353-10. [DOI] [PMC free article] [PubMed] [Google Scholar]
Associated Data
This section collects any data citations, data availability statements, or supplementary materials included in this article.