

Abstract
The striatum acts in conjunction with the cortex to control and execute functions that are impaired by abnormal dopamine neurotransmission in disorders such as Parkinson's and schizophrenia. To date, in vivo quantification of striatal dopamine has been restricted to structure-based striatal subdivisions. Here, we present a multimodal imaging approach that quantifies the endogenous dopamine release following the administration of d-amphetamine in the functional subdivisions of the striatum of healthy humans with [11C]PHNO and [11C]Raclopride positron emission tomography ligands. Using connectivity-based (CB) parcellation, we subdivided the striatum into functional subregions based on striato-cortical anatomical connectivity information derived from diffusion magnetic resonance imaging (MRI) and probabilistic tractography. Our parcellation showed that the functional organization of the striatum was spatially coherent across individuals, congruent with primate data and previous diffusion MRI studies, with distinctive and overlapping networks. d-amphetamine induced the highest dopamine release in the limbic followed by the sensory, motor, and executive areas. The data suggest that the relative regional proportions of D2-like receptors are unlikely to be responsible for this regional dopamine release pattern. Notably, the homogeneity of dopamine release was significantly higher within the CB functional subdivisions in comparison with the structural subdivisions. These results support an association between local levels of dopamine release and cortical connectivity fingerprints.
Keywords: diffusion-weighted image, dopamine receptors, positron emission tomography, probabilistic tractography, striatum
Introduction
Over the last 2 decades, the dopaminergic system has been studied extensively with positron emission tomography (PET; Egerton et al. 2009; Laruelle 2012). These imaging studies have investigated the density and distribution of dopamine receptors, dopamine synthesis, and dopamine release into the extracellular space following a range of pharmacological or behavioral stimuli in healthy and diseased populations (Boileau et al. 2009; Searle et al. 2010; Kegeles et al. 2010; Mizrahi et al. 2011, 2012; Banerjee and Prante 2012; Boileau et al. 2012; Suridjan et al. 2012). The basal ganglia (BG), and in particular the striatum, has been the focus due to an abundance of dopamine receptors and involvement in dopamine-related diseases such as Parkinson's and schizophrenia. The striatum acts in conjunction with the cortex to control and execute functions and has been divided into closed cortical—BG—thalamo-cortical loops (limbic, executive, motor, and sensory) with each structure maintaining the functional characteristics of the projective region (Parent and Hazrati 1995; Haber 2003; Haber et al. 2006). The striatum is a heterogeneous structure, which consists of 3 cytoarchitectonically undifferentiated areas: The caudate (CD), putamen (PU), and nucleus accumbens. While the CD and PU are anatomically separate nuclei, the nucleus accumbens has been defined simply as the ventral striatal region abutting the septum.
Autoradiography and molecular PET imaging studies have shown that the receptors and release of dopamine are not always uniformly distributed or released within the traditional structural striatal subdivisions (Staley and Mash 1996; Gurevich and Joyce 1999; Martinez et al. 2003; Drevets et al. 1999). Nevertheless, to date, the regional quantification of dopamine release within the striatum has been based on these traditional subdivisions (Drevets et al. 1999; Martinez et al. 2003; Narendran et al. 2004; Shotbolt et al. 2012). More recently, functional subdivisions of the primate and human striatum have been introduced based on the distribution of its cortical inputs (Selemon and Goldman-Rakic 1985; Parent and Hazrati 1995; Haber 2003; Lehéricy et al. 2004; Croxson et al. 2005; Leh et al. 2007; Draganski et al. 2008; Cohen et al. 2009; Bohanna et al. 2011; Tziortzi, Searle, Tsoumpas, et al. 2011). These studies demonstrate the existence of individual and overlapping cortical-striatal networks and reveal the topographical organization of these networks. Moreover, it has been shown (Haber et al. 2006) that the limbic portion of the striatum occupies a large rostral striatal region that extends beyond the boundaries of the nucleus accumbens.
The aim of this study is to quantify amphetamine-induced dopamine release in the connectivity-based (CB) functional subdivisions of the human striatum. Quantification of dopamine in the functional territories may provide new insights about dopamine function, help understand the neurochemical organization, and potentially help the development of novel therapeutic compounds and the comprehension of dopamine-related neurological disorders. The first part of this study determines, in individual subjects, the cortical-striatal projections to functionally parcellate the striatum using diffusion-weighted MRI and probabilistic tractography (Behrens, Johansen-Berg, et al. 2003). The second part applies these functional subdivisions to PET neurotransmission data to quantify regional dopamine release following the administration of d-amphetamine. To examine whether the dopamine release has a functional or a structural specificity, dopamine is also measured in the structural subdivisions of the striatum in the same subjects and the measurements are compared. PET data from 2 D2/D3 dopamine ligands were investigated: The agonist (+)4-propyl-9-hydroxynaphthoxazine ([11C]PHNO), which has a preferential affinity for the D3 receptor (Gallezot et al. 2012) and the antagonist [11C]Raclopride, which has equal affinity for the D2/D3 receptors. This enables testing of the robustness of the findings across 2 PET radioligands and investigation of whether the regional detection of dopamine release depends upon the relative distribution of the D2/D3 receptors and the ligands preferential affinities.
Materials and Methods
In the first part of the study, probabilistic tractography is used to parcellate the human striatum into CB functional regions of interest (ROIs) based on the striato-cortical connections. To obtain the CB functional regions in each subject, a 2-phase procedure was applied: 1) Projections from the 4 brain lobes (frontal, parietal, occipital, and temporal) to the striatum were estimated, and the striatal areas associated with each lobe were established; 2) the frontal lobe was subdivided into 4 anatomical ROIs, each associated with a particular functional specialization (limbic, executive, rostral-motor, and caudal-motor). Subsequently projections between these anatomical ROIs and the striatal area associated with the frontal lobe were estimated (Fig. 1B, Methods overview).
Figure 1.
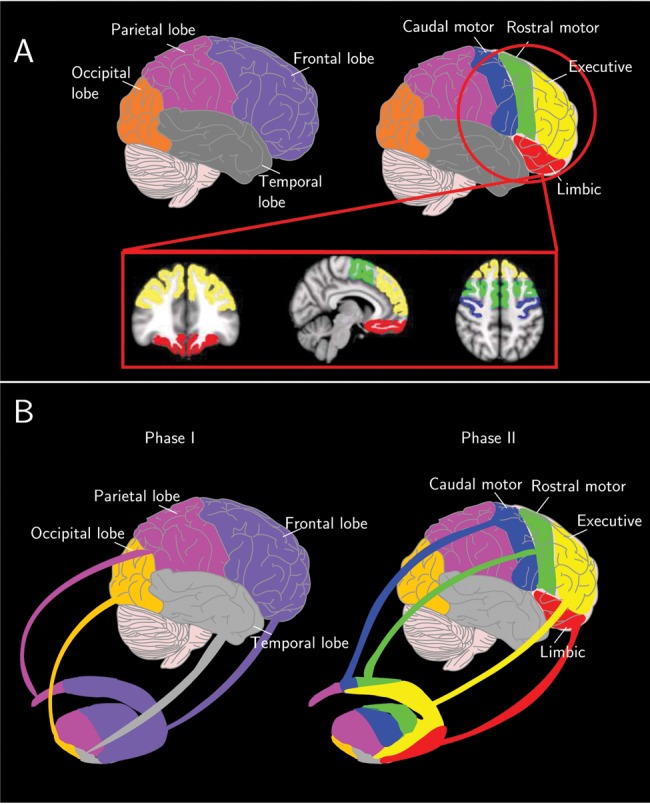
(A) Cortical subdivisions. Purple corresponds to the frontal lobe, magenta to the parietal lobe, gray to the temporal lobe, and orange to the occipital lobe. Yellow corresponds to the executive, red to the limbic, green to the rostral-motor, and blue to the caudal-motor. (B) Methods overview. To obtain the CB functional regions in each subject, a 2-step procedure was applied: (Phase I) the projections from the 4 brain lobes (frontal, parietal, occipital, and temporal) to the striatum were calculated, and the striatal areas associated with each lobe were established. (Phase II) The frontal lobe was subdivided into 4 anatomical ROIs, each associated with a particular functional specialization (limbic, executive, rostral-motor, and caudal-motor), and projections between these anatomical ROIs and the striatal area associated with the frontal lobe were estimated
In the second part of the paper, these functional subdivisions were used in conjunction with [11C]PHNO and [11C]Raclopride PET neurotransmission data in order to quantify regional specific dopamine release following a d-amphetamine challenge. For comparison, the dopamine release was also quantified within structural subdivisions (Martinez et al. 2003; Tziortzi, Searle, Tzimopoulou, et al. 2011).
Subjects
The study was conducted at the GlaxoSmithKline Clinical Imaging Centre, Hammersmith Hospital, London and was approved by Essex 1 Research Ethics Committee and the Administration of Radioactive Substances Advisory Committee (ARSAC), and subjects provided written informed consent. The data analyzed and presented here were obtained from a cohort of subjects described previously (Shotbolt et al. 2012). In short, 12 healthy male volunteers were recruited aged between 25 and 55 years, free from clinically significant illness or disease as determined by their medical history and standard laboratory tests. Each subject underwent a series of MRI and PET scans including a T1-weighted and diffusion-weighted MRI. Nine subjects completed 4 PET scans, 2 with [11C]PHNO, and 2 with [11C]Raclopride in a counterbalanced order. A further 3 subjects received only 2 [11C]PHNO scans as 2 of them dropped out of the study, and the third was withdrawn because of an incidental finding. For each ligand, subjects initially received a baseline scan and then d-amphetamine was orally administered (0.3 mg/kg) on an empty stomach 3 h prior to the start of the challenge scan.
Image Acquisition and Preprocessing
MRI
High-resolution T1-weighted and diffusion-weighted images (DWIs) were acquired with a 32-channel head coil on a Siemens Tim Trio, 3-T MRI scanner (Siemens Healthcare, Erlangen, Germany). An isotropic T1-weighted (1 mm3) image was acquired with a magnetization-prepared rapid gradient echo (MPRAGE) sequence [time repetition (TR) = 3000 ms, time echo (TE) = 3.66 ms, flip angle of 9°, time to inversion (TI) = 1100 ms, matrix = 256 × 192]. A parallel imaging factor of 2 was applied to enable an acquisition time of 321 s).
Diffusion-weighted data were acquired using echo planar imaging (EPI; TR = 9000 ms, TE = 86 ms, flip angle of 90° and voxel size of 1.875 × 1.875 × 1.9 mm3). The diffusion weighting was isotropically distributed along the 30 directions (b-value = 1000 s/mm2), and a non-DWI (B0) was acquired at the beginning of each scan. EPI acquisitions are prone to geometric distortions that can lead to errors in tractography. To minimize this, 2 image sets were acquired with the phase-encoded direction reversed—“blip-up” and “blip-down” (Chang and Fitzpatrick 1992)—resulting in images with geometric distortions of equal magnitude but in the opposite direction allowing for the calculation of a corrected image (Andersson et al. 2003). Before correcting geometric distortions, each image set—blip-up and blip-down—was corrected for motion and eddy-current-related distortions. Diffusion data analysis was performed with the FSL tools (FMRIB Centre Software Library, Oxford University; http://www.fmrib.ox.ac.uk/fsl/).
PET
All subjects were scanned on a Siemens Biograph HiRez XVI PET scanner (Siemens Healthcare, Erlangen, Germany), under baseline conditions (no challenge) and 3 h following the oral administration of 0.3 mg/kg of d-amphetamine. For each scan, subjects were injected with a single intravenous bolus of [11C]PHNO or [11C]Raclopride, and dynamic emission data were acquired continuously for 90 min. Six of the subjects had their 2 [11C]PHNO scans on the same day with at least 5 h between [11C]PHNO injections, whereas the other 6 subjects had their 2 scans on separate days. [11C]Raclopride scans were acquired on the same day. The dynamic images were reconstructed, into 26 frames (8 × 15 s, 3 × 1 min, 5 × 2 min, 5 × 5 min, and 5 × 10 min), using a filtered back projection algorithm (direct inversion Fourier transform) with a 128 matrix, zoom of 2.6 producing images with isotropic voxel size of 2 × 2 × 2 mm3, and a transaxial Gaussian filter of 5 mm. A low-dose computed tomography scan (effective dose of 0.2 mSv) was acquired for attenuation and scatter correction. The dynamic PET data were corrected for motion via frame-to-frame image registration and aligned with the structural T1 MRI image using SPM5b (Wellcome Trust Centre for Neuroimaging, http://www.fil.ion.ucl.ac.uk/spm) with a mutual information cost function.
CB Functional Subdivision of the Striatum
Probabilistic Tractography
The FMRIB's diffusion toolbox (http://www.fmrib.ox.ac.uk/fsl/fdt) was used to perform probabilistic tractography with a partial volume model (Behrens, Woolrich, et al. 2003) allowing for up to 2 fiber directions in each voxel (Behrens et al. 2007). Five thousand sample tracts were generated from each voxel in the seed mask (striatum). Tractography was performed in the subjects' continuous space, and the results were output in the Montreal Neurological Institute (MNI) space by providing transformation parameters estimated via a 2-step procedure as follows: 1) The fractional anisotropy (FA) image was registered to each subject's high-resolution T1-weighted image using FMRIB's linear image registration tool (FLIRT) (Jenkinson et al. 2002) with 6 degrees of freedom and a mutual information cost function; 2) the T1-weighted image was nonlinearly registered to the 1 × 1 × 1 mm3 nonlinear MNI template with with FMRIB’s non-linear image registration tool (FNIRT). The transformation parameters obtained from these 2 steps were concatenated to yield the mapping from the DWI to MNI space.
Functional Subdivision—Phase I
The projections from the striatum to the frontal, parietal, occipital, and temporal cortical areas were estimated. For each striatal voxel, we calculated the probability of connection to each area as the proportion of the total number of samples, which originate from this voxel and reach any cortical area. Then, the striatum was segmented by assigning each voxel to the lobe with which it had the highest connection probability (Johansen-Berg et al. 2005). After this “hard” segmentation, the areas in striatum that associate with each lobe were established.
Functional Subdivision—Phase II
The striatal area found in phase I to be associated with the frontal lobe is further subdivided into the following functional regions: 1) limbic, involved in emotions, reward, and motivation; 1) executive, linked to executive processes such as perception, memory, reasoning, and judgment; 3) rostral-motor, involved in the planning and control of movements; and 4) caudal-motor, involved with the execution of movements. Four frontal lobe anatomical subdivisions (described below), each associated with the aforementioned functions, were used to estimate the connections with the striatal area associated with the frontal lobe. Note that the prefrontal ROIs were not derived from functional MRI experiments, but make use of the known areas of specific brain function as determined from the human and primate literature.
For each subject and hemisphere, 7 connection maps were derived, one for each cortical target (limbic, executive, rostral-motor, caudal-motor, parietal, occipital, and temporal). Since individual and overlapping cortical-striatal networks exist, striatal voxels are connected exclusively either to a cortical target or show connectivity to multiple cortical regions. To accommodate this finding, we process the connectivity maps in 2 different ways:
For each subject, exclusive CB functional ROIs were created following the procedures described by Johansen-Berg and colleagues (2005). In brief, for each striatal voxel, the probability of connection to each cortical target was calculated as a proportion of the total number of samples from that voxel that reach any cortical area. Next, each voxel was assigned to the cortical target with the highest connection probability. The functional subdivision obtained with this method will be termed connectivity-based areas (CB).
Each subject's connectivity maps were thresholded at 5% (Croxson et al. 2005) of the maximum connectivity value to exclude noise and voxels with low connectivity values. This allowed functional subdivisions to have a certain degree of overlap (overlapping networks). The functional subdivision obtained with this method will be termed connectivity-based areas with overlaps (CBo).
Regions of Interest Preparation
The complete striatum outline was manually defined on the subject's T1-weighted image, and the cortical lobes were obtained from the CIC atlas (Tziortzi, Searle, Tzimopoulou, et al. 2011) a modification of the Harvard-Oxford atlas. In addition, the frontal lobe was subdivided into 4 anatomical regions, based on known anatomical classification of function (Fig. 1A). Details of the 4 frontal lobe subdivisions are as follows:
Limbic Target
The structures comprising the limbic anatomical ROI are the anterior orbital gyrus, posterior orbital gyrus, medial orbital gyrus, gyrus rectus (Chiavaras and Petrides 2000), and subcallosal gyrus—ventral anterior cingulate (parolfactory area—area 25). The lateral orbital gyrus was excluded since several studies report that it has a different connectivity pattern and function from the medial orbital cortex (Kringelbach and Rolls 2004; Wallis 2007).
Executive Target
The functional map proposed by Petrides (2005) was adopted to delineate areas 9, 9/46 and area 10 of the dorsolateral prefrontal cortex that constituted the executive ROI. Anatomically, the ROI consisted of the rostral superior and middle frontal gyri and the dorsal prefrontal cortex (3-mm dorsal the mid-sagittal most anterior and dorsal tip of gyrus rectus, where area 10 is situated).
Rostral-Motor Target
The caudal portions of lateral and medial superior gyrus as well as the caudal middle and inferior frontal gyri were included in the rostral-motor target. These anatomical regions correspond functionally to rostral area 6, pre-SMA, and the frontal eye field region.
Caudal-Motor Target
Includes the precentral gyrus that corresponds functionally to the primary motor cortex (area 4) and the caudal premotor area (caudal area 6). The paracentral lobule was excluded from the target.
To tailor the cortical ROIs to the subjects' individual anatomy, the subjects' segmented gray matter (GM) and FA images, both normalized to the MNI template, were employed to mask the ROIs. The lower threshold for the GM mask was set at 0.25, and the FA mask upper threshold was set at 0.40.
Structural Subdivision and Structure-Based Functional Subdivision of the Striatum
A structure-based (SB) method that uses anatomical landmarks to subdivide the striatum, based on a previously described method (Tziortzi, Searle, Tzimopoulou, et al. 2011), was also employed for comparison with the connectivity approach presented here. Several studies have shown that there is not a definitive anatomical, histological, or histochemical distinction between nucleus accumbens, CD, and PU. Therefore, SB methods (Drevets et al. 1999; Mawlawi et al. 2001; Martinez et al. 2003; Tziortzi, Searle, Tzimopoulou, et al. 2011) use arbitrary anatomical landmarks in an attempt to subdivide the striatum. In this study the striatum is subdivided into: 1) CD, PU, and ventral striatum (VST). All the ROIs are defined on each subject's T1-weighted image following the guidelines detailed in Tziortzi, Searle, Tzimopoulou, et al. (2011). This subdivision will be referred to as SB ROIs; 2) the delineated PU is subdivided into pre- and postcommissural as described by Martinez et al. (2003). This technique was proposed in an attempt to structurally approach the functional organization of the striatum. Specifically, the VST is classified as limbic striatum, the postcommissural PU as sensorimotor, and the precommissural PU with CD as executive. These subdivisions will be referred to as structure-based functional (SBf) ROIs.
Quantification of Regional Dopamine Release
The basis function implementation of the simplified reference tissue model (Lammertsma and Hume 1996; Gunn et al. 1997) was applied to the dynamic [11C]PHNO and [11C]Raclopride PET data. Using the cerebellum as a reference region, we derived parametric images of the nondisplaceable binding potential (BPND), which is proportional to the receptor availability. Each subject's pre- and post-d-amphetamine parametric images were coregistered using FLIRT (Jenkinson et al. 2002) and then transformed into the MNI space using the transformation parameters derived from nonlinearly registering the subject's T1-weighted image to the 1 × 1 × 1 mm3 nonlinear MNI template with FNIRT. Subsequently, the CB, CBo, SB, and SBf subdivisions of the striatum were applied to [11C]PHNO and [11C]Raclopride BPND parametric images to calculate the regional estimates of BPND. The fractional change between baseline and post-d-amphetamine conditions provides an index of the synaptic dopamine release as:
 |
(1) |
where  is the BPND in the baseline condition and
  is the BPND following the administration of d-amphetamine (Laruelle 2000). The coefficient of variation (%COV) for the dopamine release was calculated to provide an index of homogeneity of dopamine release within each subdivision.
Results
CB Functional Subdivision of the Striatum
Projections From Cortical Lobes—Phase I
While all cortical lobes project to the striatum, the areas that each lobe's efferent projections occupy are not equally represented. After hard segmentation of the striatum across subjects, the frontal lobe input dominates with 82 ± 7% of the total striatal volume (frontal lobe GM volume: 248 ± 14 cm3), followed by the parietal lobe with 11 ± 5% (parietal lobe GM volume: 116 ± 7 cm3), the temporal lobe with 5 ± 5% (temporal lobe GM volume: 114 ± 3 cm3), and the occipital lobe with 2 ± 1% (occipital lobe GM volume: 85 ± 3 cm3). The cortical projections were estimated for each subject, and the group average inputs in the MNI space are shown in Supplementary Figure S5A.
The frontal lobe input occupies almost the entire CD and precommissural PU extending up to the postcommissural PU. The parietal lobe, the second biggest cortical input, projects primarily to the postcommissural CD and PU with scattered projections observed in the precommissural CD. In contrast to the projections from the frontal and parietal lobes, the projections from the occipital and temporal lobes are more confined (Supplementary Fig. S5A,B). Small-interspersed projections from the temporal lobe were found in the precommissural CD, nucleus accumbens, and ventral postcommissural PU, while occipital projections were limited to the ventral postcommissural PU. The projections of each lobe occupy distinctive striatal areas with a significant degree of overlap observed between frontal and parietal lobes in the postcommissural PU and some overlap between frontal and temporal lobes in the nucleus accumbens and precommissural regions. The large number of frontal lobe projections into the striatum confirms that these 2 regions interact extensively to coordinate and execute function.
Projections From Frontal Lobe Subdivisions—Phase II
Distinct, overlapping and bilaterally symmetric projections from the 4 anatomical subdivisions of the frontal lobe (limbic, executive, rostral-motor, and caudal-motor) were derived (Fig. 2A) and shown to be similar to those obtained from nonhuman primate tracing studies (Haber et al. 2006; Calzavara et al. 2007) and confirmatory of previous human DWI studies (Lehéricy et al. 2004; Draganski et al. 2008). The limbic striatum occupies the nucleus accumbens and ventral precommissural CD and PU. Of particular interest, are the small patches of limbic projections observed in the ventral postcommissural PU, an area where projections from the temporal lobe and amygdala can also be found. For precommissural striatum, the executive projections reside in the central and dorsal striatum as opposed to the postcommissural striatum where they occupy the central and ventral zones. The rostral-motor target projects to an elongated area that occupies the dorsal tiers of PU and CD. In contrast, the caudal-motor projections are confined to the postcommissural PU with only a few low probability connections in the anterior dorsal CD. In postcommissural PU, caudal-motor projections occupy, in addition to dorsal areas, more central areas and its projections extend further caudal in comparison with the rostral-motor occupied area. Figures 2B and 3A show the subdivisions with the CB method in 4 representative subjects and the group averaged CB subdivisions, respectively. The subdivisions are symmetrical and spatially coherent across individuals. The group average subdivisions were defined using the methods described in Johansen-Berg et al. (2005).
Figure 2.

(A) Group average projections from the 4 frontal lobe target to the striatum. Each anatomical target is associated with a specific function; limbic (first column), executive (second), rostral-motor (third), and caudal-motor (fourth) functions. The rows correspond to different coronal planes (top row corresponds to rostral striatum and bottom row to caudal striatum). A threshold of 50 samples was applied to the image in order to discard noise and voxels with low connection probabilities. (B) Individual functional subdivisions in 4 randomly selected subjects (MNI space—coronal planes). Each column corresponds to a subject starting from rostral (top row) to caudal (bottom row). To obtain the functional subdivision for each subject, a 2-step procedure was applied. First, the projections from the 4 brain lobes (frontal, parietal, occipital, and temporal) were calculated and each lobe's dominant area was established. Subsequently, the frontal lobe was subdivided into 4 anatomical ROIs, each associated with a specific function (limbic, executive, rostral-motor, and caudal-motor), and the projection of each target to the frontal lobe dominant area was estimated. Each voxel was assigned to the target that gave the highest connection probability.
Figure 3.

(A) Group averaged functional subdivision of the striatum (MNI space—coronal planes). First column corresponds to the precommissural and second column to the postcommissural striatum. (B) Overlapping projections in the striatum (MNI space—coronal planes). The columns correspond to overlaps between: 1) limbic and executive (first column); 2) executive and rostral-motor (second column); 3) executive and caudal-motor (third column); and 4) rostral-motor and caudal-motor (fourth column). A threshold of 50 samples was applied to the projections and, subsequently, the overlapping areas were determined
The volume and percentage contribution to the total striatal volume of the cortical projections as defined with CBo and CB methods are shown in Table 1 with the projections from the executive target occupying the greatest area. Temporal and occipital lobes occupy with the CBo method 13.71% and 5.91% of the total striatal volume, respectively, while, with the CB method, they occupy only 5% and 2%. However, the connection probabilities from these lobes are low and following hard segmentation, these areas were small and not spatially consistent across individuals and, therefore, are not reported.
Table 1.
Volume and percentage contribution to the total striatal volume of (A) projections from each cortical target to the striatum after a threshold of 5% of the maximum connectivity value was applied (CBo, columns: 2–3); (B) the volumes obtained after assigning each voxel to the cortical target with the highest connection probability (CB, columns: 4–6)
| Region/function | CBo |
CB |
|||
|---|---|---|---|---|---|
| Volume (cm3) | Contribution to total striatal volume (%) | Volume (cm3) | Contribution to total striatal volume (%) | Contribution to frontal lobe associated volume (%) | |
| Limbic | 1.36 ± 0.49 | 11.68 ± 4.23 | 2.32 ± 0.79 | 20 ± 7 | 24 ± 9 |
| Executive | 3.04 ± 1.42 | 26.17 ± 12.37 | 5.73 ± 1.15 | 49 ± 9 | 60 ± 10 |
| Rostral-motor | 0.65 ± 0.40 | 5.64 ± 3.44 | 1.00 ± 0.53 | 9 ± 5 | 11 ± 6 |
| Caudal-motor | 0.65 ± 0. 38 | 5.61 ± 3.37 | 0.45 ± 0.30 | 4 ± 3 | 5 ± 3 |
| Parietal | 2.50 ± 1.02 | 21.51 ± 8.93 | 1.29 ± 0.52 | 11 ± 5 | – |
Note: Results are averaged between the left and right hemispheres.
To arithmetically assess the intersubject spatial consistency of the CB and CBo, we estimated the DICE coefficient, that is, the volume overlap of striatal subdivisions across subjects (detailed results in Supplementary Material). The DICE values obtained for the limbic, executive, and parietal striatum were high and satisfactory for the smaller rostral-motor and caudal-motor regions. For comparison, CB functional ROIs have been estimated with a threshold of 1% and 10%, and the volumes can be seen in Supplementary Table 3. Supplementary Figure S6 illustrates the impact of different thresholds on the topography and size of the cortical projections.
Frontal Lobe Overlapping Projections
Tracts from the frontal lobe led to overlapping pathways (Fig. 3B) and were categorized as: 1) limbic–executive, 2) executive–rostral-motor, 3) executive–caudal-motor, and 4) rostral-motor–caudal-motor. A threshold of 50 samples was applied to the projections and, subsequently, the overlapping areas were determined. The limbic–executive overlap occupies the ventral-medial area of the precommissural CD and the posterior as well as ventral postcommissural PU. The location of this overlap agrees with that of nonhuman primates as described by Haber and colleagues (2006). The executive–rostral-motor overlap is the most extensive and resides in the dorsal precommissural striatum and postcommissural PU. Even though, it is spatially consistent with the overlaps described in primates (Calzavara et al. 2007) in our study, which is in humans, appears to extend further. The executive–caudal-motor overlap is found only in the postcommissural striatum and specifically in the dorsal CD and dorsal as well as central lateral PU. Finally, the rostral-motor–caudal-motor overlap is found in the postcommissural lateral PU. To examine the sensitivity of these findings to the arbitrary choice of threshold, we applied increasing levels of threshold (1%, 5%, and 10%) to the tractography results for each striatal projection. Although the occupied volume of the overlapping areas changed substantially from the threshold of 1% to that of 10%, the aforementioned overlaps were preserved. This evidence and the fact that the existence and location of these overlaps have been confirmed by tracing studies supports their use to report dopamine release in the corresponding areas.
Release of Dopamine in the Striatal Subdivisions
Dopamine release in the structural and CB functional subdivisions post-d-amphetamine was inferred from the percentage change in [11C]PHNO and [11C]Raclopride BPND. The dopamine release and the %COV for the dopamine release, an index of homogeneity of dopamine release within a region, were measured for the connectivity-based (CB and CBo) and structure-based (SB and SBf) subdivisions (Table 2 and Fig. 4).
Table 2.
Quantification of dopamine release within the CB functional subdivisions of the striatum for [11C]PHNO and [11C]Raclopride ligands
| Ligand threshold | [11C]PHNO |
[11C]Raclopride |
||
|---|---|---|---|---|
| CBo | CB | CBo | CB | |
| Limbic | 21.03 ± 7.33 | 20.75 ± 5.94 | 13.50 ± 4.30 | 14.01 ± 5.40 |
| Executive | 13.89 ± 3.26 | 13.87 ± 3.71 | 5.45 ± 3.33 | 8.48 ± 3.43 |
| Rostral-motor | 14.43 ± 4.16 | 15.70 ± 2.25 | 7.48 ± 5.07 | 8.95 ± 4.49 |
| Caudal-motor | 16.44 ± 2.25 | 17.47 ± 2.34 | 8.50 ± 5.41 | 10.23 ± 3.84 |
| Parietal | 16.78 ± 4.39 | 18.11 ± 3.68 | 11.78 ± 4.67 | 11.28 ± 5.49 |
| Average %COV | 24.40 ± 7.78 | 20.69 ± 6.95 | 52.83 ± 15.98 | 43.07 ± 5.93 |
Note: Bottom row is the average %COV of dopamine release, averaged across functional subdivisions.
Figure 4.

Dopamine release measured as the percentage change of [11C]PHNO BPND (column A) and [11C]Raclopride BPND (column C) within the exclusive CB functional ROIs (CB, top row), the structural-derived functional ROIs (SBf, middle row), and the structural subdivisions of the striatum (SB, bottom row). Columns B and D correspond to the dopamine release %COV for each region for [11C]PHNO and [11C]Raclopride, respectively. Abbreviations correspond to: lim = limbic, exe = executive, rMt = rostral-motor, cMt = caudal-motor, par = parietal, sLim = structural-limbic, sExe = structural-executive, sSm = structural-sensorimotor, VST = ventral striatum, CD = caudate, PU = putamen.
For the CB methods, a consistent pattern of dopamine release was found for both the 2 ligands. Specifically, the highest dopamine release was measured in the limbic area followed by the parietal, the caudal-motor, and rostral-motor areas. The lowest dopamine release was measured in the executive region. For each CB subdivision and for each ligand, an analysis of variance (ANOVA) was performed to assess whether the means of dopamine release, estimated with each method (CB and CBo), were different. The results demonstrate that the difference in dopamine release across methods is not significant. The Shapiro–Wilk test (Shapiro and Wilk 1965) was applied to test the normality of the distributions.
In addition, an ANOVA was implemented to assess whether dopamine is differentially released in the striatal functional subdivisions. For [11C]PHNO data, dopamine was differentially released in the striatal functional subdivisions for both methods (P-values: CB = 0.002, CBo = 0.004). Multiple comparison tests with Bonferroni correction were performed to determine which pairs of functional areas exhibit significant difference in dopamine release. Both methods showed a significant difference between limbic–executive and between limbic–rostral-motor areas. For [11C]Raclopride, the ANOVA shows that dopamine is differentially released in the CBo subdivisions (P = 0.01), while the CB subdivisions approached significance (P = 0.09). For [11C]Raclopride, only the limbic–executive pair defined with the CBo exhibited a significant difference in dopamine release, whereas for the CB method differences between limbic–executive areas did not survive corrections for multiple comparisons.
In the SBf subdivisions, the highest dopamine release was in the limbic region (VST), ([11C]PHNO = 21.2 ± 6.93% and [11C]Raclopride = 14.1 ± 6.38%) followed by the sensorimotor (postcommissural PU; [11C]PHNO = 16.8 ± 4.17% and [11C]Raclopride = 13.1 ± 6.82%), and executive regions (CD and precommissural PU; [11C]PHNO = 13.4 ± 5.68% and [11C]Raclopride = 8.62 ± 5.09%). These results are in agreement with those obtained by Martinez and colleagues (2003) using [11C]Raclopride. In the SB subdivisions of the striatum, which has been the most commonly used method for the quantification of striatal dopamine release, the highest release was measured in the VST ([11C]PHNO = 21.2 ± 6.93% and [11C]Raclopride = 14.1 ± 6.38%), followed by PU ([11C]PHNO = 16.4 ± 4.42% and [11C]Raclopride = 11.7 ± 5.99%), and the lowest in the CD ([11C]PHNO = 14.3 ± 6.84% and [11C]Raclopride = 7.68 ± 4.68%). The data used here are the same data as in Shotbolt et al. (2012) who performed the analysis and quantification of dopamine release, in the SB subdivisions in the subject's native space. The quantification of dopamine release estimated with the 2 studies is comparable as no significant difference was detected. Quantification with [11C]PHNO indicates that dopamine is released differentially (ANOVA test) in the SB subdivisions (SBf, P = 0.009 and SB, P = 0.03), but no differential dopamine release was detected for [11C]Raclopride. For [11C]PHNO, the limbic–executive pair showed a significant difference for the SBf method, whereas for the SB method the VST–CD pair.
The %COV of dopamine release for each method and each subdivision was measured (Fig. 4B,D and Table 2) to assess the homogeneity of dopamine release. For the CB methods, the average %COV was 23.48% for [11C]PHNO and 48.11% for [11C]Raclopride. A higher average %COV was measured in the SBf in comparison with the CB subdivisions. In particular, the average %COV for [11C]PHNO was 33.3% and for [11C]Raclopride 52.2%. For the SB, the average %COV is 35.9% for [11C]PHNO and 52.5% for [11C]Raclopride. As we progress from the structural subdivisions to more sophisticated CB subdivisions, dopamine release becomes more homogenous (low %COV; Fig. 4). To assess these differences, the nonparametric Mann–Whitney test was implemented to compare the homogeneity of dopamine release in the CB (limbic, executive, rostral-motor, caudal-motor, and parietal) versus the SB ROIs [CD, PU, VST (limbic), CD/precommissural PU (executive), and postcommissural PU (sensorimotor)]. The results show that homogeneity of dopamine release was significantly higher in the CB ROIs for both ligands ([11C]PHNO, P = 0.05 and [11C]Raclopride, P = 0.03). However, our concern was that these significant differences might be driven by the fact that some of the CB ROIs are small in size, which might lead to lower %COVs. There was no correlation between the %COV and the size for each ROI (P = 0.3; Supplementary Fig. S7).
According to Haber et al. (2006), limbic–executive overlapping areas mediate incentive learning and these areas might be particularly sensitive to dopamine modulation. The release of dopamine within the overlapping ROIs was quantified with [11C]PHNO only, as it has been shown previously to provide a greater signal-to-noise ration than [11C]Raclopride in studies of acute fluctuations in synaptic dopamine in the human striatum (Shotbolt et al. 2012). The release of dopamine as measured by %BPND changes in the overlapping limbic–executive area was 18.2 ± 5.39% (limbic alone = 19.61 ± 6.78% and executive alone = 14.13 ± 4.12%, Supplementary Table 4, using the CBo method [1% threshold]). The results show that d-amphetamine does not provoke a higher dopamine release in the overlapping area. In other overlapping areas, dopamine release (as measured by %BPND change) was: executive–rostral-motor = 14.7 ± 4.15%; executive–caudal-motor = 16.2 ± 5.05%; and rostral-motor–caudal-motor = 16.0 ± 4.78%, which also reflect dopamine release similar to the independent areas they form part of Supplementary Table 4.
For comparison, dopamine release and its %COV were estimated within the CB functional ROIs at thresholds of 1% and 10%, and results are presented in Supplementary Material (Supplementary Table 4).
Discussions
CB Functional Subdivision of the Striatum
Our findings show bilaterally symmetric and topographically consistent projections of the cortical targets to the striatum, which are organized into discrete and overlapping networks. The spatial consistency of the CB subdivisions is reflected quantitatively and qualitatively by the DICE coefficients (Supplementary Material) and the consistency of the functional classifications across subjects, respectively (Fig. 2B).
As Parent and Hazrati (1995) report and shown in this study, virtually all cortical areas contribute, at varying degrees, to the cortical-striatal projections. Consequently, the projections from all cortical lobes to striatum were considered for a comprehensive examination of the functional organization of the striatum. The frontal lobe connections are dominant contributing 82 ± 7% of the total striatal volume and are the main source that influences the functional organization of the striatum. A detailed anatomical subdivision of the frontal lobe was performed, with each subdivision associated with a particular function, and the projections from each subdivision were estimated. As with nonhuman primate data (Haber et al. 2006), the ventral-medial prefrontal and orbital cortices connect to the anterior ventral CD and PU, the nucleus accumbens, and also the ventral postcommissural PU, which, in primates, also receives projecting fibers from the amygdala (Fudge et al. 2002). A discrepancy we observed between our results and the primate tracing studies is that the limbic projections do not extend to the medial wall of the precommissural CD (Haber et al. 2006). This might be due to the fact that this projection is very thin and with the current DWI resolution, it has not been possible to recover it. In addition, we explored the projections of the cingulate cortex (areas 32/24) to understand, if in humans this contributes to the medial limbic territory, but such connections were not detected. The limbic volume contributes to 20 ± 7% of the total striatal volume, which corresponds well with primate limbic volumetric estimates of 22% from tracing studies (Haber et al. 2006). Amygdala and hippocampus complex were excluded from the limbic target as their connectivity pattern was not consistent with previous human DWI studies (Cohen et al. 2009) and nonhuman primate tracing studies. As expected, projections from these structures were found in the VST area and the ventral postcommissural PU. However, in most of our subjects, strong connections were observed in the lateral anterior CD, next to the internal capsule, and also in the lateral PU parallel to the external capsule. Although termination and exclusion masks were used to investigate further these projections, the results were inconclusive and these structures were excluded from the limbic target.
The executive projections occupy a large portion of the striatum, and this finding contradicts the concept that striatum is primarily a motor functional region. Projections from this target were found in rostral striatum and extended postcommissurally (Figs 2 and 3). In our data, the probability of connections for tracts originating from the executive target showed a degree of variability in the anterior CD (Fig. 2). These results are in agreement with those of Lehéricy et al. (2004) who reported tracking variability across subjects in the anterior striatum. Rostral-motor projections occupy the dorsal tier of rostral striatum and extend to dorsal PU caudal to the anterior commissure. Our findings are consistent with those of nonhuman tracing studies (Haber 2003) and other DWI studies in humans (Draganski et al. 2008). The caudal-motor projections reside in the postcommissural striatum. These projections overlap with the rostral-motor projections caudal to the anterior commissure and extend further posteriorly. The pattern of cortical projections to the striatum supports the theory of elongated rostral-caudal domains (Selemon and Goldman-Rakic 1985).
For the rest of the brain, a coarse anatomical approach was followed, by estimating the projections from the entire lobe. Areas where parietal lobe projections dominate occupy 11 ± 5%, the second biggest cortical–striatal connections, and reside mainly in the posterior striatum. In 8 of 12 subjects, we observed small patches of parietal projections in the anterior striatum (Fig. 2B) mainly in the central CD, a finding that is consistent with primate studies (Cavada and Goldman-Rakic 1989). Parietal lobe is a functionally heterogeneous structure that consists of executive, visual, somatosensory (SS), and limbic subregions. At first, we considered parcellating the parietal lobe into anatomical subdivisions that would represent the 4 functions. Nevertheless, taking into consideration evidence from tracing studies that: 1) the visual cortex contributes the least from all the cortical regions (Kemp and Powell 1970; Parent and Hazrati 1995); and 2) the limbic areas of the parietal lobe are connected with visual and SS areas (Cavada and Goldman-Rakic 1989), we decided that it is preferable to subdivide the parietal lobe only into the SS and posterior parietal (PP) areas as described elsewhere (Behrens, Johansen-Berg, et al. 2003; Bohanna et al. 2011). However, the projections from these 2 areas, SS and PP, show an extensive overlap, an observation confirmed by Bohanna et al. (2011) and Cavada and Goldman-Rakic (1991) that did not justify the subdivision of the parietal into SS and PP. Therefore, considering a parietal lobe as one entity was the most reliable choice.
Temporal and occipital lobes have limited connections with the striatum. Temporal projections in nonhuman primates have been reported in the ventral-medial anterior CD (Selemon and Goldman-Rakic 1985) and the tail of the CD (Van Hoesen et al. 1981). However, we did not observe projections to the tail of the CD. This discrepancy might be due to the fact that the CD ROI did not include the whole tail of the structure as the small size of the tail did not allow reliable tracing for all slices. Our cortical–striatal projections are in agreement with those reported by Bohanna et al. (2011) with the exception that we did not observe any projections from the occipital lobe to the CD.
Accumulating evidence (Haber et al. 2006; Draganski et al. 2008) supports the concept of distinctive and overlapping networks in the striatum, which form the basis for reward-based learning and goal-directed behaviors. Our findings support the existence of overlapping projections throughout the human striatum, engaging striatum in integrating information between functions, via overlapping networks. Our results indicate that the executive area overlaps with all the other functional areas (limbic, rostral-motor, and caudal-motor). This suggests executive involvement in both motor and limbic functions; in other words, it points to a role for the striatum in orchestrating the top-down component of action planning and selection.
Release of Dopamine
d-amphetamine-induced reduction of the BPND has been well validated as a measure of change in synaptic endogenous dopamine (Laruelle 2000). To date, both agonist and antagonist ligands have been used to explore dopamine release in striatal subdivisions, which have been defined based on structural criteria (Martinez et al. 2003; Shotbolt et al. 2012). Here, the agonist ([11C]PHNO) and antagonist ([11C]Raclopride) ligands have been used to quantify dopamine release within the functional and structural subdivision of the striatum.
In the CB functional subdivisions of the striatum, the highest release of dopamine was measured in the limbic, followed by the parietal, motor, and executive functions. This pattern was repeated for both ligands and was consistent across the different approaches taken to define the functional subdivisions (CB and CBo). A statistical comparison for each functional area separately showed that the release of dopamine is not affected by the CB ROIs employed to measure it, which indicates that CB subdivision of the striatum is a robust method for the quantification of the PET signal (Supplementary Material). As mentioned, the cortical-striatal projections are organized into discrete and overlapping networks. The advantage of using methods that define the CB ROIs by applying a lower threshold to the connection maps (CBo) over the method that defines exclusive CB is that it includes voxels that are exclusively connected (discrete network) to a cortical target as well as voxels that concurrently connect to other targets (overlapping networks).
The differences observed between the [11C]Raclopride and [11C]PHNO ligands with regard to the pairs that exhibit significant difference is consistent with the lower sensitivity of [11C]Raclopride in detecting dopamine release (Narendran et al. 2004; Shotbolt et al. 2012) and the smaller sample size for [11C]Raclopride in this study (sample size: 9 subjects compared with 12 for [11C]PHNO).
The SBf method, like the CB method, assigns a sole function to every voxel. The SBf method has detected significant differences between the limbic and executive regions, whereas the significant differences between the limbic and sensorimotor areas found with the CB were not preserved. This indicates that the estimation of dopamine release across the CD/precommissural PU complex and across the postcommissural PU and assigning an executive and sensorimotor function, respectively, as proposed by Martinez et al. (2003), is not optimal. Nevertheless, the delineation of VST using the anatomical landmarks described in Tziortzi, Searle, Tzimopoulou, et al. (2011) and its assignment to the limbic function is a good approximation as the dopamine release was similar with that obtained using the limbic CB. In addition, the original guidelines that subdivide the striatum into ventral and dorsal (Drevets et al. 1999; Mawlawi et al. 2001) also safeguard the functional interpretation of the scientific findings.
The homogeneity of dopamine release was assessed by calculating the %COV for each subdivision. Our data demonstrate greater homogeneity of dopamine release in the CB functional ROIs when compared with the structural subdivisions, which suggest that CB functional ROIs may be a better representation of neurotransmission relevant subregions of the striatum. These data provide evidence that there is an association between local dopamine release and cortical connectivity profiles of these regions.
The biggest change in the PET signal in our study was seen in the limbic striatum followed by the sensorimotor and executive area. The magnitude of the PET signal change, following the administration of amphetamine, is dependent on the amount of dopamine release, as well as the relative proportions of the D2R-like receptors in each subdivision. Dopamine has a preferential affinity for the D3R, over the D2Rhigh followed by the D2Rlow, therefore, a given concentration of dopamine can be expected to occupy a greater proportion of D3R and D2Rhigh. D3R and D2Rhigh are known to be abundant in the VST area where the limbic cortex projects. This could potential explain the higher release of dopamine detected in the limbic region. Nevertheless, the second highest level of dopamine release was measured in the sensorimotor striatal areas, which are primarily located in the postcommissural PU where the D3R contribution to the total [11C]PHNO signal is negligible (Tziortzi, Searle, Tzimopoulou, et al. 2011). A similar argument could be made for the ratio of D2Rhigh:D2Rlow being higher in the sensorimotor than the executive striatum, leading to greater changes in the signal following similar amounts of dopamine release. In order to test this, we compared the ratio of [11C]PHNO/[11C]Raclopride BPND for the 2 regions (where D3 contribution in the 2 regions is negligible). We found no evidence for a difference in the [11C]PHNO/[11C]Raclopride ratio between the 2 regions, suggesting that differences in the relative regional proportions of D2R-like species are unlikely to be responsible for the regional pattern of BPND change seen in our data. Thus, the emerging hypothesis is that amphetamine leads to a preferential release of dopamine in the limbic, followed by the sensorimotor and executive areas.
Dopamine release is elicited in all functional sub-territories of the striatum, and this is consistent with the diversity of physiological effects provoked after the administration of d-amphetamine, which includes psychological and physical effects such as euphoria, psychomotor agitation, locomotor stimulation, hyperactivity, increased libido, and increased concentration. The universal striatal activation could be explained by the anatomical arrangement of the cortico-striatal and striato-nigro-striatal pathways. The cortico-striatal pathways are organized into individual and overlapping networks. In these overlapping areas, the distinct cortical loops converge and information is integrated and conveyed. The striato-nigro-striatal pathways form an ascending spiral by which information from a striatal region is transferred to other areas of the striatum. Specifically, Haber et al. (2000) postulate that there is an interface between different striatal regions via the midbrain dopamine cells, which create a hierarchy of information flow. Thus, the universal striatal activation could be due to a complex chain of events, beginning with motivation and progressing to cognitive and motor activations, as explained by the feed-forward organization of the striatal network.
The results show that d-amphetamine does not provoke a higher dopamine release in the overlapping areas. It is worth to note that d-amphetamine releases accumulated dopamine by reversing the dopamine transporter and is thus a good measure of overall dopamine system integrity. Physiological dopamine release is dependent on the firing rate of dopamine neurons, controlled at several levels by feedback loops. The assessment of physiological dopamine release in these overlapping striatal functional areas may be assessed via performance of tasks that require multifunction engagement.
Several studies support a functional and structural decline of the human brain with age. For instance, a recent study has demonstrated an age-related decline in white matter tract integrity (Voineskos et al. 2012), while a PET study with [11C]Raclopride has shown that there is an age-related loss of striatal D2R receptors (Rinne et al. 1993). The current study aimed to recruit a narrow age range in order to minimize age-related effects. If the decline of the dopamine receptors and/or of the white matter tracts within a subject and across regions was uniform then one would expect to affect to a similar degree the connectivity-derived regions and the respective quantification of dopamine release. Nevertheless, potential age-related effects warrant a further investigation. In this study, the prefrontal functional subdivisions were not derived from functional MRI experiments, but make use of the known areas of specific brain function, as determined from the human and primate literature. We are not aware of how the spatial anatomical arrangements of these cortical areas are affected in different neurological and psychiatric disorders. Therefore, if this methodology is to be applied to diseased cohorts, the anatomical–functional cortical alterations should be considered. One limitation of this study is that we did not apply any partial volume corrections (Le Pogam et al. 2011; Aston et al. 2002) or resolution recovery techniques (Shidahara et al. 2009, 2012).
In this study, the CB functional subdivisions were applied to PET data for the quantification of dopamine release. This methodology is not limited to the investigation of endogenous dopamine release and can be of value in other studies. The improved regional discrimination of this method can be of value in group comparisons, where the detection of specific functional differences is explored. The striatum of the human brain has highly differentiated neurochemical architecture (Holt et al. 1997). This method can be used to study the distribution of neurotransmitters in individual subjects, understand the neurochemical organization or differentiation, and explore the complex interactions among neurochemical systems. Such capability may help the development of novel therapeutic compounds and enhance the evaluation of novel radiopharmaceuticals. This methodology may also provide a valuable tool for deep brain stimulation surgery planning and improve the treatment of a variety of disorders such as pain, motor, obsessive–compulsive disorders, depression, and addiction.
In conclusion, our results demonstrate that DWI data can help identify functional subdivisions of the human striatum, and this is a robust method for the quantification of dopamine release. The functional organization is consistent among subjects, and the human functional organization has a pattern with distinctive and overlapping networks as that obtained in primates. The use of CB functional subdivisions improves the evaluation of regional differences in dopamine. In particular, the homogeneity of dopamine release was significantly higher within the CB functional subdivisions in comparison with the structural subdivisions. The results support an association between local levels of dopamine release and cortical connectivity fingerprints. d-amphetamine induced the highest dopamine release in the limbic followed by the sensory, motor, and executive areas. Our data suggest that the relative regional proportions of D2-like receptors are unlikely to be responsible for this regional dopamine release pattern. It is envisaged that the proposed multimodal imaging approach will prove valuable in exploring striatal neurotransmission in healthy humans and patients with psychosis, addiction, and motor impairments and will help the development of novel therapeutic drugs.
Distribution of the CB Functional Striatal Atlas
The probabilistic atlas of the functional organization of the striatum developed using this methodology is available with the FSL software (http://fsl.fmrib.ox.ac.uk/fsl/fslwiki/Atlases/striatumconn). Two versions of the atlas exist. The first version comprises of 3 subdivisions (limbic, executive, and sensorimotor), whereas the second comprises of 7 subdivisions (limbic, executive, rostral-motor, caudal-motor, parietal, occipital, and temporal). Available are also the probabilistic maps of each cortical–striatal projections, which allow voxels that are connected to more than one cortical targets to be included (overlapping networks).
Supplementary Material
Supplementary material can be found at: http://www.cercor.oxfordjournals.org/.
Funding
A.C.T. work was jointly supported by GlaxoSmithKline (GSK) and the Biotechnology and Biological Sciences Research Council (BBSRC BB/G53035X/1). Additional support was received by National Institutes of Health (MH045573 and MH086400).
Supplementary Material
Notes
The authors thank Prof. Marc Laruelle, Dr Anderson Winkler, Dr Stamatios Sotiropoulos, Dr Ricarda Menke, Dr Anca Popescu, Dr Jesper Andersson, Prof. Paul M. Matthews, Dr Qi Guo, Dr Yoko Tanimura, and Dr Julia Lehman for useful discussions. Dr Richard Hargreaves (Merck R&D) for the useful discussion and provision of preclinical data on [11C]PHNO. Conflict of Interest: G.E.S., E.A.R., and R.N.G. are employed by Imanova Ltd., Burlington Danes Building, Hammersmith Hospital, Du Cane Road, London W12 0NN, UK.
References
- Andersson JL, Skare S, Ashburner J. How to correct susceptibility distortions in spin-echo echo-planar images: application to diffusion tensor imaging. Neuroimage. 2003;20:870–888. doi: 10.1016/S1053-8119(03)00336-7. doi:10.1016/S1053-8119(03)00336-7. [DOI] [PubMed] [Google Scholar]
- Aston JA, Cunningham VJ, Asselin MC, Hammers A, Evans AC, Gunn RN. Positron emission tomography partial volume correction: estimation and algorithms. J Cereb Blood Flow Metab. 2002;22:1019–1034. doi: 10.1097/00004647-200208000-00014. doi:10.1097/00004647-200208000-00014. [DOI] [PubMed] [Google Scholar]
- Banerjee A, Prante O. Subtype-selective dopamine receptor radioligands for PET imaging: current status and recent developments. Curr Med Chem. 2012;19:3957–3966. doi: 10.2174/092986712802002518. doi:10.2174/092986712802002518. [DOI] [PubMed] [Google Scholar]
- Behrens TE, Johansen-Berg H, Woolrich MW, Smith SM, Wheeler-Kingshott CA, Boulby PA, Barker GJ, Sillery EL, Sheehan K, Ciccarelli O, et al. Non-invasive mapping of connections between human thalamus and cortex using diffusion imaging. Nat Neurosci. 2003;6:750–757. doi: 10.1038/nn1075. doi:10.1038/nn1075. [DOI] [PubMed] [Google Scholar]
- Behrens TEJ, Berg HJ, Jbabdi S, Rushworth MFS, Woolrich MW. Probabilistic diffusion tractography with multiple fibre orientations: what can we gain? Neuroimage. 2007;34:144–155. doi: 10.1016/j.neuroimage.2006.09.018. doi:10.1016/j.neuroimage.2006.09.018. [DOI] [PMC free article] [PubMed] [Google Scholar]
- Behrens TEJ, Woolrich MW, Jenkinson M, Johansen-Berg H, Nunes RG, Clare S, Matthews PM, Brady JM, Smith SM. Characterization and propagation of uncertainty in diffusion-weighted MR imaging. Magn Reson Med. 2003;50:1077–1088. doi: 10.1002/mrm.10609. doi:10.1002/mrm.10609. [DOI] [PubMed] [Google Scholar]
- Bohanna I, Georgiou-Karistianis N, Egan GF. Connectivity-based segmentation of the striatum in Huntington's disease: vulnerability of motor pathways. Neurobiol Dis. 2011;42:475–481. doi: 10.1016/j.nbd.2011.02.010. doi:10.1016/j.nbd.2011.02.010. [DOI] [PubMed] [Google Scholar]
- Boileau I, Guttman M, Rusjan P, Adams JR, Houle S, Tong J, Hornykiewicz O, Furukawa Y, Wilson AA, Kapur S. Decreased binding of the D3 dopamine receptor-preferring ligand [11C]-(+)-PHNO in drug-naive Parkinson’s disease. Brain. 2009;132:1336–1375. doi: 10.1093/brain/awn337. doi:10.1016/j.nbd.2011.02.010. [DOI] [PubMed] [Google Scholar]
- Boileau I, Payer D, Houle S, Behzadi A, Rusjan PM, Tong J, Wilkins D, Selby P, George TP, Zack M, et al. Higher binding of the dopamine D3 receptor-preferring ligand [11C]-(+)-propyl-hexahydro-naphtho-oxazin in methamphetamine polydrug users: a positron emission tomography study. J Neurosci. 2012;32:1353–1359. doi: 10.1523/JNEUROSCI.4371-11.2012. doi:10.1523/JNEUROSCI.4371-11.2012. [DOI] [PMC free article] [PubMed] [Google Scholar]
- Calzavara R, Mailly P, Haber SN. Relationship between the corticostriatal terminals from areas 9 and 46, and those from area 8A, dorsal and rostral premotor cortex and area 24c: an anatomical substrate for cognition to action. Eur J Neurosci. 2007;26:2005–2024. doi: 10.1111/j.1460-9568.2007.05825.x. doi:10.1111/j.1460-9568.2007.05825.x. [DOI] [PMC free article] [PubMed] [Google Scholar]
- Cavada C, Goldman-Rakic PS. Posterior parietal cortex in rhesus monkey: II. Evidence for segregated corticocortical networks linking sensory and limbic areas with the frontal lobe. J Comp Neurol. 1989;287:422–445. doi: 10.1002/cne.902870403. doi:10.1002/cne.902870403. [DOI] [PubMed] [Google Scholar]
- Cavada C, Goldman-Rakic PS. Topographic segregation of corticostriatal projections from posterior parietal subdivisions in the macaque monkey. Neuroscience. 1991;42:683–696. doi: 10.1016/0306-4522(91)90037-o. doi:10.1016/0306-4522(91)90037-O. [DOI] [PubMed] [Google Scholar]
- Chang H, Fitzpatrick JM. A technique for accurate magnetic resonance imaging in the presence of field inhomogeneities. IEEE Trans Med Imaging. 1992;11:319–329. doi: 10.1109/42.158935. doi:10.1109/42.158935. [DOI] [PubMed] [Google Scholar]
- Chiavaras MM, Petrides M. Orbitofrontal sulci of the human and macaque monkey brain. J Comp Neurol. 2000;422:35–54. doi:10.1002/(SICI)1096-9861(20000619)422:1<35::AID-CNE3>3.0.CO;2-E. [PubMed] [Google Scholar]
- Cohen MX, Schoene-Bake JC, Elger CE, Weber B. Connectivity-based segregation of the human striatum predicts personality characteristics. Nat Neurosci. 2009;12:32–34. doi: 10.1038/nn.2228. doi:10.1038/nn.2228. [DOI] [PubMed] [Google Scholar]
- Croxson PL, Johansen-Berg H, Behrens TE, Robson MD, Pinsk MA, Gross CG, Richter W, Richter MC, Kastner S, Rushworth MF. Quantitative investigation of connections of the prefrontal cortex in the human and macaque using probabilistic diffusion tractography. J Neurosci. 2005;25:8854–8866. doi: 10.1523/JNEUROSCI.1311-05.2005. doi:10.1523/JNEUROSCI.1311-05.2005. [DOI] [PMC free article] [PubMed] [Google Scholar]
- Draganski B, Kherif F, Klöppel S, Cook PA, Alexander DC, Parker GJM, Deichmann R, Ashburner J, Frackowiak RSJ. Evidence for segregated and integrative connectivity patterns in the human basal ganglia. J Neurosci. 2008;28:7143–7152. doi: 10.1523/JNEUROSCI.1486-08.2008. doi:10.1523/JNEUROSCI.1486-08.2008. [DOI] [PMC free article] [PubMed] [Google Scholar]
- Drevets WC, Price JC, Kupfer DJ, Kinahan PE, Lopresti B, Holt D, Mathis C. PET measures of amphetamine-induced dopamine release in ventral versus dorsal striatum. Neuropsychopharmacology. 1999;21:694–709. doi: 10.1016/S0893-133X(99)00079-2. doi:10.1016/S0893-133X(99)00079-2. [DOI] [PubMed] [Google Scholar]
- Egerton A, Mehta MA, Montgomery AJ, Lappin JM, Howes OD, Reeves SJ, Cunningham VJ, Grasby PM. The dopaminergic basis of human behaviors: a review of molecular imaging studies. Neurosci Biobehav Rev. 2009;33:1109–1132. doi: 10.1016/j.neubiorev.2009.05.005. doi:10.1016/j.neubiorev.2009.05.005. [DOI] [PMC free article] [PubMed] [Google Scholar]
- Fudge JL, Kunishio K, Walsh P, Richard C, Haber SN. Amygdaloid projections to ventromedial striatal subterritories in the primate. Neuroscience. 2002;110:257–275. doi: 10.1016/s0306-4522(01)00546-2. doi:10.1016/S0306-4522(01)00546-2. [DOI] [PubMed] [Google Scholar]
- Gallezot JD, Beaver JD, Gunn RN, Nabulsi N, Weinzimmer D, Singhal T, Slifstein M, Fowles K, Ding YS, Huang Y, et al. Affinity and selectivity of [(1)(1)C]-(+)-PHNO for the D3 and D2 receptors in the rhesus monkey brain in vivo. Synapse. 2012;66:489–500. doi: 10.1002/syn.21535. doi:10.1002/syn.21535. [DOI] [PubMed] [Google Scholar]
- Gunn RN, Lammertsma AA, Hume SP, Cunningham VJ. Parametric imaging of ligand-receptor binding in PET using a simplified reference region model. Neuroimage. 1997;6:279–2787. doi: 10.1006/nimg.1997.0303. doi:10.1006/nimg.1997.0303. [DOI] [PubMed] [Google Scholar]
- Gurevich EV, Joyce JN. Distribution of dopamine D3 receptor expressing neurons in the human forebrain comparison with D2 receptor expressing neurons. Neuropsychopharmacology. 1999;20:60–80. doi: 10.1016/S0893-133X(98)00066-9. doi:10.1016/S0893-133X(98)00066-9. [DOI] [PubMed] [Google Scholar]
- Haber SN. The primate basal ganglia: parallel and integrative networks. J Chem Neuroanat. 2003;26:317–330. doi: 10.1016/j.jchemneu.2003.10.003. doi:10.1016/j.jchemneu.2003.10.003. [DOI] [PubMed] [Google Scholar]
- Haber SN, Fudge JL, McFarland NR. Striatonigrostriatal pathways in primates form an ascending spiral from the shell to the dorsolateral striatum. J Neurosci. 2000;20:2369–2382. doi: 10.1523/JNEUROSCI.20-06-02369.2000. [DOI] [PMC free article] [PubMed] [Google Scholar]
- Haber SN, Kim KS, Mailly P, Calzavara R. Reward-related cortical inputs define a large striatal region in primates that interface with associative cortical connections, providing a substrate for incentive-based learning. J Neurosci. 2006;26:8368–8376. doi: 10.1523/JNEUROSCI.0271-06.2006. doi:10.1523/JNEUROSCI.0271-06.2006. [DOI] [PMC free article] [PubMed] [Google Scholar]
- Holt DJ, Graybiel AM, Saper CB. Neurochemical architecture of the human striatum. J Comp Neurol. 1997;384:1–25. doi: 10.1002/(sici)1096-9861(19970721)384:1<1::aid-cne1>3.0.co;2-5. doi:10.1002/(SICI)1096-9861(19970721)384:1<1::AID-CNE1>3.0.CO;2-5. [DOI] [PubMed] [Google Scholar]
- Jenkinson M, Bannister P, Brady M, Smith S. Improved optimization for the robust and accurate linear registration and motion correction of brain images. Neuroimage. 2002;17:825–841. doi: 10.1016/s1053-8119(02)91132-8. doi:10.1006/nimg.2002.1132. [DOI] [PubMed] [Google Scholar]
- Johansen-Berg H, Behrens TE, Sillery E, Ciccarelli O, Thompson AJ, Smith SM, Matthews PM. Functional-anatomical validation and individual variation of diffusion tractography-based segmentation of the human thalamus. Cereb Cortex. 2005;15:31–39. doi: 10.1093/cercor/bhh105. doi:10.1093/cercor/bhh105. [DOI] [PubMed] [Google Scholar]
- Kegeles LS, Abi-Dargham A, Frankle WG, Gil R, Cooper TB, Slifstein M, Hwang DR, Huang Y, Haber SN, Laruelle M. Increased synaptic dopamine function in associative regions of the striatum in schizophrenia. Arch Gen Psychiatry. 2010;67:231–239. doi: 10.1001/archgenpsychiatry.2010.10. doi:10.1001/archgenpsychiatry.2010.10. [DOI] [PubMed] [Google Scholar]
- Kemp JM, Powell TP. The cortico-striate projection in the monkey. Brain. 1970;93:525–546. doi: 10.1093/brain/93.3.525. doi:10.1093/brain/93.3.525. [DOI] [PubMed] [Google Scholar]
- Kringelbach ML, Rolls ET. The functional neuroanatomy of the human orbitofrontal cortex: evidence from neuroimaging and neuropsychology. Progr Neurobiol. 2004;72:341–372. doi: 10.1016/j.pneurobio.2004.03.006. doi:10.1016/j.pneurobio.2004.03.006. [DOI] [PubMed] [Google Scholar]
- Lammertsma AA, Hume SP. Simplified reference tissue model for PET receptor studies. Neuroimage. 1996;4:153–158. doi: 10.1006/nimg.1996.0066. doi:10.1006/nimg.1996.0066. [DOI] [PubMed] [Google Scholar]
- Laruelle M. Imaging synaptic neurotransmission with in vivo binding competition techniques: a critical review. J Cereb Blood Flow Metab. 2000;20:423–451. doi: 10.1097/00004647-200003000-00001. doi:10.1097/00004647-200003000-00001. [DOI] [PubMed] [Google Scholar]
- Laruelle M. Measuring dopamine synaptic transmission with molecular imaging and pharmacological challenges: the state of the art molecular imaging in the clinical neurosciences. In: Gründer G, editor. Humana Press; 2012. pp. 163–203. [Google Scholar]
- Leh SE, Ptito A, Chakravarty MM, Strafella AP. Fronto-striatal connections in the human brain: a probabilistic diffusion tractography study. Neurosci Lett. 2007;419:113–118. doi: 10.1016/j.neulet.2007.04.049. doi:10.1016/j.neulet.2007.04.049. [DOI] [PMC free article] [PubMed] [Google Scholar]
- Lehéricy S, Ducros M, Van De Moortele P-F, Francois C, Thivard L, Poupon C, Swindale N, Ugurbil K, Kim D-S. Diffusion tensor fiber tracking shows distinct corticostriatal circuits in humans. Ann Neurol. 2004;55:522–529. doi: 10.1002/ana.20030. doi:10.1002/ana.20030. [DOI] [PubMed] [Google Scholar]
- Le Pogam A, Hatt M, Patrice D, Boussion N, Tsoumpas C, Turkheimer FE, Prunier-Aesch C, Baulieu J-L, Guilloteau D, Visvikis D. Evaluation of a 3D local multiresolution algorithm for the correction of partial volume effects in positron emission tomography. Med Phys. 2011;38:4920–4933. doi: 10.1118/1.3608907. doi:10.1002/ana.20030. [DOI] [PMC free article] [PubMed] [Google Scholar]
- Martinez D, Slifstein M, Broft A, Mawlawi O, Hwang D-R, Huang Y, Cooper T, Kegeles L, Zarahn E, Abi-Dargham A, et al. Imaging human mesolimbic dopamine transmission with positron emission tomography. part II: amphetamine-induced dopamine release in the functional subdivisions of the striatum. J Cereb Blood Flow Metab. 2003;23:285–300. doi: 10.1097/01.WCB.0000048520.34839.1A. doi:10.1097/00004647-200303000-00004. [DOI] [PubMed] [Google Scholar]
- Mawlawi O, Martinez D, Slifstein M, Broft A, Chatterjee R, Hwang D-R, Huang Y, Simpson N, Ngo K, Van Heertum R, et al. Imaging human mesolimbic dopamine transmission with positron emission tomography: I. Accuracy and precision of D2 receptor parameter measurements in ventral striatum. J Cereb Blood Flow Metab. 2001;21:1034–1057. doi: 10.1097/00004647-200109000-00002. doi:10.1097/00004647-200109000-00002. [DOI] [PubMed] [Google Scholar]
- Mizrahi R, Addington J, Rusjan PM, Suridjan I, Ng A, Boileau I, Pruessner JC, Remington G, Houle S, Wilson AA. Increased stress-induced dopamine release in psychosis. Biol Psychiatry. 2012;71:561–567. doi: 10.1016/j.biopsych.2011.10.009. doi:10.1016/j.biopsych.2011.10.009. [DOI] [PubMed] [Google Scholar]
- Mizrahi R, Agid O, Borlido C, Suridjan I, Rusjan P, Houle S, Remington G, Wilson AA, Kapur S. Effects of antipsychotics on D3 receptors: a clinical PET study in first episode antipsychotic naive patients with schizophrenia using [11C]-(+)-PHNO. Schizophr Res. 2011;131:63–68. doi: 10.1016/j.schres.2011.05.005. doi:10.1016/j.schres.2011.05.005. [DOI] [PubMed] [Google Scholar]
- Narendran R, Hwang DR, Slifstein M, Talbot PS, Erritzoe D, Huang Y, Cooper TB, Martinez D, Kegeles LS, Abi-Dargham A, et al. In vivo vulnerability to competition by endogenous dopamine: comparison of the D2 receptor agonist radiotracer (−)-N-[11C]propyl-norapomorphine ([11C]NPA) with the D2 receptor antagonist radiotracer [11C]-raclopride. Synapse. 2004;52:188–208. doi: 10.1002/syn.20013. doi:10.1002/syn.20013. [DOI] [PubMed] [Google Scholar]
- Parent A, Hazrati L-N. Functional anatomy of the basal ganglia. I. The cortico-basal ganglia-thalamo-cortical loop. Brain Res Rev. 1995;20:91–127. doi: 10.1016/0165-0173(94)00007-c. doi:10.1016/0165-0173(94)00007-C. [DOI] [PubMed] [Google Scholar]
- Petrides M. Lateral prefrontal cortex: architectonic and functional organization. Philos Trans Roy Soc B Biol Sci. 2005;360:781–795. doi: 10.1098/rstb.2005.1631. doi:10.1098/rstb.2005.1631. [DOI] [PMC free article] [PubMed] [Google Scholar]
- Rinne JO, Hietala J, Ruotsalainen U, Sako E, Laihinen A, Nagren K, Lehikoinen P, Oikonen V, Syvalahti E. Decrease in human striatal dopamine D2 receptor density with age: a PET study with [11C]raclopride. J Cereb Blood Flow Metab. 1993;13:310–314. doi: 10.1038/jcbfm.1993.39. doi:10.1038/jcbfm.1993.39. [DOI] [PubMed] [Google Scholar]
- Searle G, Beaver JD, Comley RA, Bani M, Tziortzi A, Slifstein M, Mugnaini M, Griffante C, Wilson AA, Merlo-Pich E. Imaging dopamine D3 receptors in the human brain with positron emission tomography, [11C]PHNO, and a selective D3 receptor antagonist. Biol Psychiatry. 2010;68:392–399. doi: 10.1016/j.biopsych.2010.04.038. [DOI] [PubMed] [Google Scholar]
- Selemon LD, Goldman-Rakic PS. Longitudinal topography and interdigitation of corticostriatal projections in the rhesus monkey. J Neurosci. 1985;5:776–794. doi: 10.1523/JNEUROSCI.05-03-00776.1985. [DOI] [PMC free article] [PubMed] [Google Scholar]
- Shapiro S, Wilk M. An analysis of variance test for normality (complete samples) Biometrika. 1965;52:591–611. [Google Scholar]
- Shidahara M, Tsoumpas C, Hammers A, Boussion N, Visvikis D, Suhara T, Kanno I, Turkheimer FE. Functional and structural synergy for resolution recovery and partial volume correction in brain PET. Neuroimage. 2009;44:340–348. doi: 10.1016/j.neuroimage.2008.09.012. doi:10.1016/j.neuroimage.2008.09.012. [DOI] [PubMed] [Google Scholar]
- Shidahara M, Tsoumpas C, McGinnity CJ, Kato T, Tamura H, Hammers A, Watabe H, Turkheimer FE. Wavelet-based resolution recovery using an anatomical prior provides quantitative recovery for human population phantom PET [(1)(1)C]raclopride data. Phys Med Biol. 2012;57:3107–3122. doi: 10.1088/0031-9155/57/10/3107. doi:10.1088/0031-9155/57/10/3107. [DOI] [PubMed] [Google Scholar]
- Shotbolt P, Tziortzi AC, Searle GE, Colasanti A, van der Aart J, Abanades S, Plisson C, Miller SR, Huiban M, Beaver JD, et al. Within-subject comparison of [(11)C]-(+)-PHNO and [(11)C]raclopride sensitivity to acute amphetamine challenge in healthy humans. J Cereb Blood Flow Metab. 2012;32:127–136. doi: 10.1038/jcbfm.2011.115. doi:10.1038/jcbfm.2011.115. [DOI] [PMC free article] [PubMed] [Google Scholar]
- Staley JK, Mash DC. Adaptive increase in D3 dopamine receptors in the brain reward circuits of human cocaine fatalities. J Neurosci. 1996;16:6100–6106. doi: 10.1523/JNEUROSCI.16-19-06100.1996. [DOI] [PMC free article] [PubMed] [Google Scholar]
- Suridjan I, Rusjan P, Addington J, Wilson AA, Houle S, Mizrahi R. Dopamine D2 and D3 binding in people at clinical high risk for schizophrenia, antipsychotic-naive patients and healthy controls while performing a cognitive task. J Psychiatry Neurosci. 2012;37:110181. doi: 10.1503/jpn.110181. [DOI] [PMC free article] [PubMed] [Google Scholar]
- Tziortzi AC, Searle G, Tsoumpas C, Long C, Shotbolt P, Rabiner E, Jenkinson M, Gunn R. MR-DTI and PET multimodal imaging of dopamine release within subdivisions of basal ganglia. J Phys Conf Ser. 2011;317 012005. http://iopscience.iop.org/1742-6596/317/1/012005 . [Google Scholar]
- Tziortzi AC, Searle GE, Tzimopoulou S, Salinas C, Beaver JD, Jenkinson M, Laruelle M, Rabiner EA, Gunn RN. Imaging dopamine receptors in humans with [11C]-(+)-PHNO: dissection of D3 signal and anatomy. Neuroimage. 2011;54:264–277. doi: 10.1016/j.neuroimage.2010.06.044. doi:10.1016/j.neuroimage.2010.06.044. [DOI] [PubMed] [Google Scholar]
- Van Hoesen GW, Yeterian EH, Lavizzo-Mourey R. Widespread corticostriate projections from temporal cortex of the rhesus monkey. J Comp Neurol. 1981;199:205–219. doi: 10.1002/cne.901990205. doi:10.1002/cne.901990205. [DOI] [PubMed] [Google Scholar]
- Voineskos AN, Rajji TK, Lobaugh NJ, Miranda D, Shenton ME, Kennedy JL, Pollock BG, Mulsant BH. Age-related decline in white matter tract integrity and cognitive performance: a DTI tractography and structural equation modeling study. Neurobiol Aging. 2012;33:21–34. doi: 10.1016/j.neurobiolaging.2010.02.009. doi:10.1016/j.neurobiolaging.2010.02.009. [DOI] [PMC free article] [PubMed] [Google Scholar]
- Wallis JD. Orbitofrontal cortex and its contribution to decision-making. Ann Rev Neurosci. 2007;30:31–56. doi: 10.1146/annurev.neuro.30.051606.094334. doi:10.1146/annurev.neuro.30.051606.094334. [DOI] [PubMed] [Google Scholar]
Associated Data
This section collects any data citations, data availability statements, or supplementary materials included in this article.