

Abstract
OBJECTIVE
To describe the epidemiology of ventilator-associated pneumonia (VAP) in community hospitals.
DESIGN AND SETTING
Prospective study in 31 community hospitals from 2007 to 2011.
METHODS
VAP surveillance was performed by infection preventionists using the National Healthcare Safety Network protocol. VAP incidence was reported as number of events per 1,000 ventilator-days. We categorized hospitals into small (<30,000 patient-days/year), medium (30,000–60,000 patient-days/year), and large (>60,000 patient-days/year) groups and compared VAP incidence by hospital size.
RESULTS
The median VAP incidence was 1.4 (interquartile range, 0.4–2.4), and ventilator utilization ratio (VUR) was 0.33 (0.25–0.47). VAP incidence was higher in small hospitals (2.1) than medium (0.85) or large (0.69) hospitals (P = .03) despite a lower VUR in small hospitals (0.29 vs 0.31 vs 0.44, respectively; P = .01). The median age of 247 VAP cases was 64 (53–73); 136 (55.1%) were female; 142 (57.5%) were Caucasian; 170 (68.8%) were admitted from home. The length of stay and duration of ventilation were 26 (14–42) and 12 (4–21) days, respectively. The pre- and postinfection hospital stays were 8 (3–13) days and 14 (8–30) days, respectively. Data on outcomes were available in 214 cases (86.6%), and 75 (35.0%) cases died during hospitalization. The top 3 pathogens were methicillin-resistant Staphylococcus aureus (MRSA; n = 70, 27.9%), Pseudomonas species (n = 40, 16.3%), and Klebsiella species (n = 34, 13.3%).
CONCLUSIONS
VAP incidence was inversely associated with size of hospital. VAP in community hospitals was frequently caused by MRSA. Importantly, predictors of VAP incidence in tertiary care hospitals such as VUR may not be predictive in community hospitals with few ventilated patients.
Prevention of healthcare-associated infections (HAIs) is a vital component of improving patient safety. Ventilator-associated pneumonia (VAP) is the most frequent intensive care unit (ICU)–acquired infection. VAP affects 4.8%–7.5% of patients intubated for longer than 24 hours1 and is associated with significant morbidity and mortality.2–7
Monitoring the incidence of VAP and the pathogens responsible for VAP is an essential component of infection prevention and control activities. The VAP rate reported by the Centers for Disease Control and Prevention (CDC) has been decreasing. Between 2002 and 2009, the mean VAP rate among medical ICUs reporting to CDC dropped from 4.9 to 1.4 events per 1,000 ventilator-days and from 9.3 to 3.8 per 1,000 ventilator-days in surgical ICUs.8,9 In contrast, little data are currently available describing VAP specifically in community hospitals. To our knowledge, only one study has examined the epidemiology and outcome of VAP in community hospitals.7 We performed this study to determine the epidemiology and characteristics of patients with VAP hospitalized in our network of nonteaching community hospitals.
METHODS
Design and Setting
We performed a prospective observational cohort study of all VAP cases among patients admitted to 31 community hospitals between July 1, 2007, and June 30, 2011. These hospitals were located throughout Virginia, North Carolina, South Carolina, and Georgia and participated in the Duke Infection Control Outreach Network (DICON) as described in detail elsewhere.10 Participating hospitals had a total of 9,237 licensed beds (median of 284 beds; interquartile range [IQR], 154–400). Complete consecutive surveillance data were collected in all hospitals from 2007 to 2011. At all DICON-affiliated hospitals, active infection control and surveillance programs collected data on HAI rates. Trained infection preventionists (IPs) identified cases of VAP using standard definitions and protocols from the National Healthcare Safety Network (NHSN).11 For the detection of VAP, we used a uniform approach in all study hospitals, including steps for data validation such as regular audit by DICON liaison IPs. Furthermore, DICON physician and liaison IPs provided educational programs and assisted in data acquisition, validation, and input. Liaisons IPs also helped to train newly hired local IPs. The acquisition sources of respiratory specimens, however, were not available on our data registry.
VAP incidence was reported as number of events per 1,000 ventilator-days in the ICU. The ventilator utilization ratio (VUR) was calculated by dividing the total number of ventilator-days by the total number of ICU patient-days. We categorized the size of hospitals into 3 categories based on tertiles of patient days as follows: small (<30,000 patient-days/ year), medium (30,000–60,000 patient-days/year), and large (>60,000 patient-days/year). We then compared VAP incidence among these groups. Similarly, we separated the 4-year study period into four 12-month periods and examined whether rates of VAP changed over time.
The following information was collected for all patients with VAP using standard case report forms: demographic data, admission category (medical, surgical, or others), source of admission, and results of cultures of respiratory samples. We also recorded the following outcomes: in-hospital death, postdischarge destination or location, duration of mechanical ventilation, length of stay in the hospital, interval between date of admission and onset of VAP, and duration of ventilation after diagnosis of VAP.
Statistical Analysis
All statistical analyses were performed using SPSS (ver 20.0). Patients’ demographics and clinical characteristics were described as medians and IQR for continuous data or proportion for categorical data. The χ2 or Fisher exact tests were used for categorical variables between the study groups, as appropriate. The Student t test or 1-way ANOVA was used to test significant differences of continuous variables between the study groups, as appropriate. Univariate ANOVA was used to determine trends in the rates of VAP and VUR through study periods. A 2-tailed P value of .05 or less was considered significant.
RESULTS
A total of 247 VAP cases were observed in 31 study hospitals, totaling 192,143 ventilator-days, 504,900 ICU patient-days, and 6,763,829 patient-days during the study period. The median incidence of VAP was 1.4/1,000 ventilator-days (0.4–2.4), and median VUR was 0.33 (0.25–0.47). The median number of patients with VAP per hospital per year was 1 (0.25–2.8).
VAP incidence was inversely related with the hospital size, while the VUR correlated with the hospital size (Table 1; Figure 1). The median incidence of VAP was higher in small community hospitals (2.1, 1.2–5.1) than medium (0.85, 0.35–2.4) or large (0.69, 0.13–2.2) community hospitals (P = .031) despite a lower VUR (0.29 in small hospitals vs 0.31 in medium and 0.44 in large; P = .013). The duration of ventilation post-VAP was significantly longer in small community hospitals (11.5, 3.25–36.5) than medium (7.0, 2–12) or large (9, 3–20) hospitals (P = .02). Mortality following VAP diagnosis was not statistically different among small, medium, and large hospitals (29.1% vs 38.3% vs 36.6%, respectively; P = .55).
TABLE 1.
Summary Information for 31 Community Hospitals and Comparison of Ventilator-Associated Pneumonia by Hospital Size
| Characteristic | Small group (N = 10) | Medium group (N = 11) | Large group (N = 10) | P value |
|---|---|---|---|---|
| Total patient-days | 695,495 | 1,889,011 | 4,179,323 | .000 |
| Total ventilator-days | 18,939 | 53,511 | 119,693 | .000 |
| Total ICU patient-days | 66,682 | 153,744 | 284,474 | .001 |
| ICU patient-days/total patient-days, % | 9.6 | 8.1 | 6.8 | .789 |
| Total no. of VAP | 62 | 71 | 114 | |
| VAP per hospital | 2 (1–6) | 4 (1–11) | 6 (1.5–18) | .449 |
| Incidence of VAP | 2.1 (1.2–5.1) | 0.85 (0.35–2.4) | 0.69 (0.13–2.2) | .031 |
| VUR | 0.29 (0.22–0.37) | 0.31 (0.25–0.43) | 0.44 (0.32–0.66) | .013 |
| Post-VAP ventilation days | 11.5 (3.25–36.5) | 7.0 (2–12) | 9.0 (3–20) | .019 |
| Mortality rate, % | 29.1 | 38.3 | 36.6 | .550 |
NOTE. Hospitals were classified as small group, <30,000 patient-days/year; medium group, 30,000–60,000 patient-days/year; and large group, >60,000 patient-days/year. Data are median (interquartile range), unless otherwise indicated. ICU, intensive care unit; VAP, ventilator-associated pneumonia; VUR, ventilator utilization ratio.
FIGURE 1.
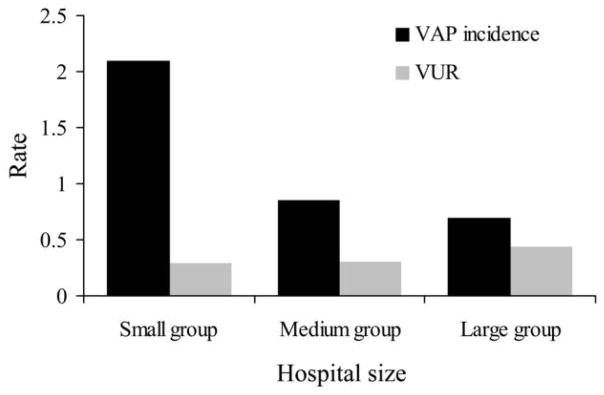
Comparison of median ventilator-associated pneumonia incidence (VAP/1,000 ventilator-days) and ventilator utilization ratio (VUR) by hospital size (small group, <30,000 patient-days/year; medium group, 30,000–60,000 patient-days/year; large group, >60,000 patient-days/year).
There was no significant difference in the annual incidence of VAP during the study period (P = .462). VUR decreased from 0.63 during the first year of the study period to 0.34 in the last year of the study period, but this trend was not statistically significant (P = .246). An examination of the incidence of VAP by month of onset showed no clear seasonal patterns in VAP incidence or VUR (data not shown).
The median age of 247 patients with VAP was 64 (53–73); 136 (55.1%) were female; 142 (57.5%) were Caucasian; 170 (68.8%) were admitted from home, while 74 (30.0%) were transferred from other acute or chronic care facilities (Table 2). The median length of stay and duration of ventilation were 26 (14–42) and 12 (4–21) days, respectively. The median preinfection hospital stay was 8 (3–13) days, and the median postinfection hospital stay was 14 (8–30) days. Data on outcomes were available in 214 of 247 cases (86.6%); 75 of 214 cases (35.0%) died during hospitalization. Patients’ demographic or clinical characteristics, such as age, race, dialysis, admission site or service, and type of pathogens, were not significantly different between survivors and nonsurvivors (Table 2).
TABLE 2.
Patients’ Characteristics by Survival after Ventilator-Associated Pneumonia
| Characteristic | Total (N = 247) | Survivor (N = 139) | Nonsurvivor (N = 75) | P value |
|---|---|---|---|---|
| Age, years, median (IQR) | 64 (53–73) | 63 (53–72) | 65 (54–76) | .619 |
| Gender | .684 | |||
| Male | 111 (44.9) | 59 (42.4) | 34 (45.3) | |
| Female | 136 (55.1) | 80 (57.6) | 41 (54.7) | |
| Race | .799 | |||
| Caucasian | 142 (57.5) | 78 (56.1) | 43 (57.3) | |
| African American | 70 (28.3) | 44 (31.7) | 21 (28.0) | |
| Other | 35 (14.2) | 17 (12.2) | 11 (14.7) | |
| Status of dialysis | 24 (9.7) | 14 (10.1) | 8 (10.7) | .586 |
| Admission site | .781 | |||
| Home | 170 (68.8) | 100 (71.9) | 51 (68.0) | |
| Acute/chronic care facilities | 74 (30.0) | 38 (27.3) | 23 (30.7) | |
| Admission service | .728 | |||
| Medicine | 173 (70.0) | 95 (68.3) | 56 (74.7) | |
| Surgery | 44 (17.8) | 28 (20.1) | 12 (16.0) | |
| Other | 24 (9.7) | 15 (10.8) | 6 (8.0) | |
| Length of stay, median (IQR) | 26 (14–42) | 29 (16–42) | 23 (13–36.5) | .463 |
| Preinfection stay, days, median (IQR) | 8 (3–13) | 7 (3–13) | 9 (5–13) | .968 |
| Postinfection stay, days, median (IQR) | 14 (8–30) | 17 (8–32) | 11 (6–20.5) | .118 |
| Duration of MV, days, median (IQR) | 12 (4–21) | 11.5 (3.75–21) | 13 (7–20.5) | .960 |
| Identified pathogen | ||||
| MRSA | 70 (28.3) | 40 (28.8) | 21 (28.0) | .904 |
| MDROs | 77 (31.2) | 42 (30.2) | 24 (32.0) | .787 |
NOTE. Data are no. (%), unless otherwise indicated. IQR, interquartile range; MDROs, multidrug-resistant organisms; MRSA, methicillin-resistant Staphylococcus aureus; MV, mechanical ventilation.
A total of 286 pathogens were identified in respiratory cultures taken from 219 cases of VAP (Table 3). The top 3 pathogens were methicillin-resistant Staphylococcus aureus (MRSA; 70, 24.5%), Pseudomonas species (40, 14.0%), and Klebsiella species (34, 11.9%). Five isolates of Klebsiella pneumoniae and 1 isolate of Escherichia coli produced extended-spectrum beta-lactamases; these 6 isolates represented 8.7% of all isolates of Enterobacteriaceae associated with cases of VAP. No pathogen was identified in respiratory cultures from 28 patients (11.3%).
TABLE 3.
Identified Pathogens Associated with Ventilator-Associated Pneumonia
| Pathogen | No. of identified pathogens (N = 286) |
|---|---|
| Methicillin-resistant Staphylococcus aureus | 70 (24.5) |
| Pseudomonas species | 40 (14.0) |
| Klebsiella species | 34 (11.9) |
| Candida species | 18 (6.3) |
| Enterobacter species | 16 (5.6) |
| Methicillin-susceptible S. aureus | 15 (5.2) |
| Sternotrophomonas maltophila | 12 (4.2) |
| Escherichiae coli | 11 (3.8) |
| Acinetobacter species | 8 (2.8) |
| Hemophilus influenzae | 5 (1.7) |
| Serratia species | 5 (1.7) |
| Enterococcus species | 3 (1.0) |
| Citrobacter freundii | 2 (0.7) |
| Streptococcus pneumoniae | 2 (0.7) |
| Group B Streptococcus | 1 (0.3) |
| Proteus species | 1 (0.3) |
| Other | 14 (4.9) |
DISCUSSION
Our prospective multicenter study is one of the first to provide a detailed description of VAP in community hospitals. Our study demonstrated that VAP is an uncommon infection among patients receiving ventilation in nonteaching community hospitals. While the median incidence of VAP was 1.4/1,000 ventilator-days, most hospitals experienced an average of only 1 VAP per year. Thus, the total number of cases of VAP in our cohort was small despite 4 years of data from 31 hospitals. The low incidence of VAP in community hospitals was similar to the results of VAP rates in other studies including community hospitals.12,13
Whether VAP is 100% preventable is controversial. Some hospitals have reported VAP rates at or close to 0 using prevention bundles.12,13 Other experts have argued that VAP cannot be eliminated because they have had persistent VAP cases despite aggressive use of prevention bundles.14 Blot et al15 argue that it is unrealistic to suggest that VAP can be eliminated in the most complex ventilated populations. Importantly, most studies that report achieving sustained elimination of VAP report data from small-sized community hospitals. In contrast, our study of nonteaching community hospitals failed to show the complete elimination of VAP.
Interestingly, small community hospitals had the highest rate of VAP despite having the lowest VUR. The relationship between poor outcomes and inexperience with procedures in community hospitals has been previously demonstrated. For example, Anderson et al16 analyzed 132,111 surgical procedures and demonstrated that small community hospitals have higher rates of surgical site infection than medium or large community hospitals, based on surgical volume. Similarly, hospitals with lower patient volume have worse outcomes among ventilated patients. Kahn et al17 evaluated more than 20,000 patients in the Acute Physiology and Chronic Health Evaluation network and concluded that patients on a ventilator in low-volume hospitals (≤150 patients receiving mechanical ventilation per year) had higher mortality than patients in high-volume hospitals. Thus, relative unfamiliarity with the use of the ventilator and relative inexperience with protocols for VAP prevention because of few ventilated patients may have contributed to the higher rate of VAP in these hospitals. For example, the 10 small hospitals had a total of 18,939 ventilator-days combined, translating to just over a single ventilator-day per calendar day for each small hospital during the study period. In contrast, the 10 large hospitals had more than 8 ventilator-days each per calendar day during the study period. Other factors may have contributed as well, including a lower number of skilled healthcare workers (eg, respiratory therapists). We believe this finding and these speculative hypotheses require further investigation.
The rate of VAP in this study was lower than the rate of VAP previously published for DICON community hospitals (2.5/1,000 patient-days)10 but was higher than the incidence of VAP reported in 2009 by the NHSN for medical/surgical nonteaching hospitals (1.1–1.2).9 In the NHSN data, the rates of VAP and VUR were lower in nonteaching hospitals with fewer than 15 ICU beds than the rates in major teaching hospitals. In our study the median rates of VAP (1.4) and VUR (0.33) were higher than those of nonteaching hospitals that had fewer than 15 ICU beds (1.2 and 0.27, respectively). The majority of units in our study had fewer than 15 ICU beds, and, as noted above, rates varied on the basis of the size of the hospital. On average, less than 1 VAP occurred at each hospital per year. In fact, a single VAP increased the rate of VAP above the mean rates published by NHSN for many hospitals. Thus, we believe that further stratification of ICU types among nonteaching hospitals is needed in order for NHSN to be a more meaningful benchmark for community hospitals.
The median duration of ventilation was 12 (4–21) days in our study, 2-fold longer than the adjusted mean duration of mechanical ventilation (6.1 days; range, 3.0–11.2) for all ventilated patients in a recent study using the Institute for Health Metrics network (which includes community hospitals).18 The incidence of VAP increases with the duration of mechanical ventilation. For example, the estimated rate of VAP in one recent study was 3% per day for the first 5 days, 2% per day for days 6–10, and 1% per day after day 10.19 Unfortunately, we were not able to examine the relationship between VAP incidence and duration of ventilation in this study. Overall mortality in our cohort was similar to previously published data from teaching hospitals.5,6,20–22
The types of organisms causing VAP in our patient population were different than the types of organisms causing VAP in studies of VAP in tertiary care facilities. Recent reports suggested that multidrug-resistant Acinetobacter or Pseudomonas pneumonia is increasing in major teaching hospitals worldwide; our study did not have the same observation.6,22,23 Although Pseudomonas species (14.0%) and Klebsiella species (11.9%) led to a substantial proportion of VAPs, the most common pathogen of VAP in our study was MRSA (24.5%).
This study has limitations. The main limitations of our study were the lack of independent validation of the diagnoses of VAP made by local IPs on a case-by-case basis and the lack of a gold standard for making the diagnosis of VAP. Variations in VAP incidence can occur from factors such as differences in criteria utilized for diagnosing VAP, interob-server variability in VAP reporting, and other factors with VAP reporting.24,25 We tried to overcome some of these potential biases by employing the same methods and protocols for identifying VAP in all study hospitals, including steps for data validation such as regular random audits by liaison IPs. Second, some of our outcomes data were missing. Third, the source of respiratory specimen was not available in our database. Though all IPs used uniform methods, it is conceivable that some of the cultures were reflective of colonization. Finally, outcomes from our cohort represent overall mortality among patients diagnosed with VAP, not attributable morality. Despite the above-noted limitations, our study has several strengths, including standardized surveillance methods, prospective data collection, a large number of hospitals, and a unique hospital setting (small community hospitals).
In summary, the incidence of VAP was inversely associated with size of hospital in our cohort. As such, predictors of VAP incidence in tertiary care hospitals such as VUR may not be as predictive of potential adverse outcomes in non-teaching community hospitals. This finding suggests that additional VAP prevention strategies may be required in small community hospitals where patients are ventilated infrequently. Finally, surveillance for VAP is changing. Our findings will need to be reevaluated after full implementation of the new ventilator-associated events definition currently proposed by the CDC.26
Acknowledgments
We acknowledge the many infection preventionists at DICON-affiliated hospitals for their tireless efforts to improve care at their institutions.
Financial support. M.S.L. received research scholar grant support from the Kyung Hee University in 2011. D.J.A. received grant support from the National Institutes of Health/National Institute of Allergy and Infectious Diseases (K23AIO95357), Agency for Healthcare Research and Quality, and Centers for Disease Control and Prevention.
Footnotes
Potential conflicts of interest. All authors report no conflicts of interest relevant to this article. All authors submitted the ICMJE Form for Disclosure of Potential Conflicts of Interest, and the conflicts that the editors consider relevant to this article are disclosed here.
References
- 1.Kollef MH, Afessa B, Anzueto A, et al. Silver-coated endotracheal tubes and incidence of ventilator-associated pneumonia: the NASCENT randomized trial. JAMA. 2008;300:805–813. doi: 10.1001/jama.300.7.805. [DOI] [PubMed] [Google Scholar]
- 2.Bercault N, Boulain T. Mortality rate attributable to ventilator-associated nosocomial pneumonia in an adult intensive care unit: a prospective case control study. Crit Care Med. 2001;29:2303–2309. doi: 10.1097/00003246-200112000-00012. [DOI] [PubMed] [Google Scholar]
- 3.Hortal J, Giannella M, Pérez MJ, et al. Incidence and risk factors for ventilator-associated pneumonia after major heart surgery. Intensive Care Med. 2009;35:1518–1525. doi: 10.1007/s00134-009-1523-3. [DOI] [PubMed] [Google Scholar]
- 4.Magret M, Amaya-Villar R, Garnacho J, et al. Ventilator-associated pneumonia in trauma patients is associated with lower mortality: results from EU-VAP study. J Trauma. 2010;69:849–854. doi: 10.1097/TA.0b013e3181e4d7be. [DOI] [PubMed] [Google Scholar]
- 5.Vanhems P, Bénet T, Voirin N, et al. Early-onset ventilator-associated pneumonia incidence in intensive care units: a surveillance-based study. BMC Infect Dis. 2011;6;11:236. doi: 10.1186/1471-2334-11-236. [DOI] [PMC free article] [PubMed] [Google Scholar]
- 6.Chung DR, Song JH, Kim SH, et al. High prevalence of multidrug-resistant nonfermenters in hospital-acquired pneumonia in Asia. Am J Respir Crit Care Med. 2011;184:1409–1417. doi: 10.1164/rccm.201102-0349OC. [DOI] [PubMed] [Google Scholar]
- 7.Ibrahim EH, Tracy L, Hill C, Fraser VJ, Kollef MH. The occurrence of ventilator-associated pneumonia in a community hospital: risk factors and clinical outcomes. Chest. 2001;120:555–561. doi: 10.1378/chest.120.2.555. [DOI] [PubMed] [Google Scholar]
- 8.Centers for Disease Control and Prevention. National Nosocomial Infections Surveillance (NNIS) System Report, data summary from January 1992 through June 2004, issued October 2004. Am J Infect Control. 2004;32:470–485. doi: 10.1016/S0196655304005425. [DOI] [PubMed] [Google Scholar]
- 9.Dudeck MA, Horan TC, Peterson KD, et al. National Healthcare Safety Network (NHSN) report, data summary for 2009, device-associated module. Am J Infect Control. 2011;39:349–367. doi: 10.1016/j.ajic.2011.04.011. [DOI] [PubMed] [Google Scholar]
- 10.Anderson DJ, Miller BA, Chen LF, et al. The network approach for prevention of healthcare-associated infections: long-term effect of participation in the Duke Infection Control Outreach Network. Infect Control Hosp Epidemiol. 2011;32:315–322. doi: 10.1086/658940. [DOI] [PubMed] [Google Scholar]
- 11.Horan TC, Andrus M, Dudeck MA. CDC/NHSN surveillance definition of health care–associated infection and criteria for specific types of infections in the acute care setting. Am J Infect Control. 2008;36:309–332. doi: 10.1016/j.ajic.2008.03.002. [DOI] [PubMed] [Google Scholar]
- 12.Sundar KM, Nielsen D, Sperry P. Comparison of ventilator-associated pneumonia (VAP) rates between different ICUs: implications of a zero VAP rate. J Crit Care. 2012;27:26–32. doi: 10.1016/j.jcrc.2011.05.019. [DOI] [PubMed] [Google Scholar]
- 13.DePalo VA, McNicoll L, Cornell M, Rocha JM, Adams L, Pronovost PJ. The Rhode Island ICU collaborative: a model for reducing central line-associated bloodstream infection and ventilator-associated pneumonia statewide. Qual Saf Health Care. 2010;19:555–561. doi: 10.1136/qshc.2009.038265. [DOI] [PubMed] [Google Scholar]
- 14.Bouadma L, Deslandes E, Lolom I, et al. Long-term impact of a multifaceted prevention program on ventilator-associated pneumonia in a medical intensive care unit. Clin Infect Dis. 2010;51:1115–1122. doi: 10.1086/656737. [DOI] [PubMed] [Google Scholar]
- 15.Blot S, Lisboa T, Angles R, Rello J. Prevention of VAP: is zero rate possible? Clin Chest Med. 2011;32:591–599. doi: 10.1016/j.ccm.2011.05.008. [DOI] [PubMed] [Google Scholar]
- 16.Anderson DJ, Hartwig MG, Pappas T, et al. Surgical volume and the risk of surgical site infection in community hospitals: size matters. Ann Surg. 2008;247:343–349. doi: 10.1097/SLA.0b013e31815aab38. [DOI] [PubMed] [Google Scholar]
- 17.Kahn JM, Goss CH, Heagerty PJ, Kramer AA, O’Brien CR, Rubenfeld GD. Hospital volume and the outcomes of mechanical ventilation. N Engl J Med. 2006;355:41–50. doi: 10.1056/NEJMsa053993. [DOI] [PubMed] [Google Scholar]
- 18.Klompas M, Kleinman KP, Karcz A. Variability in mean duration of mechanical ventilation among community hospitals. Infect Control Hosp Epidemiol. 2012;33:635–637. doi: 10.1086/665714. [DOI] [PubMed] [Google Scholar]
- 19.Cook DJ, Walter SD, Cook RJ, et al. Incidence of and risk factors for ventilator-associated pneumonia in critically ill patients. Ann Intern Med. 1998;129:433–440. doi: 10.7326/0003-4819-129-6-199809150-00002. [DOI] [PubMed] [Google Scholar]
- 20.Ranes JL, Gordon SM, Chen P, et al. Predictors of long-term mortality in patients with ventilator-associated pneumonia. Am J Med. 2006;119:e13–e19. doi: 10.1016/j.amjmed.2005.12.034. [DOI] [PubMed] [Google Scholar]
- 21.Tejerina E, Frutos-Vivar F, Restrepo MI, et al. Incidence, risk factors, and outcome of ventilator-associated pneumonia. J Crit Care. 2006;21:56–65. doi: 10.1016/j.jcrc.2005.08.005. [DOI] [PubMed] [Google Scholar]
- 22.Kollef MH, Shorr A, Tabak YP, Gupta V, Liu LZ, Johannes RS. Epidemiology and outcomes of health-care-associated pneumonia: results from a large US database of culture-positive pneumonia. Chest. 2005;128:3854–3862. doi: 10.1378/chest.128.6.3854. [DOI] [PubMed] [Google Scholar]
- 23.Rosenthal VD, Maki DG, Jamulitrat S, Medeiros EA, Todi SK, Gomez DY. International Nosocomial Infection Control Consortium (INICC) report, data summary for 2003–2008, issued June 2009. Am J Infect Control. 2010;38:95–104. doi: 10.1016/j.ajic.2009.12.004. [DOI] [PubMed] [Google Scholar]
- 24.Klompas M, Platt R. Ventilator-associated pneumonia: the wrong quality measure for benchmarking. Ann Intern Med. 2007;147:803–805. doi: 10.7326/0003-4819-147-11-200712040-00013. [DOI] [PubMed] [Google Scholar]
- 25.Klompas M. Interobserver variability in ventilator-associated pneumonia surveillance. Am J Infect Control. 2010;38:237–239. doi: 10.1016/j.ajic.2009.10.003. [DOI] [PubMed] [Google Scholar]
- 26.Improving surveillance for ventilator-associated events in adults. [Accessed July 10, 2012];Center for Disease Control and Prevention (CDC) website. http://www.cdc.gov/nhsn/PDFs/vae/CDC_VAE_CommunicationsSummary-forcompliance_20120313.pdf.