

Abstract
Rationale: Children are an at-risk population for developing complications following influenza infection, but immunologic correlates of disease severity are not understood. We hypothesized that innate cellular immune responses at the site of infection would correlate with disease outcome.
Objectives: To test the immunologic basis of severe illness during natural influenza virus infection of children and adults at the site of infection.
Methods: An observational cohort study with longitudinal sampling of peripheral and mucosal sites in 84 naturally influenza-infected individuals, including infants. Cellular responses, viral loads, and cytokines were quantified from nasal lavages and blood, and correlated to clinical severity.
Measurements and Main Results: We show for the first time that although viral loads in children and adults were similar, innate responses in the airways were stronger in children and varied considerably between plasma and site of infection. Adjusting for age and viral load, an innate immune profile characterized by increased nasal lavage monocyte chemotactic protein-3, IFN-α2, and plasma IL-10 levels at enrollment predicted progression to severe disease. Increased plasma IL-10, monocyte chemotactic protein-3, and IL-6 levels predicted hospitalization. This inflammatory cytokine production correlated significantly with monocyte localization from the blood to the site of infection, with conventional monocytes positively correlating with inflammation. Increased frequencies of CD14lo monocytes were in the airways of participants with lower inflammatory cytokine levels.
Conclusions: An innate profile was identified that correlated with disease progression independent of viral dynamics and age. The airways and blood displayed dramatically different immune profiles emphasizing the importance of cellular migration and localized immune phenotypes.
Keywords: natural influenza virus infection, human, cytokine, innate immune response, monocyte
At a Glance Commentary
Scientific Knowledge on the Subject
The nature and severity of symptoms presented during influenza virus infection are thought to be influenced by the ability to control viral load, preexisting immunity, and the degree of inflammation generated by the immune response. However, it is not understood why infection of healthy individuals can result in severe disease or poor clinical outcomes, such as bronchiolitis, pneumonia, or acute respiratory distress syndrome.
What This Study Adds to the Field
Our study indicates that younger individuals produce a more proinflammatory respiratory environment after infection, but that general inflammation is not predictive of a poor outcome. A specific immune profile can predict disease severity, and defining the characteristics of protective versus pathologic immune responses at presentation may provide new clinical treatment modalities for improving outcomes, especially in the young.
Natural influenza infection in humans can result in asymptomatic to serious illness characterized by sudden onset of fever and respiratory symptoms. The nature and severity of symptoms presented are thought to be influenced by the ability to control viral load, preexisting immunity, and the degree of inflammation generated by the host response. It is not understood why infection of previously healthy individuals can result in poor clinical outcomes, such as bronchiolitis, pneumonia, or acute respiratory distress syndrome, and particularly during pandemic years, there is a disproportionate rate of hospitalization and death compared with nonpandemic years, supporting the argument for protective contributions of preexisting immunity. Although much has been learned from human challenge studies, relatively few reports examine natural influenza infection in humans, particularly in the traditionally vulnerable pediatric and elderly populations, and rarely at the site of infection (1–7).
From extensive animal studies, it is apparent that local airway immune responses are critical determinants of infection kinetics and disease progression, although immune factors in human infection are less well understood. The adaptive immune response has been the most studied because of its ability to limit viral replication and facilitate viral clearance, particularly the role of humoral responses in neutralizing virus. Possibly because of restricted access to the site of infection, innate responses are less well characterized. There are conflicting reports regarding the role of inflammatory mediators during influenza infection, and no one set of cytokines has been identified as the primary correlate of symptom type or severity. Human innate cellular responses are also poorly characterized, particularly at the site of infection. Animal studies suggest that a dysregulated innate response, both in quality and magnitude, may lead to immunopathogenesis and therefore more severe disease (reviewed in Reference 8).
To understand the interplay between host and viral factors during natural influenza infection in humans, we designed a longitudinal observational study, sampling blood and nasal lavages from infected individuals. Many studies to date have identified associations between viral load or individual immune parameters and clinical outcome (4, 7, 9–16). However, statistical corrections are rarely made to adjust for viral load. In our study, children were found to mount significantly more aggressive, broad-spectrum inflammatory responses at the site of infection, independent of viral load. Controlling for this age effect and viral load, we identified an innate immune profile that correlated well with disease progression independent of viral dynamics. Importantly, the site of infection and blood displayed dramatically different immune profiles emphasizing the importance of directed cellular migration and localized immune phenotypes.
Methods
Study Participants and Design
Inclusion criteria required that participants meet the clinical case definition of influenza virus infection at the time of enrollment, or were asymptomatic household contacts of a participant with confirmed influenza infection. This study was conducted in compliance with 45 CFR46 and the Declaration of Helsinki. Institutional Review Boards of St. Jude Children’s Research Hospital and the University of Tennessee Health Science Center/Le Bonheur Children’s Hospital approved the study. Index cases were asked to provide nasal swabs, nasal lavages, and blood on the day of enrollment (Day 0) and Days 3, 7, 10, and 28, whereas household contacts were asked to provide nasal swabs on Day 0, 3, 7, and 14 and blood and nasal lavages on Days 0 and 28 (Figure 1a). Participants were asked to rank their symptom severity daily according to a visual analog scale. Additional detail is provided in the online supplement.
Figure 1.

(a) Study design. Index cases were asked to provide nasopharyngeal swabs, nasal lavages, and peripheral blood on the day of enrollment (Day 0), and on or about Days 3, 7, 10, and 28, whereas household contacts were asked to provide nasopharyngeal swabs on Day 0, and on or about Days 3, 7, and 14, and peripheral blood and nasal lavages on Day 0 and on or about Day 28. If at any point the household contact became influenza positive by RT-PCR, they were reenrolled as an influenza-positive participant, with Day 0 becoming the day of PCR positivity. Mean symptom scores were determined from daily visual analog symptom score cards reported by influenza-infected participants, according to virus strain or subtype. The symptom scores were determined by adding the total individual scores for each symptom set for each participant per day reported for (b) total symptoms, (c) URT symptoms, (d) LRT symptoms, (e) systemic symptoms, and (f) GI symptoms as defined in the Methods. Only participants who were influenza-positive at the time of enrollment are shown. GI = gastrointestinal; LRT = lower respiratory tract; RT-PCR = reverse-transcriptase polymerase chain reaction; URT = upper respiratory tract.
Quantitative Reverse-Transcriptase Polymerase Chain Reaction
Molecular viral loads were determined from nasal swabs according to the protocol developed by the World Health Organization Collaborating Centre for Influenza at the Centers for Disease Control and Prevention (Atlanta, GA). Additional detail is provided in the online supplement.
Detection of Cytokines
The Luminexx MAP system was used with a MILLIPLEX MAP human cytokine immunoassay (Millipore, St. Charles, MO) for detection of cytokines from samples according to the manufacturer’s protocol.
Flow Cytometry
Approximately 1 × 10⁵ peripheral blood mononuclear cells or nasal lavage cells were stained with a panel of monoclonal antibodies including CD14 (clone M5E2; BD Biosciences, San Jose, CA), HLA-DR (clone LN3; eBioscience, San Diego, CA), and CD16 (clone CB16; eBioscience), and analyzed on a BD FACSCalibur flow cytometer. Additional analysis was performed using FlowJo (TreeStar, Ashland, OR). Single stain and fluorescence-minus-one controls were performed.
Microneutralization Assay
Plasma was tested for antibodies against recently circulating influenza strains by microneutralization assay. Additional detail is provided in the online supplement.
Statistical Analysis
A predefined statistical analysis plan was used to analyze cytokine measurements and their relation to clinical outcomes including hospitalization and clinical scores. Full details regarding statistical analysis are provided in the online supplement.
Results
Participant Selection and Characteristics
A total of 73 individuals exhibiting influenza-like illness and 126 household contacts were enrolled during the 2009–2010 (aged 3.6 wk to 71 yr) and 2010–2011 (aged 10.5 wk to 56 yr) influenza seasons (Table1). Additionally, individuals were classified as having increased risk for influenza-associated complications by the Advisory Committee on Immunization Practices (ACIP) (17). Of the 84 influenza virus–positive participants, 24 suffered from ACIP-defined high-risk conditions at enrollment, including 17 individuals with underlying asthma or reactive airway disease (Table2). Our cohort contained 19 individuals who were hospitalized (median duration, 3 d; range, 1–26 d), with four requiring intensive care (median duration, 6 d; range, 2–6 d).
Table 1:
Participant Demographics
| Characteristic | Total Enrolled | A/H1N1 (2009) | A/H3N2 | B | Total Influenza Positive* |
|---|---|---|---|---|---|
| Index cases† | 73 | 30 | 14 | 12 | 56 |
| Household contacts | 126 | ||||
| Contacts of influenza-positive index cases | 105 | 13 | 10 | 5 | 28 |
| Initially infected‡ | 15 | 7 | 5 | 3 | |
| Subsequently infected§ | 13 | 6 | 5 | 2 | |
| Negative | 77 | ||||
| Total | 199 | 43 | 24 | 17 | 84 |
| Sex | |||||
| Male | 79 | 21 | 14 | 7 | 42 |
| Female | 120 | 22 | 10 | 10 | 42 |
| Age group | |||||
| <6 mo | 16 | 8 | 1 | 1 | 10 |
| 6–23 mo | 25 | 8 | 4 | 3 | 15 |
| 24–59 mo | 18 | 5 | 6 | 2 | 13 |
| 5–8 yr | 14 | 3 | 2 | 5 | 10 |
| 9–12 yr | 12 | 3 | 4 | 7 | |
| 13–17 yr | 14 | 3 | 2 | 2 | 7 |
| 18+ yr | 100 | 13 | 5 | 4 | 22 |
| Race/ethnicity | |||||
| Black, non-Hispanic | 153 | 27 | 22 | 14 | 63 |
| White, non-Hispanic | 42 | 15 | 2 | 3 | 20 |
| Asian | 1 | ||||
| Other | 3 | 1 | 1 | ||
| Influenza vaccination status | |||||
| Ineligible for vaccine (<6 mo) | 10 | ||||
| Eligible for vaccine | 74 | ||||
| Received 2006–2007 vaccine | 13 | 7 | |||
| Received 2007–2008 vaccine | 17 | 8 | |||
| Received 2008–2009 vaccine | 35 | 10 | 3 | 2 | 15 |
| Received 2009–2010 vaccine | 21 | 8 | 3 | 11 | |
| Received 2010–2011 vaccine | 22 | 5 | 5 | 10 | |
| Breastfeeding | |||||
| Yes | 5 | ||||
| No | 15 |
Median (range) age, 18 yr (3.6 wk to 71 yr).
Influenza virus molecular viral loads were determined from nasal swabs using quantitative reverse-transcription real-time polymerase chain reaction (qRT-PCR) as described in the Methods.
Index cases are defined as individuals displaying symptoms of influenza-like illness within 96 hours of enrollment. Nasal swabs from these individuals were subsequently tested for presence of influenza virus, and if no virus was detectable, the participant was removed from the study.
Initially infected household contacts refer to those participants enrolled as contacts who tested influenza positive by RT-PCR on Day 0 (day of enrollment) of the study.
Subsequently infected household contacts refer to those participants initially enrolled as contacts who later tested influenza positive by RT-PCR after Day 0 (day of enrollment) of the study.
Table 2:
Participant Clinical Information
| Value | |
|---|---|
| ACIP-defined high-risk condition* | |
| Yes | 24 |
| No | 59 |
| Unknown | 1 |
| Type of ACIP-defined high-risk condition* | |
| Immunosuppressive condition | 2 |
| Cardiac disease | 1 |
| Pulmonary disease | |
| Asthma or reactive airway disease | 17 |
| Hematologic disorder | 2 |
| Renal insufficiency | 3 |
| Neurologic disorder | 1 |
| Duration of viral shedding, d | |
| ≥1 high-risk condition*, median (range) | 3 (1–8) |
| No high-risk condition*, median (range) | 3 (1–29)† |
| Complications during acute illness | |
| Yes | 22 |
| No | 57 |
| Unknown | 5 |
| Complications‡ | |
| Hospitalized | 19 |
| No. d hospitalized, median (range) | 3 (1–26) |
| Intensive care required | 4 |
| No. d in intensive care, median (range) | 6 (2–6) |
| Mechanical ventilation required | 4 |
| Respiratory failure | 1 |
| Pneumonia | 3 |
| Shock or sepsis | 2 |
| Acute respiratory distress syndrome | 1 |
| Febrile acute respiratory disease | 4 |
| Bronchiolitis | 3 |
| Secondary bacterial infection | 3 |
| Seizures | 1 |
| Day care attendance | 21 |
| Premature birth§ | 6 |
| Gestational age at birth, wk, median (range) | 33 (28–36) |
| Received antibiotic therapy | 16 |
| Received antiviral therapy | 33 |
| Received oseltamivir | 32 |
Definition of abbreviation: ACIP = Advisory Committee on Immunization Practices.
Data are given as n values unless otherwise indicated.
Persons with ACIP-defined high-risk conditions include adults and children who have chronic pulmonary (including asthma) or cardiovascular (except isolated hypertension), renal, hepatic, neurologic, hematologic, or metabolic disorders (including diabetes mellitus); persons who have immunosuppression (including immunosuppression caused by medications or by HIV); and women who were pregnant during the influenza season.
One participant was still shedding virus at study completion, and if excluded, the median (range) duration of viral shedding becomes 3 days (1–11).
Any participant experiencing one or more complications during their acute illness.
Preterm birth is the birth of an infant before 37 weeks of pregnancy.
Clinical Severity Is Associated with Age but Not Viral Dynamics
Hospitalization and symptom scores were used as endpoints to evaluate clinical outcome. Individually measured symptoms were grouped and classified as upper or lower respiratory tract (URT or LRT), systemic, or gastrointestinal as described in the Methods. Approximately half of participants reported URT (56%), LRT (56%), or systemic (50%) illness. A smaller, but significant, proportion of participants reported gastrointestinal symptoms (38%). A(H1N1)pdm09-infected individuals reported significantly more severe respiratory symptoms (Figures 1b–1d) compared with those infected by A(H3N2) or influenza B (P < 0.05), whereas influenza B–infected participants reported more severe systemic and gastrointestinal symptoms (Figures 1b, 1e, and 1f) (P < 0.05).
Index cases and initially infected contacts shed peak viral loads at the time of enrollment (i.e., Day 0) (Figure 2a). Areas under the curve were determined for all symptom scores (total symptoms, URT, LRT, gastrointestinal, and systemic) and correlated with their associated viral loads, both peak and areas under the curve. There were no significant correlations between viral load and symptom scores at enrollment or areas under the curve, regardless of the infecting virus strain (see Figure E1 and Table E1 in the online supplement), indicating that in this cohort, viral load is not associated with disease severity as measured by reported symptom scores. No differences in peak viral load or viral load areas under the curve were apparent between participants who required hospitalization and those remaining in out-patient care, or in peak viral load between individuals who did or did not receive oseltamivir (data not shown). We also considered whether baseline participant or preexisting factors were predictive of clinical outcome. Participants with underlying ACIP-defined high-risk conditions (Table 2), including asthma, showed no differences in terms of the duration or peak of viral shedding, in symptom severity, or between self-reported participants with asthma and those without respiratory disease (data not shown). Finally, viral load alone was not correlated with strain (Figure 2b) or any other demographic category, including sex and age, with the exception that influenza B infection may drive early age-related viral load differences (Figures 2c and 2d). Thus, the magnitude and duration of viral shedding is a poor predictor of clinical outcome and is not associated with any measured demographic, clinical, or viral strain characteristic.
Figure 2.

Viral shedding in natural influenza-infected individuals. (a) Overall influenza A matrix gene or influenza B NS gene copy numbers were determined for each participant. Participants were classified as index cases, initially infected contacts, and subsequently infected contacts. (b) Influenza A matrix gene or influenza B NS gene copy numbers were determined for each participant over the course of infection by viral strain. (c) Viral loads determined for each influenza-infected participant by age. (d) Linear regression analysis for viral loads detected on study Day 0 with respect to participant age. Data are shown as natural log transformations of gene copy numbers. (e) Young participants were more likely to be hospitalized than older participants. Lines indicate mean age. Significance is indicated by q < 0.2 (the false discovery rate–adjusted P value accounting for the six outcomes that were tested).
Hospitalization was associated with age (Figure 2e), with the very young more likely to be hospitalized during natural influenza virus infection than older children (P = 0.002; q = 0.004). Furthermore, hospitalized children tended to have more severe LRT symptoms compared with nonhospitalized children (P = 0.0674), although the difference is only borderline significant, possibly because of reporting biases or sample size (e.g., parents scoring for their young children). Taken together, age is a key correlate of the clinical severity of natural influenza disease, and this severity is not defined by viral load or rate of clearance within the individual.
Site-of-Infection Cytokine Responses Associate with Each Other but Not with Peripheral Responses
Because there was little association between viral load and clinical outcome, we hypothesized that immune factors may have critical and independent roles in disease severity. We first analyzed how nasal lavage levels of cytokines correlated with similar measurements from the plasma. Within plasma and nasal lavages, 39 and 42 different cytokine levels, respectively, were measured (Figure 3a).
Figure 3.

Site-of-infection immune responses predict clinical outcomes. (a) Correlation coefficients were determined for 741 pairs of cytokines within the nasal lavage or plasma. The heat map indicates the correlation coefficients, with red, green, and black indicating perfect positive, negative, and no correlation, respectively. Correlations with false discovery rate (FDR)-adjusted q value > 0.2 were set to zero. (b) Correlations of nasal lavage or plasma cytokines with participant age. *q < 0.2 where q is the FDR-adjusted P value across all cytokines (either plasma or nasal lavage). Day 0 cytokines present in the nasal lavage (c and d) or plasma (e and f) were examined for correlations with viral loads, symptom scores, and clinical outcomes as described in the Methods. The heat map indicates the correlation coefficient (c and e) or the FDR-adjusted values (d and f). EGF = epidermal growth factor; FGF = fibroblast growth factor; FKN = fractalkine; GCSF = granulocyte colony–stimulating factor; GMCSF = granulocyte-macrophage colony–stimulating factor; GRO = growth-regulated oncogene; IP = IFNγ-induced protein; LRT = lower respiratory tract symptom scores; MCP = monocyte chemotactic protein; MDC = macrophage-derived chemokine; MIP = macrophage inflammatory protein; PDGF = platelet-derived growth factor; RANTES = regulated on activation, normal T-cell expressed and secreted; TGF = transforming growth factor; TNF = tumor necrosis factor; Total = total symptom score; URT = upper respiratory tract symptom scores; VEGF = vascular endothelial growth factor.
Substantial correlation was found between cytokine concentrations within the nasal lavage (Figure 3a, lower left), with a significant correlation coefficient between 90% (773 of 861) of cytokines measured. In contrast, weaker covariations were observed between cytokine concentrations in the plasma (57%; 422 of 741) (Figure 3a, upper right). Comparisons of cytokine concentrations measured in plasma versus nasal lavage (Figure 3a, upper left) showed that the same cytokines from these sources were only weakly correlated, with 21 of 39 cytokines not significantly correlated between the two sites (q > 0.2). These findings were independent of the year of enrollment (data not shown). This cytokine panel broadly represents the output of several characteristic innate and adaptive immune responses and suggests that the plasma is a poor reflection of the immune profile at the site of the infection.
Local Inflammatory Cytokines Are Inversely Correlated with Age and Do Not Depend on Viral Load
Because age seems to be a better predictor of clinical severity compared with viral dynamics (Figure 2e), we investigated whether there was an age association with the immune response. We found that overall, infants and young children had significantly higher cytokine levels than adults during influenza infection (see Table E2; Figure 3b), and this negative correlation is stronger with cytokines examined within nasal lavages than in plasma. Importantly, when this analysis is adjusted for viral load, the association with age is no longer significant for most plasma cytokines, but remains intact in the nasal lavage (data not shown). Thus, the local immune response measured in the nasal lavage is inversely correlated with age in a manner independent of viral load.
Children, particularly infants and neonates, may lack preexisting immunity, including neutralizing antibodies present at the time of enrollment, because of reduced exposure to influenza virus or other pathogens. However, we found no significant differences in participant age when grouped by neutralization titer at the time of enrollment, indicating that existing neutralizing antibody titers do not depend on age (see Figure E2a). Next we examined the association between age and cytokines, adjusting for the presence of existing neutralizing antibody titers. We found that the correlations between age and cytokine levels remain significant, and importantly, the nasal lavage and plasma cytokines significantly associated with age (Figure 3b) remain significant even after adjusting for the presence of existing neutralization antibody. These associations were consistent among participants who had existing neutralizing antibodies (determined as a microneutralization titer >1:40) to the same type of influenza virus they were infected by (strain A or strain B) (see Figure E2b) and those who had existing neutralizing antibodies to the infecting influenza strain (H1 or H3 or B) (see Figure E2c). Therefore, existing immunity, as measured by microneutralization titers at the time of enrollment, did not influence age-related cytokine expression.
Site-of-Infection Immune Responses Predict Poor Clinical Outcomes
Using the same panel of cytokines, we examined early symptom scores (Days 0–3), day of enrollment viral loads, and hospitalization status, and their relation to individual inflammatory cytokines. We prespecified a subgroup of 11 cytokines representative of diverse immune activities to focus our analysis and prevent loss of power from multiple comparisons. This down sampling statistical plan was made before any analysis of the cytokine data. Because we established that several of these inflammatory cytokines were age-associated, we performed a multivariate logistic regression and adjusted for age-associated effects. Following false discovery rate adjustment, only the Day 0 nasal lavage levels of IFN-α2 and monocyte chemotactic protein (MCP)-3 positively correlated with URT, LRT, and total symptom scores, and none of the selected cytokines correlated with viral loads (Table 3, Figures 3c, 3d, 4a, and 4b). In addition, IL-6 and vascular endothelial growth factor correlated with URT scores. Systemic cytokines, while measured at lower concentrations in the blood than found in nasal lavages, were also found to be positively associated with symptom severity (Table 3, Figures 3e and 3f). MCP-3 was again associated with LRT, URT, and total symptom scores, as was plasma IL-10 (Figure 4c). Systemic MCP-3, IL-10, and IL-6 were associated with hospitalization as a clinical outcome (Table 3, Figure 4d). All of these associations remain significant after adjusting for viral load. This is consistent with the finding that viral load did not correlate with clinical outcomes or clinical scores and suggests an independent role for immunopathogenesis in the clinical outcome of influenza infection.
Table 3:
Day of Enrollment Cytokine Levels Correlate with Participant Symptom Scores
| Cytokine | Symptom or Outcome | Rho or Odds Ratio | P Value | q Value |
|---|---|---|---|---|
| Nasal lavage | ||||
| IFN-α2 | Total symptoms | 0.456 | 0.002 | 0.007 |
| IFN-α2 | URT | 0.46 | 0.002 | 0.007 |
| IFN-α2 | LRT | 0.36 | 0.019 | 0.038 |
| MCP-3 | Total symptoms | 0.371 | 0.014 | 0.031 |
| MCP-3 | URT | 0.371 | 0.014 | 0.031 |
| MCP-3 | LRT | 0.367 | 0.016 | 0.031 |
| IL-6 | URT | 0.331 | 0.03 | 0.181 |
| VEGF | URT | 0.384 | 0.013 | 0.079 |
| Plasma | ||||
| MCP-3 | Total symptoms | 0.278 | 0.145 | 0.174 |
| MCP-3 | URT | 0.376 | 0.045 | 0.089 |
| MCP-3 | LRT | 0.428 | 0.021 | 0.062 |
| MCP-3 | Hospitalized | 1.857 | 0.066 | 0.1 |
| IL-10 | Total symptoms | 0.297 | 0.117 | 0.141 |
| IL-10 | URT | 0.453 | 0.014 | 0.041 |
| IL-10 | LRT | 0.509 | 0.005 | 0.029 |
| IL-10 | Hospitalized | 1.813 | 0.077 | 0.141 |
| IL-6 | LRT | 0.395 | 0.034 | 0.131 |
| IL-6 | Hospitalized | 1.813 | 0.044 | 0.131 |
| IP-10 | Viral load | 0.404 | 0.013 | 0.079 |
Definition of abbreviations: IP = IFNγ-induced protein; LRT = lower respiratory tract; MCP = monocyte chemotactic protein; URT = upper respiratory tract; VEGF = vascular endothelial growth factor.
Figure 4.

Cytokine levels predict symptom severity. Day 0 cytokines present in the nasal lavage (a and b) or plasma (c and d) were examined for correlations with symptom scores and hospitalization as described in the Methods and shown in Figure 3. LRT = lower respiratory tract symptom scores; MCP = monocyte chemotactic protein; OR = odds ratio.
Monocyte Recruitment at the Site of Infection
Because the cytokines associated with clinical outcome were associated with innate immunity, we next examined three populations of monocytes using surface CD14 and CD16 expression: CD14+/16− “conventional” monocytes, CD14+/16+ “double positive” monocytes, and CD14lo/16+ “patrolling” monocytes (18). In our analysis, we consider both the frequency of each subset relative to the total number of monocytes and also the absolute number of monocytes in each subset. The relative frequency describes the distribution of monocyte phenotypes in the blood or at the site of infection, whereas the absolute number reflects overall cellularity within that compartment.
We determined the relative frequency and total numbers of each of these three populations (Figure 5a) within peripheral blood mononuclear cells and nasal lavage cells from a subset of our participant cohort (Figures 5b–5e). Given the strong age associations we found with nasal lavage inflammatory responses, we investigated whether there were age associations with the monocyte profiles in either of these immune compartments (blood or nasal lavage). We found that the relative frequency of conventional CD14+/16− monocytes was negatively correlated with age (i.e., younger participants had greater frequencies of these conventional cells), whereas the frequency of CD14lo/16+ patrolling monocytes was positively correlated with age in the nasal lavage (Figure 6a). These data indicate that the distinct age-associated inflammatory cytokine profiles identified in Figure 3b are reflected in patterns of monocyte recruitment.
Figure 5.

Monocyte populations found at the site of infection are different from that in the blood. (a) An inclusion gating strategy was used to define monocyte populations, based on a study by Abeles and coworkers (35). Following identification of singlet events, total monocytes are gated to exclude most lymphocytes. Cells expressing CD16 but not HLA-DR may be CD16+ natural killer cells, and therefore excluded. Monocytes were categorized based on their expression patterns of CD14 and CD16. and nasal lavage cells from one representative participant are shown. Monocyte percentage (b and d) and number (c and e) are qualitatively different among influenza-infected individuals at enrollment depending on surface expression of CD14 and CD16. PBMC = peripheral blood mononuclear cells.
Figure 6.
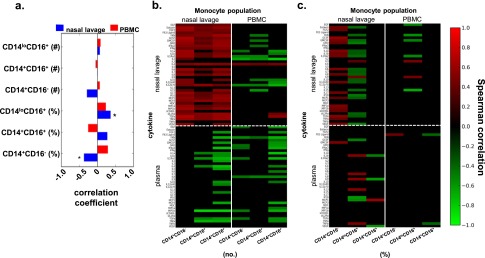
Monocytes at the site of infection are associated with increased cytokines. (a) Correlations of nasal lavage or PBMC monocytes with participant age. *q < 0.2 where q is the false discovery rate (FDR)–adjusted P value. Day of enrollment cytokines present in the nasal lavage or plasma were examined for correlations with CD14+CD16−, CD14lo/16+, and CD14+/16+ monocyte populations expressed as numbers (b) or percentages (c) as described in the Methods. The heat map indicates the Spearman correlation coefficients, with red, green, and black indicating perfect positive, negative, and no correlation, respectively. Correlations with FDR-adjusted q value > 0.2 were set to zero. PBMC = peripheral blood mononuclear cells.
Next, we investigated whether the absolute number or relative frequency of each monocyte subset was associated with the immune cytokine profiles that were predictive of illness outcome. Specifically, we separately assessed correlations between cytokines and monocyte subsets within the nasal lavage, and cytokines and monocyte subsets within the blood. Within the nasal lavage, the absolute number of each monocyte subset was positively correlated with cytokine levels (Figure 6b), suggesting that overall monocyte cellularity is generally associated with higher levels of inflammation at the site of infection. However, the relative frequencies of these monocyte subsets revealed a more complex relationship. The frequency of conventional CD14+/16− monocytes in the nasal lavage was positively correlated with multiple cytokines, whereas strikingly the frequency of patrolling CD14lo/16+ monocytes in the nasal lavage was largely inversely correlated with cytokine levels (Figure 6c; see Figure E3). The increased relative frequency of patrolling CD14lo/16+ monocytes in the nasal lavage (Figure 5b; see Figure E3) thus represents a less inflammatory state. In addition, the relative frequency of conventional CD14+/16− monocytes in the nasal lavage was positively correlated with cytokine levels (Figure 6c; see Figure E3). In fact, the ratio between the conventional and patrolling monocytes at the site of infection was predictive of the overall level of inflammation (Figure 7a). Smaller differences, representing a relatively higher frequency of patrolling compared with conventional monocytes, were negatively associated with MCP-3, IFN-α2, and IL-10 (Figure 7b), the cytokines that were predictive of clinical disease severity (Figures 3 and 4).
Figure 7.

A shift in the monocyte population from patrolling CD14lo/16+ to conventional CD14+/16− monocytes is positively correlated with (a) the total average cytokine score and (b) individual cytokines IFN-α2 and IL-10. The data are plotted as unadjusted values. MCP = monocyte chemotactic protein.
Discussion
Infants and young children are known to have a higher risk for poor clinical outcomes after infection with influenza virus (19, 20). Several explanations for this observation have been proposed, including deficient innate immune responses and lack of preexisting, protective immunity mediated by antibody and cellular responses. However, we and others found minimal viral load increases in the very young, indicating they are immunologically competent to clear virus. Additionally, we found no age association with existing antibody titer, although the precise relationship between preexisting innate and adaptive (including T cell) immunity and subsequent immune responses, particularly in children, warrants further study (21). Instead, a far more striking age association was observed with subsets of cytokines, particularly in the nasal lavage. Cytokine levels inversely correlated with age and included two broad categories of mediators, proinflammatory early innate or adaptive cytokines (IFN-α2, IL-1β, IP-10, MCP-3, IL-8, IL-10, IFN-γ, IL-6) and growth factors and late reparation mediators (platelet-derived growth factor, vascular endothelial growth factor, granulocyte colony–stimulating factor). This early proinflammatory burst of cytokines is reminiscent of the hypercytokinemia observed in some animal models of severe infection and humans infected with A(H5N1) viruses (9, 12, 22). Previous studies focusing exclusively on hospitalized patients with influenza infection found positive associations between serum IL-6, IL-8, MCP-1, and IP-10 levels and clinical severity (10, 11, 13, 23), whereas others showed no differences, possibly because of the restricted nature of their cohorts (24–27). The association shown here was independent of existing immunity as determined by protective neutralization antibody titer. Our findings, combined with a lack of association between age and viral loads, suggest that enhanced inflammatory responses mounted by children are driven by immunologic predisposition rather than failure to control pathogen levels.
Methods for assessing viral load in humans are severely limited by lack of access to the lower airways, where viral replication has been associated with post-mortem with lethal infection. Although we cannot discount subclinical lower airway infections, it seems likely that the longitudinal decline of adaptive immune mediators in plasma and nasal lavages of children following the same timeline as adults indicates comparable viral clearance mechanisms. Indeed, viral load was not predictive of clinical outcome in our study. Instead, elevated levels of MCP-3 in nasal lavage and plasma, and nasal lavage levels of IFN-α2, correlated with increased disease severity even after accounting for both factors’ association with age. The associations observed between plasma IL-10 and hospitalization and respiratory symptom scores are suggestive of a response to pathologic inflammation. IL-10 is an immunosuppressive cytokine, but is induced by inflammatory signals, such as type I IFNs (28). Murine models of influenza infection have demonstrated that IL-10 produced by CD8+ T cells in the lung is associated with reduced inflammation (29). Thus, elevated IL-10 levels may represent attempts by the host immune system to reverse a damaging inflammatory environment.
The predictive immune profile of MCP-3, IFN-α2, and IL-10 strongly suggested the differential involvement of monocytes in this participant population, and IFN-α produced by epithelial cells and innate immune cells can act in an autocrine and paracrine manner to limit infection (30). MCP-3 is a ligand for CCR2 (CD192) and CCR2-dependent inflammatory responses have been implicated in protective and pathologic responses in animal models (31). However, monocyte populations as defined in mouse models are not clearly associated with similar populations in humans. Instead, recent studies on human blood monocyte populations have defined three distinct phenotypes based on surface CD14 and CD16 expression: CD14+/16− “conventional” monocytes, CD14+/16+ “double positive” monocytes, and CD14lo/16+ “patrolling” monocytes, which are of particular interest because they are thought to have potent antiviral activity (18). Murine CCR2+ cells seem to be analogous to conventional monocytes in humans, which were correlated in our study with strong inflammation. In contrast, the CD14lo population was shown to secrete few cytokines and have a specific ability to respond to virally infected cells (18). A higher frequency of these cells relative to conventional monocytes within a nasal lavage monocyte population was predictive of lower overall cytokine inflammation, whereas a higher frequency of conventional monocytes was predictive of increased inflammation. This suggests that these two populations might be cross-regulatory, consistent with their purported roles in mouse models. The mechanisms by which patrolling monocytes might exert a negative regulatory influence remain a topic for further investigation and are poorly defined even in animal studies. Collectively, our analyses emphasize the distinct nature of blood and airway immunity and clearly demonstrate that the systemic immune response is not generally reflective of the airway environment.
The current study requires validation in future prospective cohorts designed and powered to confirm these associations. Toward this end, we have collected samples from subsequent influenza seasons, although we have not achieved statistical power yet to test our findings. Still, in a preliminary analysis, we were able to confirm the association between plasma IL-10 and LRT symptoms.
Correlations between cytokines and clinical outcomes may reflect underlying genetic variation. Recent evidence suggests that TNF polymorphisms and deficient IFN-induced transmembrane (IFITM) proteins involved in antiviral defense may be associated with influenza infection or disease severity, respectively (14, 32). Individuals, particularly those of Asian descent, with severe influenza disease showed enrichment for an IFITM3 polymorphism and increased serum MCP-1 (25, 33). Interestingly, presence of the IFITM3 polymorphism did not affect overall influenza-specific T-cell responses.
Taken together, our results suggest that younger individuals are more likely to produce a proinflammatory environment and that general inflammation is not predictive of a poor outcome but that a specific immune profile, characterized by MCP-3, IFN-α2, and IL-10, can predict disease severity. These cytokines, characteristic of innate immune responses, also correlated with the pattern of monocyte recruitment. Clinically, defining the characteristics of protective versus pathologic immune responses on presentation might allow for targeted interventions in young children to ameliorate severe disease. A recent metaanalysis of treatment with oseltamivir indicated that antiviral treatment may be of limited therapeutic effect (34). Although our study was not designed to test the efficacy of oseltamivir, our data point to one possible explanation for this outcome: hyperactive innate immune responses in young children may be a more important contributor to poor disease outcome than failure to control viral replication. Defining predictive markers of these pathologic responses that appear early in infection may provide new clinical treatment modalities for improving outcomes, especially in the young.
Acknowledgments
Acknowledgment
The authors thank the participants who contributed to the study and acknowledge the clinical work of Lisa Harrison and the clinical team at the UTHSC, Le Bonheur Children’s Hospital. They thank Dr. John J. Treanor (University of Rochester Medical Center, Rochester, NY) for providing counsel regarding study design; Thomas H. Oguin III and Lana McClaren for technical assistance; Ashley Webb, Jeri Carol Crumpton, and Kimberly Friedman for their help with virologic assays; and Dr. Pamela McKenzie and Dr. Kyle Johnson for assisting in the study management. They thank Mark Weilnau, Jerry Parker, Richard Elia, and Ramin Tabrizi for data management and Xiaoping Xiong and Si Chen for helpful discussion.
Footnotes
Supported in part by the National Institute of Allergy and Infectious Diseases, the National Institutes of Health, under contract number HHSN266200700005C and ALSAC.
Author Contributions: C.M.O., A.J.G., and P.G.T. wrote the manuscript. C.M.O., P.L.R., M.A.C., J.P.D., R.J.W., and P.G.T. designed the study. C.M.O., S.-S.W., T.J., P.L.R., J.P.D., and D.W. collected the data. C.M.O., A.J.G., S.-S.W., and T.H. analyzed the data. C.M.O., A.J.G., and T.H. designed the figures. P.L.R. and J.P.D. recruited study participants. All authors approved the final manuscript.
This article has an online supplement, which is accessible from this issue's table of contents at www.atsjournals.org
Originally Published in Press as DOI: 10.1164/rccm.201309-1616OC on December 5, 2013
Author disclosures are available with the text of this article at www.atsjournals.org.
References
- 1.Wrammert J, Koutsonanos D, Li GM, Edupuganti S, Sui J, Morrissey M, McCausland M, Skountzou I, Hornig M, Lipkin WI, et al. Broadly cross-reactive antibodies dominate the human B cell response against 2009 pandemic H1N1 influenza virus infection. J Exp Med. 2011;208:181–193. doi: 10.1084/jem.20101352. [DOI] [PMC free article] [PubMed] [Google Scholar]
- 2.Liu W, de Vlas SJ, Tang F, Ma MJ, Wei MT, Liu LJ, Li ZD, Zhang L, Xin ZT, Tong YG, et al. Clinical and immunological characteristics of patients with 2009 pandemic influenza A (H1N1) virus infection after vaccination. Clin Infect Dis. 2010;51:1028–1032. doi: 10.1086/656588. [DOI] [PubMed] [Google Scholar]
- 3.Baluch A, Humar A, Egli A, Gubbay J, Lisboa L, Wilson L, Kumar D. Long term immune responses to pandemic influenza A/H1N1 infection in solid organ transplant recipients. PLoS ONE. 2011;6:e28627. doi: 10.1371/journal.pone.0028627. [DOI] [PMC free article] [PubMed] [Google Scholar]
- 4.Johnson PR, Feldman S, Thompson JM, Mahoney JD, Wright PF. Immunity to influenza A virus infection in young children: a comparison of natural infection, live cold-adapted vaccine, and inactivated vaccine. J Infect Dis. 1986;154:121–127. doi: 10.1093/infdis/154.1.121. [DOI] [PubMed] [Google Scholar]
- 5.Richards KA, Topham D, Chaves FA, Sant AJ. Cutting edge: CD4 T cells generated from encounter with seasonal influenza viruses and vaccines have broad protein specificity and can directly recognize naturally generated epitopes derived from the live pandemic H1N1 virus. J Immunol. 2010;185:4998–5002. doi: 10.4049/jimmunol.1001395. [DOI] [PubMed] [Google Scholar]
- 6.Sato M, Hosoya M, Wright PF. Differences in serum cytokine levels between influenza virus A and B infections in children. Cytokine. 2009;47:65–68. doi: 10.1016/j.cyto.2009.05.003. [DOI] [PubMed] [Google Scholar]
- 7.Oshansky CM, Thomas PG. The human side of influenza. J Leukoc Biol. 2012;92:83–96. doi: 10.1189/jlb.1011506. [DOI] [PMC free article] [PubMed] [Google Scholar]
- 8.La Gruta NL, Kedzierska K, Stambas J, Doherty PC. A question of self-preservation: immunopathology in influenza virus infection. Immunol Cell Biol. 2007;85:85–92. doi: 10.1038/sj.icb.7100026. [DOI] [PubMed] [Google Scholar]
- 9.de Jong MD, Simmons CP, Thanh TT, Hien VM, Smith GJ, Chau TN, Hoang DM, Chau NV, Khanh TH, Dong VC, et al. Fatal outcome of human influenza A (H5N1) is associated with high viral load and hypercytokinemia. Nat Med. 2006;12:1203–1207. doi: 10.1038/nm1477. [DOI] [PMC free article] [PubMed] [Google Scholar]
- 10.Lee N, Wong CK, Chan PK, Chan MC, Wong RY, Lun SW, Ngai KL, Lui GC, Wong BC, Lee SK, et al. Cytokine response patterns in severe pandemic 2009 H1N1 and seasonal influenza among hospitalized adults. PLoS ONE. 2011;6:e26050. doi: 10.1371/journal.pone.0026050. [DOI] [PMC free article] [PubMed] [Google Scholar]
- 11.Paquette SG, Banner D, Zhao Z, Fang Y, Huang SS, Leomicronn AJ, Ng DC, Almansa R, Martin-Loeches I, Ramirez P, et al. Interleukin-6 is a potential biomarker for severe pandemic H1N1 influenza A infection. PLoS ONE. 2012;7:e38214. doi: 10.1371/journal.pone.0038214. [DOI] [PMC free article] [PubMed] [Google Scholar]
- 12.Peiris JS, Yu WC, Leung CW, Cheung CY, Ng WF, Nicholls JM, Ng TK, Chan KH, Lai ST, Lim WL, et al. Re-emergence of fatal human influenza A subtype H5N1 disease. Lancet. 2004;363:617–619. doi: 10.1016/S0140-6736(04)15595-5. [DOI] [PMC free article] [PubMed] [Google Scholar]
- 13.Hagau N, Slavcovici A, Gonganau DN, Oltean S, Dirzu DS, Brezoszki ES, Maxim M, Ciuce C, Mlesnite M, Gavrus RL, et al. Clinical aspects and cytokine response in severe H1N1 influenza A virus infection. Crit Care. 2010;14:R203. doi: 10.1186/cc9324. [DOI] [PMC free article] [PubMed] [Google Scholar]
- 14.Everitt AR, Clare S, Pertel T, John SP, Wash RS, Smith SE, Chin CR, Feeley EM, Sims JS, Adams DJ, et al. GenISIS Investigators; MOSAIC Investigators. IFITM3 restricts the morbidity and mortality associated with influenza. Nature. 2012;484:519–523. doi: 10.1038/nature10921. [DOI] [PMC free article] [PubMed] [Google Scholar]
- 15.Zhao Y, Zhang YH, Denney L, Young D, Powell TJ, Peng YC, Li N, Yan HP, Wang DY, Shu YL, et al. High levels of virus-specific CD4+ T cells predict severe pandemic influenza A virus infection. Am J Respir Crit Care Med. 2012;186:1292–1297. doi: 10.1164/rccm.201207-1245OC. [DOI] [PubMed] [Google Scholar]
- 16.Wilkinson TM, Li CK, Chui CS, Huang AK, Perkins M, Liebner JC, Lambkin-Williams R, Gilbert A, Oxford J, Nicholas B, et al. Preexisting influenza-specific CD4+ T cells correlate with disease protection against influenza challenge in humans. Nat Med. 2012;18:274–280. doi: 10.1038/nm.2612. [DOI] [PubMed] [Google Scholar]
- 17.Fiore AE, Uyeki TM, Broder K, Finelli L, Euler GL, Singleton JA, Iskander JK, Wortley PM, Shay DK, Bresee JS, et al. Centers for Disease Control and Prevention (CDC) Prevention and control of influenza with vaccines: recommendations of the Advisory Committee on Immunization Practices (ACIP), 2010. MMWR Recomm Rep. 2010;59:1–62. [PubMed] [Google Scholar]
- 18.Cros J, Cagnard N, Woollard K, Patey N, Zhang SY, Senechal B, Puel A, Biswas SK, Moshous D, Picard C, et al. Human CD14dim monocytes patrol and sense nucleic acids and viruses via TLR7 and TLR8 receptors. Immunity. 2010;33:375–386. doi: 10.1016/j.immuni.2010.08.012. [DOI] [PMC free article] [PubMed] [Google Scholar]
- 19.Pickering LK, editor. 29th ed. Elk Grove Village, IL: American Academy of Pediatrics; 2012. Red Book: 2012 Report of the Committee on Infectious Diseases. [Google Scholar]
- 20.Iskander M, Booy R, Lambert S. The burden of influenza in children. Curr Opin Infect Dis. 2007;20:259–263. doi: 10.1097/QCO.0b013e3280ad4687. [DOI] [PubMed] [Google Scholar]
- 21.Zinkernagel RM. Immunological memory not equal protective immunity. Cell Mol Life Sci. 2012;69:1635–1640. doi: 10.1007/s00018-012-0972-y. [DOI] [PMC free article] [PubMed] [Google Scholar]
- 22.Kobasa D, Takada A, Shinya K, Hatta M, Halfmann P, Theriault S, Suzuki H, Nishimura H, Mitamura K, Sugaya N, et al. Enhanced virulence of influenza A viruses with the haemagglutinin of the 1918 pandemic virus. Nature. 2004;431:703–707. doi: 10.1038/nature02951. [DOI] [PubMed] [Google Scholar]
- 23.Lee N, Chan PK, Wong CK, Wong KT, Choi KW, Joynt GM, Lam P, Chan MC, Wong BC, Lui GC, et al. Viral clearance and inflammatory response patterns in adults hospitalized for pandemic 2009 influenza A(H1N1) virus pneumonia. Antivir Ther. 2011;16:237–247. doi: 10.3851/IMP1722. [DOI] [PubMed] [Google Scholar]
- 24.Wen Y, Deng BC, Zhou Y, Wang Y, Cui W, Wang W, Liu P. Immunological features in patients with pneumonitis due to influenza A H1N1 infection. J Investig Allergol Clin Immunol. 2011;21:44–50. [PubMed] [Google Scholar]
- 25.Welliver TP, Reed JL, Welliver RC., Sr Respiratory syncytial virus and influenza virus infections: observations from tissues of fatal infant cases. Pediatr Infect Dis J. 2008;27(Suppl. 10):S92–S96. doi: 10.1097/INF.0b013e318168b706. [DOI] [PubMed] [Google Scholar]
- 26.Heltzer ML, Coffin SE, Maurer K, Bagashev A, Zhang Z, Orange JS, Sullivan KE. Immune dysregulation in severe influenza. J Leukoc Biol. 2009;85:1036–1043. doi: 10.1189/jlb.1108710. [DOI] [PMC free article] [PubMed] [Google Scholar]
- 27.Kim YH, Kim JE, Hyun MC. Cytokine response in pediatric patients with pandemic influenza H1N1 2009 virus infection and pneumonia: comparison with pediatric pneumonia without H1N1 2009 infection. Pediatr Pulmonol. 2011;46:1233–1239. doi: 10.1002/ppul.21496. [DOI] [PMC free article] [PubMed] [Google Scholar]
- 28.Guarda G, Braun M, Staehli F, Tardivel A, Mattmann C, Förster I, Farlik M, Decker T, Du Pasquier RA, Romero P, et al. Type I interferon inhibits interleukin-1 production and inflammasome activation. Immunity. 2011;34:213–223. doi: 10.1016/j.immuni.2011.02.006. [DOI] [PubMed] [Google Scholar]
- 29.Sun J, Madan R, Karp CL, Braciale TJ. Effector T cells control lung inflammation during acute influenza virus infection by producing IL-10. Nat Med. 2009;15:277–284. doi: 10.1038/nm.1929. [DOI] [PMC free article] [PubMed] [Google Scholar]
- 30.Vareille M, Kieninger E, Edwards MR, Regamey N. The airway epithelium: soldier in the fight against respiratory viruses. Clin Microbiol Rev. 2011;24:210–229. doi: 10.1128/CMR.00014-10. [DOI] [PMC free article] [PubMed] [Google Scholar]
- 31.Aldridge JR, Jr, Moseley CE, Boltz DA, Negovetich NJ, Reynolds C, Franks J, Brown SA, Doherty PC, Webster RG, Thomas PG. TNF/iNOS-producing dendritic cells are the necessary evil of lethal influenza virus infection. Proc Natl Acad Sci USA. 2009;106:5306–5311. doi: 10.1073/pnas.0900655106. [DOI] [PMC free article] [PubMed] [Google Scholar]
- 32.Morales-García G, Falfán-Valencia R, García-Ramírez RA, Camarena A, Ramirez-Venegas A, Castillejos-López M, Pérez-Rodríguez M, González-Bonilla C, Grajales-Muñíz C, Borja-Aburto V, et al. Pandemic influenza A/H1N1 virus infection and TNF, LTA, IL1B, IL6, IL8, and CCL polymorphisms in Mexican population: a case-control study. BMC Infect Dis. 2012;12:299. doi: 10.1186/1471-2334-12-299. [DOI] [PMC free article] [PubMed] [Google Scholar]
- 33.Zhang YH, Zhao Y, Li N, Peng YC, Giannoulatou E, Jin RH, Yan HP, Wu H, Liu JH, Liu N, et al. Interferon-induced transmembrane protein-3 genetic variant rs12252-c is associated with severe influenza in Chinese individuals. Nature Communications. 2013;4:1418. doi: 10.1038/ncomms2433. [DOI] [PMC free article] [PubMed] [Google Scholar]
- 34.Wang K, Shun-Shin M, Gill P, Perera R, Harnden A. Neuraminidase inhibitors for preventing and treating influenza in children (published trials only) Cochrane Database Syst Rev. 2012;4:CD002744. doi: 10.1002/14651858.CD002744.pub4. [DOI] [PMC free article] [PubMed] [Google Scholar]
- 35.Abeles RD, McPhail MJ, Sowter D, Antoniades CG, Vergis N, Vijay GK, Xystrakis E, Khamri W, Shawcross DL, Ma Y, et al. CD14, CD16 and HLA-DR reliably identifies human monocytes and their subsets in the context of pathologically reduced HLA-DR expression by CD14(HI) /CD16(neg) monocytes: expansion of CD14(HI) /CD16(pos) and contraction of CD14(lo) /CD16(pos) monocytes in acute liver failure. Cytometry Part A. 2012;81:823–834. doi: 10.1002/cyto.a.22104. [DOI] [PubMed] [Google Scholar]