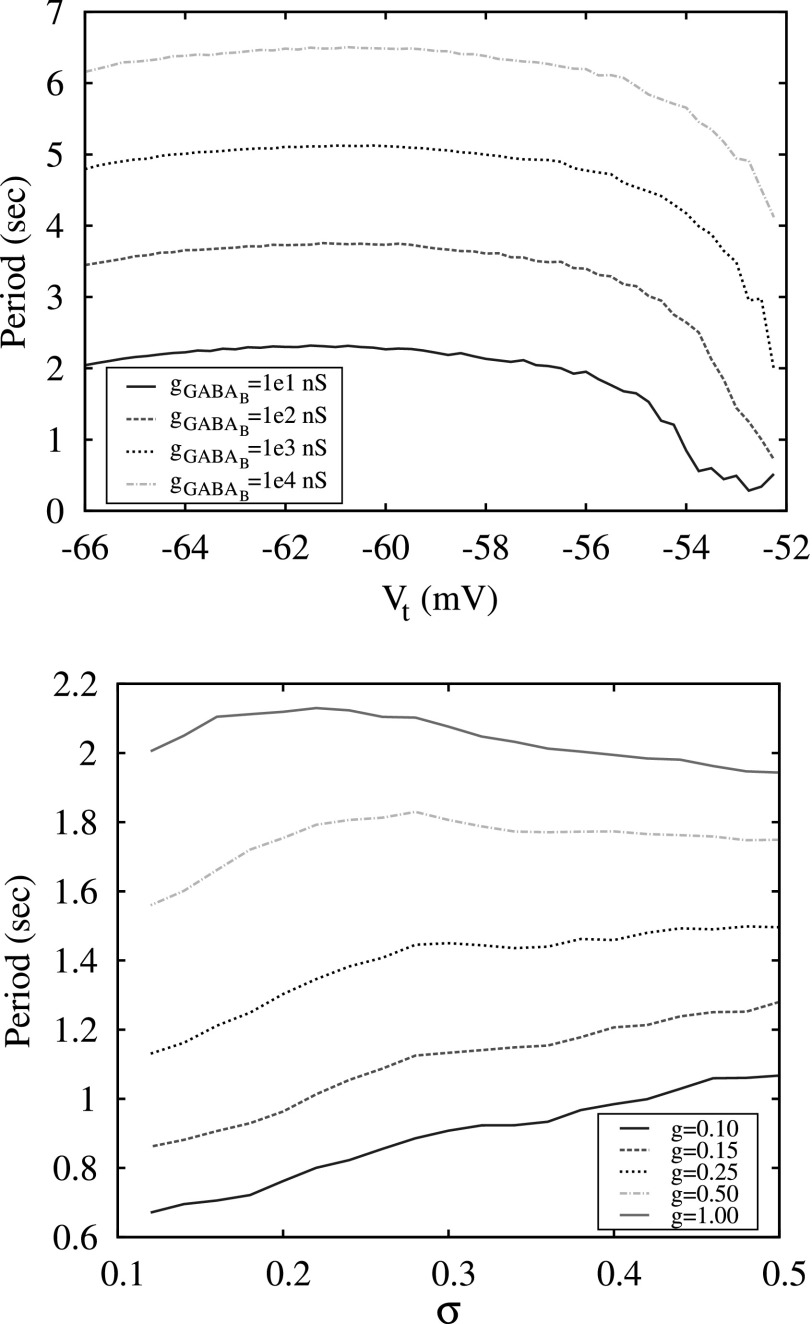
Figure 8.
The top panel shows the period of switching activity in a conductance-based three-neuron network versus the different values of threshold of excitation, Vt, computed for different values of synaptic strength . The bottom panel shows the period of switching activity in a map-based three-neuron network versus different levels of excitation, σ, and synaptic strength g.

