

Abstract
This paper describes the use of Surface Plasmon Resonance imaging (SPRi) as an emerging technique to study bacterial physiology in real-time without labels. The overwhelming majority of bacteria on earth exist in large multicellular communities known as biofilms. Biofilms are especially problematic because they facilitate the survival of pathogens, leading to chronic and recurring infections as well as costly industrial complications. Monitoring biofilm accumulation and removal is therefore critical in these and other applications. SPRi uniquely provides label-free, high-resolution images of biomass coverage on large channel surfaces up to 1 cm2 in real time, which allow quantitative assessment of biofilm dynamics. The rapid imaging capabilities of this technique are particularly relevant for multicellular bacterial studies, as these cells can swim several body lengths per second and divide multiple times per hour. We present here the first application of SPRi to image Escherichia coli and Pseudomonas aeruginosa cells moving, attaching, and forming biofilms across a large surface. This is also the first time that biofilm removal has been visualized with SPRi, which has important implications for monitoring the biofouling and regeneration of fluidic systems. Initial images of the removal process show that the biofilm releases from the surface as a wave along the direction of the fluid flow.
INTRODUCTION
Bacteria on Earth exist predominantly as biofilms, which are complex microbial communities embedded in a matrix of extracellular substances and immobilized on surfaces.1, 2 Understanding and controlling biofilms are critical in a myriad of health and industrial settings such as medical instrumentation, bioremediation, water treatment, and food processing facilities. As these biofilms age or are exposed to hostile conditions, they decompose and spread to new areas as robust, insulated clusters of cells, potentially causing new infection and contamination sites.3, 4, 5, 6 In industrial settings, particulate biomass leads to clogs and contamination in bioreactors and in cooling systems that can result in annual losses of millions of dollars. Yet, no anti-biofilm products are available commercially.7 Given the enormity of the problem and lack of solutions suggest that additional fundamental studies in the area of biofilm dynamics are necessary.8
Tracking the motion of bacteria provides essential information about cell motility mechanisms and collective behaviors such as swarming, colony expansion, and biofilm formation.9, 10 Using signaling molecules, bacteria can locate each other, organize to form protective biofilms, and coordinate production of various toxins and antibiotics.11 While much is known about how signaling molecules regulate intracellular machinery and cellular functions, significantly less is known about the overall physiological response and intercellular relationships. For example, by optically monitoring fluorescently labeled bacteria in microfluidic chambers, it has been shown that the tendency for bacteria to congregate is dependent on both the geometry as well as the chemical composition of their local environment.12, 13
While bacterial cells use molecular signaling for guidance as they navigate through their environment, once they arrive at their destination, they attach themselves to a surface and produce extracellular matrices resulting in biofilms.14, 15 The composition of biofilms is heterogeneous in both space and time. The properties of biofilms made by the same species can vary dramatically depending on the external conditions to which cells are exposed.16 Biofilms can be opaque, making them difficult to view optically. A mature biofilm on a hard surface may span several millimeters and be composed of millions of cells, making it very challenging to image and study.
Further, biofilms eventually undergo natural disassembly. It is not yet completely understood how this process is regulated and how cells are freed from the matrix. The mechanisms by which biofilms decompose have important consequences for health and industrial applications. Dissolution of the extracellular matrix and release of individual cells is much preferred over clumps or chucks of biofilm migrating away from the primary site, as cells that are not surrounded by a matrix are more susceptible to antibiotics. The method of biofilm decomposition and removal during cleaning processes is equally important to prevent reattachment and clogging in different sections of a fluidic system.17
Biofilm analysis
While several techniques already exist for monitoring biofilms, Surface Plasmon Resonance imaging (SPRi) offers the unique advantages of sub-monolayer resolution of small molecules and other biomaterial on surfaces accompanied by large area imaging (1 cm2).18, 19 No other technique can provide these two attributes simultaneously, which are vitally important for investigating biofilm formation and removal.20 The large area is necessary because the simultaneous movement of hundreds or thousands of cells, as well as the insoluble polysaccharides and proteins excreted by the cells, in a biofilm must be tracked during each stage of the biofilm life cycle.14 Several techniques have been developed to address these unique challenges.
Super-resolution techniques provide molecular level resolution in three dimensions, but have a working area of only a few micrometers and require fluorescent molecules.21 Atomic force microscopy (AFM) requires that a probe physically approach the surface of the biofilm and provides limited chemical information. Confocal microscopy does not provide quite the same level of resolution as super-resolution and AFM, but is able to construct three dimensional images of a biofilm.22, 23 The complexity and cost of confocal systems, however, has limited their use. For the three techniques described above, obtaining high-resolution analysis of mm2 areas requires minutes to hours because information must be obtained from individual small areas or volumes and stitched together, which is not ideal as bacterial events take place on the order of seconds and minutes. In contrast, SPRi acquires an image of a 1 cm2 surface with 7 μm2 resolution every 3 s. Its simplicity, rapid analysis, low-cost compared to confocal microscopy, and potential miniaturization24, 25 make it an ideal technique for studying biofilm formation and decomposition in clinical and industrial environments that will potentially lead to new strategies for controlling biofilms.
The use of standard SPR and SPRi for bacterial analysis is becoming increasingly prevalent.26 Standard SPR has been used to study the adhesion of Pseudomonas aeruginosa on bare and modified gold surfaces.27 The results of these experiments showed that differences in binding kinetics could be distinguished for different surfaces and strains of cells. SPR is being used to determine the binding mechanisms of bacterial species by testing their adhesion kinetics to various natural and synthetic materials.28, 29 The identification of bacterial species present in a fluid sample was very recently demonstrated by functionalizing the surface of a SPRi chip with antibodies.30 While selectively identifying pathogens, this approach, forces the cells into specific orientations on the surface and does not allow them to assemble naturally and thus addresses a fundamentally different question from what is presented here. SPR is being tested in pilot plants to detect biofilm formation on reactor surfaces.31 We envision the extension of this technology to microfluidic reactors and monitoring of entire microscale systems with SPRi.
The rapid imaging capabilities of a SPRi system are particularly important for multicellular and bacterial movement investigations. Bacteria, such as P. aeruginosa, for example, can swim at speeds up to 50 μm/s.32 Bacterial cells can also divide every 20 min, indicating that they can cover a large surface and form microcolonies very rapidly under certain conditions. By using chambers and channels that confine cells near the sensor surface, it is possible to observe physical activity inside the chambers, such as cell movement and growth, which cause local changes in refractive index that are monitored continuously by SPRi.19 Even though the cells are much larger than the approximately 200 nm electromagnetic field that extends from the sensor surface, a significant portion of the cell is located within the field and is detected. We exploit this fact to image the movement, adhesion, and removal of cells in biofilms in real-time at the sensor surface.33
MATERIALS AND METHODS
Fluidic chamber
Sylgard 184 polydimethylsiloxane (PDMS) (Ellsworth Adhesives) was used to fabricate chambers that isolated and separated samples containing bacteria from each other and the environment during experiments. Master molds for creating microchambers were made by cutting out a narrow strip of Scotch Transparent Tape (3M) (approximately 100 μm thick) and attaching it to a glass microscope slide. PDMS was made by mixing silicon elastomer base and silicon elastomer curing agent were mixed together in a 10:1 ratio and the mixture was poured on the master, degassed for 30 min, and cured at 70 °C for 1 h. Large chambers were fabricated by cutting out parts of the PDMS from a smooth block that was cured on a bare glass slide. Access holes to load the chambers were drilled manually using a sharpened 19 gauge needle.
Sensing surface
High-refractive index glass prisms coated with 50 nm of gold on top of a 2 nm thick chromium adhesion layer (SPRi-Biochip) were purchased from Horiba Scientific. These sensing surfaces were reused for several experiments. After each experiment, the gold surface was rinsed extensively with isopropanol and wiped with Kimwipes (Kimtech) wetted with isopropanol. This was followed by rinsing with ethanol and air-drying using pressurized air. The vertical scratches observed on the SPRi images are the result of scratches in the gold that developed after repeated cleaning.
SPRi instrument
PDMS chambers were pressure sealed on top of the gold sensing surface, loaded with samples, and placed into the SPRi instrument (SPRi-Lab+, Horiba Scientific). The instrument uses an 810 nm light-emitting diode (LED) as its light source and the resonance peak is initially identified by obtaining images at multiple incident light angles and selecting the image that has the best contrast. Once the resonance angle was found, it remained fixed throughout the duration of the experiment. Changes in reflected light intensity in areas of the surface are the result of the resonance peak shifting in those areas. The reflected light was detected using a CCD camera with 7 μm pixel pitch. The standard gasket seal in the instrument was removed to create the space necessary for the PDMS chip.
Cells
Green fluorescent protein (GFP)-labeled Escherichia coli K-12 bacteria were provided by the laboratory of Professor Slava Epstein in Department of Biology at Northeastern University. P. aeruginosa PA14 wild type and PA14 strains were provided by the group of Professor Gerald Pier at Brigham and Women's Hospital in Boston, MA. Cyan fluorescent protein (CFP)-labeled P. aeruginosa PAO1 were provided by the Godoy Group in the Department of Biology at Northeastern University. E. coli and P. aeruginosa PAO1 were cultured in Lysogeny Broth (LB) growth media (281210 BD Difco Agar Technical, 244610 BD Difco Luria Bertani Broth, Miller). Wild type P. aeruginosa PA14 and pelA mutant P. aeruginosa PA14 were cultured in trypticase soy broth. Samples taken from these stock cultures were inoculated in 5 ml of fresh growth media and stored at 37 °C for several hours, to initiate exponential growth, before being loaded into chips for imaging at room temperature, except for the E. coli experiments in large chambers, where the stock bacterial solution was inoculated into fresh LB growth media, loaded inside the chamber, and imaged immediately at room temperature without incubation.
Biofilm removal
An initial image of a blank gold coated prism was obtained using SPRi. GFP-labeled E. coli were inoculated in LB growth media and 200 μl of this media was placed on a gold coated prism surface. A PDMS chamber was used to cover the solution to limit evaporation and allow oxygen diffusion into the media during biofilm formation. After incubation for 24 h at 37 °C, the PDMS cover was removed and micrographs of the biofilm were taken. The biofilm coated surface was then inserted into the SPRi instrument. A flow cell was sealed over the surface and images were acquired continuously while various solutions were flowed through the cell at 2 ml/min.
Surface characterization
After SPRi imaging, sensor surfaces were analyzed using fluorescence microscopy. In order to focus on the gold sensor surface, the PDMS chamber was removed and the solution on the sensor surface was covered loosely to prevent contamination and allowed to air dry in a biosafety cabinet for approximately 2 h. Then images of the sensor surface were obtained using a monochrome CCD camera (AxioCam MRm Rev.3, Zeiss) mounted on a stereo microscope (Discovery V20, Zeiss) or upright microscope (Axio Imager A2, Zeiss) with a 10× objective.
Samples prepared for scanning electron microscope (SEM) imaging were first dried and imaged using fluorescence microscopy. The entire prism was then gently submerged in gluteraldehyde to fix the biofilm on the surface, followed by dehydration in increasing concentrations of ethanol (35%, 50%, 75%, 85%, 95%, and 100%) and a final wash with cacodylate buffer (0.1M, pH 7). The prism along with the biofilm was then sputter-coated with a thin layer of Pt/Pd alloy (Cressington Sputter Coater 208HR) and imaged with a Hitachi S-4800 Field Emission SEM.
RESULTS AND DISCUSSION
E. coli
We first used SPRi to detect the growth and movement of GFP-labeled E. coli along the sensor surface inside a closed microchamber. A model prokaryotic organism, E. coli is gram-negative, rod-shaped, and is found in the lower intestine of warm-blooded organisms. Certain strains of E. coli are responsible for serious food poisoning in humans and pose a significant problem for food producers. Two separate rectangular chambers were made from PDMS. One of the chambers was filled with 5 μl of LB growth media as a control while the second chamber was filled with GFP-labeled E. coli in LB as shown in Figure 1, top. Prior to filling, the bacteria were grown at 37 °C for 7 h to reach exponential growth phase. Difference images of the two chambers were obtained simultaneously using SPRi for 6 h (Figures 1a, 1b, 1c, 1d, 1e, 1f) at room temperature, and were compared with fluorescence images obtained with a stereo microscope of the same areas on the sensor chip (Figures 1g, 1h).
Figure 1.

(Top) Schematic of the setup for E. coli SPRi experiments. A PDMS chip containing two microchambers is reversibly sealed against the sensor surface. (Bottom) SPR images of the blank control chamber after (a) 6 min, (c) 1 h, (e) 6 h and GFP-labeled E. coli filled chamber after (b) 6 min, (d) 1 h, and (f) 6 h. Fluorescence images of the (g) blank control and (h) GFP-labeled E. coli filled chamber surfaces. Both SPRi and micrograph images are at the same magnification. White lines have been added to the images to highlight the location of chamber side walls. Adapted from Ref. 33.
As shown in Figure 1b, after 6 min, bright spots begin to appear in the bacteria containing chamber as cells begin to attach to the surface, while the control chamber (Figure 1a) remains completely dark. Bright spots indicate a change in the refractive index of the surface over time, which, in the context of this experiment, translates to biomass accumulation and bacterial growth on the surface of the prism. After 1 h, Figure 1d shows an increase in the number of bright spots, as new cells divide and attach to the surface. The spot size also increases as an extracellular matrix is created around the adherent cells. A few bright lines appeared in the control chamber (Figure 1c). The lines correspond to features, such as scratches, on the gold. This phenomenon is observed in SPR images after a few minutes when the bulk fluid is stagnant. In this experiment, the chamber access holes were not sealed and after 6 h, the fluid in the chambers evaporated. Since air has a different index of refraction than water, images of the chamber surface became bright. The resulting surface morphology that is observed in the chambers after they were dried is quite interesting. The control chamber in Figure 1e is much smoother than the chamber containing cells (Figure 1f) where a biofilm formed on the surface. Finally, the chip was removed from the instrument, the PDMS chambers removed from the prism, and fluorescence images of the surface were taken. The surface inside the control chamber remained dark (Figure 1g) while the chamber containing cells had many fluorescent cells on the surface (Figure 1h).
Figure 1f shows that the entire surface is covered with biomass, while only a few fluorescent areas are visible in Figure 1h. There are multiple reasons why the fluorescent image in Figure 1h does not match what is observed in Figure 1f. Most notably, the extracellular matrix and dead cells do not fluoresce and hence are not visible in Figure 1h. In addition, a relatively low camera exposure time was used to obtain the images to highlight the location of live cells and minimize photo-bleaching as multiple images across the surface had to be acquired to confirm our findings. Unfortunately, the opaque gold substrate prevents transmission bright field imaging.
Next, we inoculated GFP-labeled E. coli in LB. We placed 200 μl of bacterial culture on the gold-coated prism and put a large PDMS chamber on top of it to isolate the media from the surrounding environment. The solution did not touch the PDMS chamber in these experiments. The chamber was several millimeters tall, allowing cells to move far away from the surface. The bacteria in this experiment were not incubated at 37 °C prior to loading; instead they were grown the entire time at room temperature which increased the amount of time needed to form a biofilm. Difference images taken every 3 s with SPRi let us monitor bacterial growth and biofilm formation in real time. Figures 2a, 2b, 2c, 2d show the initial biofilm formation around 7 h after the start of the experiment. We took fluorescence images (Figure 2e) of the same location on the sensor surface to confirm the SPRi results. Similar to the images shown in Figure 1, many cells died when the solution in the chamber was dried prior to fluorescence microscopy and therefore Figure 2e does not match the features shown in Figure 2d. The drying effects can be seen on the lower right portion of Figure 1e, where salt crystal dendrites have formed. The general size and shape of the fluorescent region in Figure 2e do match what was observed with SPRi.
Figure 2.

Difference images taken with SPRi at (a) 405 min; (b) 409 min; (c) 420 min; (d) 430 min are shown. The arrows are pointing at the GFP-labeled E. coli biofilm that is forming at the center of the chamber. The scale for images (a) through (d) is the same. (e) A fluorescence image of the biofilm formed on the sensor surface. The biofilm remained adhered on the surface after the chip was removed from the SPRi instrument and the PDMS chamber lifted off to allow inspection of the surface.
To confirm that the location of biofilm formation was not affected by external factors, such as impurities on the sensor surface or exposure to non-uniform light intensity, we repeated the experiment several times by placing the large PDMS chamber on different ends of the prism. We also performed the experiment with multiple gold sensor surfaces. In all experiments, the bacteria consistently gathered in the middle of the chamber. We hypothesize that the center of the hemispherically shaped droplet provides a higher concentration of available nutrients and signaling molecules for the bacteria. Control experiments without bacteria added to the chamber did not show significant contrast change after 24 h. An accelerated video showing the formation of biofilm is available in the supplementary material.34 Initially, E. coli cells in the video are moving along the entire sensor surface in the chamber. Movement ceases as bacteria become immobilized and trapped within the extracellular matrix of the biofilm on the surface of the sensor. The video is accelerated 12× so that the images acquired every 3 s are displayed for 0.25 s each. Individual pixels in the frames turn bright when bacteria swim near the sensor surface. The imaging area is 1 cm × 1 cm.
P. aeruginosa
Next, we monitored P. aeruginosa using SPRi, as this species is a model organism for investigating biofilm formation and pathogenesis.35P. aeruginosa infections are often life threatening for patients whose immune system has been compromised, like those hospitalized with severe burns, cancer, AIDS, and cystic fibrosis.36 It is the most commonly found gram-negative bacterium in hospital acquired infections, carrying a 40%–60% mortality rate.37, 38, 39, 40 The robust biofilms that P. aeruginosa forms aid significantly in its pathogenesis and a better understanding of the initial cell adhesion and biofilm formation processes will provide significant insight into strategies for preventing infections. We monitored biofilm formation of two P. aeruginosa PA14 strains, wild type and mutant pelA. A PDMS chip containing three linear chambers was placed on the sensor surface. One chamber contained no bacteria, the second chamber was filled with pelA mutant, which cannot produce a robust biofilm, and the third chamber was filled with wild type, which produces biofilm. Trypticase soy broth was used as growth media in all three chambers. The pelA gene is responsible for biosynthesis of cellulase-susceptible polysaccharide that is essential for formation of robust biofilms, but has no influence on the cellular adhesion.41
Prior to being loaded into the microchambers, the two bacterial strains were incubated at 37 °C for 5 h to initiate exponential growth. Difference images of the loaded chambers were collected for 3 h using SPRi (Figure 3), and afterwards, the sensor surface was imaged with a stereo microscope to confirm the formation of biofilm. We repeated this experiment three times and obtained consistent results. The chamber without cells remained dark (Figure 3a). Some growth was observed in the chamber containing the pelA strain (Figure 3b). The small bright spots in the image are cells that attached to the surface and began growing. Biofilm growth in the chamber with wild type cells was extensive after 3 h in this small (approximately 3 μl) fluid volume (Figure 3c).
Figure 3.
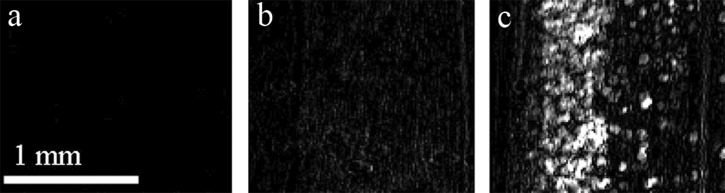
SPRi difference images of 100-μm-tall PDMS chambers after 3 h of observation. Chamber filled with (a) only trypticase soy broth, (b) pelA mutant, (c) wild type.
SEM analysis
Shown in Figure 4a is a SPRi image of P. aeruginosa PAO1 grown in a large chamber overnight at the same conditions as GFP-labeled E. coli shown in Sec. 3A. The PAO1 cells behave differently than E. coli cells. PAO1 cells initially formed a biofilm at the edges of the droplet, and only later began forming a biofilm in the center. This knowledge of biofilm assembly may potentially be exploited to identify bacterial species in unknown samples. The spots outside of the fluid region are caused by contact of the PDMS chamber with the sensor surface. They were present throughout the experiment and did not change in size or shape. After SPRi, the prism was removed from the system, the biofilm was dried, and the PDMS chamber was removed. Figure 4b is a GFP-filtered fluorescence image of the right side of the biofilm, which crystallized during the drying process. A camera exposure time of 50 ms was used, which makes the image very overexposed. A clear boundary is visible where the biofilm ends and the PDMS chamber begins. The image is the brightest directly next to the PDMS where a large amount of cells are located and the fluorescence intensity decreases when moving away from chamber wall.
Figure 4.

Images of P. aeruginosa PAO1 after being grown overnight in LB growth media. (a) SPRi image after overnight growth. The arrow on the right side of (a) points to the area that is shown in (b) and (c). The arrow in the center of (a) points to the area shown in (d). (b) GFP-filtered fluorescence image of the right side of the dried biofilm on the sensor surface. (c) SEM image of the right side of the biofilm. (d) SEM image of the center of the chamber.
Figure 4c is a SEM image of a portion of the biofilm on the right side of the chamber. The gold surface on the right side of the image, which was not exposed to bacteria, is very clean. The drying process potentially adds more cells to the surface than there were adhered in the SPRi, however, this can be distinguished partly as cells originally immobilized on the surface have extracellular matrix formed around them. The fixing process can also remove cells that are not tightly bound to the surface, thus preventing an exact comparison. The SEM image shows a biofilm geometry that is consistent with the SPRi and fluorescence microscopy images. On the left side of Figure 4c, after the cellular biofilm ends, there is biomaterial on the surface that is measured with SPRi with lower contrast than the cells at the chamber perimeter. This biomaterial is distinguishable in the SEM from the clean gold surface on the right side of Figure 4c. Figure 4d is a SEM image from the center of the chamber area where a biofilm was forming and contrast was increasing in the SPRi at the end of the experiment.
Biofilm removal
In the final set of experiments, the removal of a mature biofilm was monitored. After growing GFP-labeled E. coli cells on the sensor surface for 24 h at 37 °C, the PDMS cover was removed and bright field and fluorescence micrographs were taken to verify biofilm formation (Figure 5). Figure 6a shows the biofilm coated surface at the beginning of the experiment. Prior to growing a biofilm, images of the clean sensor surface appeared completely dark. Figures 6b, 6c, 6d show the bio-film gradually being removed from the sensor surface as deionized water is flowed. A visible biofilm remained on the surface after flowing deionized water for 11 min. Ethanol was flowed through the chamber for 5 min before the biofilm was completely removed from the surface (Figure 6e). Several solutions were then flowed over the sensor surface to validate that the dark image was the result of biofilm removal and not a change in bulk refractive index (Figure 6f). Repeated SPRi biofilm removal experiments show that the biofilm tends to be removed from the top to the bottom, beginning at the point furthest upstream in the fluid flow, instead of a uniform removal across the entire surface.26
Figure 5.

20× magnification (a) bright-field and (b) fluorescence images of the sensor surface after growing GFP-labeled E.coli cells for 24 h at 37 °C, prior to any removal steps.
Figure 6.

Difference images obtained with SPRi while flowing different fluids over the prism surface to remove the biofilm. (a) A robust biofilm is seen the beginning of the experiment. The biofilm is gradually removed from the surface when deionized water is flowed over it at 2 ml/min. Images of the surface after (b) 3.7 min, (c) 5.8 min, and (d) 7.5 min. (e) Ethanol was then flowed over the surface for 5 min, followed by a deionized water rinse. (f) No change is observed after 25 mM phosphate buffered saline (pH 7) was flowed for 8 min, followed by ethanol for 7 min, and deionized water for 5 min. Arrows indicate direction of fluid flow.
To confirm that the biofilm removal process was successful, the prism was removed from the instrument and a few droplets of LB growth media were placed on the surface. It was then incubated at 37 °C for 24 h to regrow any cells that might remain on the surface after washing. No cellular material was observed, thus confirming complete biofilm removal.
Several wash chemicals, times, and methods are reported in the literature for removing biofilms. However, the protocols for validating biofilm removal are not standardized, making it very difficult to evaluate and compare the efficacy of different approaches, and highlighting the need for a simple, robust, quantitative method.42, 43, 44
CONCLUSIONS
These experiments show for the first time that SPRi is a viable technique for real-time, label-free imaging of biofilm formation and removal on a surface. The technique provides spatial information about where cells are adhering within a chamber or channel that is not available with standard SPR. We used SPRi to image biofilms produced by two common bacterial species, E. coli and P. aeruginosa. This straightforward methodology allows researchers to begin using SPRi for high resolution large-area studies of bacteria on surfaces. This type of population level analysis of bacterial response may provide new insights for medicine, biotechnology, and ecology. Further, the gold sensing surface used in these experiments lends itself to chemical functionalization, which makes this an ideal approach for adhesion experiments. Finally, this approach complements other methods, such as confocal microscopy for studying biofilms, and is the first to offer real-time, high-resolution analysis of biofilm removal.
ACKNOWLEDGMENTS
This material is based upon work supported in part by the National Science Foundation under Grant No. 1125535 and a Northeastern University Tier 1 Interdisciplinary Research Seed Grant. The devices were made at the George J. Kostas Nanoscale Technology and Manufacturing Re-search Center at Northeastern University, which was supported through N.S.F. Award No. EEC-0832785. We thank T. A. Webster, R. Crowley, A. Brophy, and J. Vittoria for assistance.
Paper submitted as part of a special collection covering contributions related to the American Electrophoresis Society's symposium at the SciX 2013 meeting (Guest Editors: A. Ros, E.D. Goluch) held in Milwaukee, Wisconsin, September 29–October 4, 2013.
References
- Costerton J. W., J. Ind. Microbiol. 15(3), 137 (1995). 10.1007/BF01569816 [DOI] [PubMed] [Google Scholar]
- Donlan R. M., Emerging Infect. Dis. 8(9), 881 (2002). 10.3201/eid0809.020063 [DOI] [PMC free article] [PubMed] [Google Scholar]
- Gjødsbøl K., Christensen J. J., Karlsmark T., Jørgensen B., Klein B. M., and Krogfelt K. A., Int. Wound J. 3(3), 225 (2006). 10.1111/j.1742-481X.2006.00159.x [DOI] [PMC free article] [PubMed] [Google Scholar]
- James G. A., Swogger E., Wolcott R., Pulcini E. D., Secor P., Sestrich J., Costerton J. W., and Stewart P. S., Wound Repair Regen. 16(1), 37 (2008). 10.1111/j.1524-475X.2007.00321.x [DOI] [PubMed] [Google Scholar]
- Kumar C. G. and Anand S. K., Int. J. Food Microbiol. 42(1–2), 9 (1998). 10.1016/S0168-1605(98)00060-9 [DOI] [PubMed] [Google Scholar]
- Ludensky M., Int. Biodeterior. Biodegrad. 51(4), 255 (2003). 10.1016/S0964-8305(03)00038-6 [DOI] [Google Scholar]
- Romero D. and Kolter R., Trends Microbiol. 19(7), 304 (2011). 10.1016/j.tim.2011.03.003 [DOI] [PMC free article] [PubMed] [Google Scholar]
- Vertes A., Hitchins V., and Phillips K. S., Anal. Chem. 84(9), 3858 (2012). 10.1021/ac2029997 [DOI] [PubMed] [Google Scholar]
- Assmus B., Schloter M., Kirchhof G., Hutzler P., and Hartmann A., Microb. Ecol. 33(1), 32 (1997). 10.1007/s002489900005 [DOI] [PubMed] [Google Scholar]
- Ernebjerg M. and Kishony R., Appl. Environ. Microb. 78(5), 1345 (2012). 10.1128/AEM.06585-11 [DOI] [PMC free article] [PubMed] [Google Scholar]
- Federle M. J., Contrib. Microbiol. 16, 18 (2009). 10.1159/000219371 [DOI] [PMC free article] [PubMed] [Google Scholar]
- Park S., Wolanin P. M., Yuzbashyan E. A., Lin H., Darnton N. C., Stock J. B., Silberzan P., and Austin R., Proc. Natl. Acad. Sci. U.S.A. 100(24), 13910 (2003). 10.1073/pnas.1935975100 [DOI] [PMC free article] [PubMed] [Google Scholar]
- Park S., Wolanin P. M., Yuzbashyan E. A., Silberzan P., Stock J. B., and Austin R. H., Science 301, 188 (2003). 10.1126/science.1079805 [DOI] [PubMed] [Google Scholar]
- Chambless J. D., Hunt S. M., and Stewart P. S., Appl. Environ. Microb. 72(3), 2005 (2006). 10.1128/AEM.72.3.2005-2013.2006 [DOI] [PMC free article] [PubMed] [Google Scholar]
- Kjelleberg S. and Molin S., Curr. Opin. Microbiol. 5(3), 254 (2002). 10.1016/S1369-5274(02)00325-9 [DOI] [PubMed] [Google Scholar]
- Dietrich L. E., Teal T. K., Price-Whelan A., and Newman D. K., Science 321(5893), 1203 (2008). 10.1126/science.1160619 [DOI] [PMC free article] [PubMed] [Google Scholar]
- Chen X. and Stewart P. S., Water Res. 34(17), 4229 (2000). 10.1016/S0043-1354(00)00187-1 [DOI] [Google Scholar]
- Paul S., Vadgama P., and Ray A. K., IET Nanobiotechnol. 3(3), 71 (2009). 10.1049/iet-nbt.2008.0012 [DOI] [PubMed] [Google Scholar]
- Yanase Y., Hiragun T., Kaneko S., Gould H. J., Greaves M. W., and Hide M., Biosens. Bioelectron. 26(2), 674 (2010). 10.1016/j.bios.2010.06.065 [DOI] [PubMed] [Google Scholar]
- Marion-Ferey K., Pasmore M., Stoodley P., Wilson S., Husson G. P., and Costerton J. W., J. Hosp. Infect. 53(1), 64 (2003). 10.1053/jhin.2002.1320 [DOI] [PubMed] [Google Scholar]
- Biteen J. S. and Moerner W. E., “Single-molecule and superresolution imaging in live bacteria cells,” Cold Spring Harbor Perspect. Biol. 2(3), 1–14 (2010). 10.1101/cshperspect.a000448 [DOI] [PMC free article] [PubMed] [Google Scholar]
- Ferrando M. and Spiess W. E. L., Food Sci. Technol. Int. 6(4), 267 (2000). 10.1177/108201320000600402 [DOI] [Google Scholar]
- Yawata Y., Toda K., Setoyama E., Fukuda J., Suzuki H., Uchiyama H., and Nomura N., J. Biosci. Bioeng. 110(3), 377 (2010). 10.1016/j.jbiosc.2010.04.002 [DOI] [PubMed] [Google Scholar]
- Harris R. D. and Wilkinson J. S., Sens. Actuators, B 29(1–3), 261 (1995). 10.1016/0925-4005(95)01692-9 [DOI] [Google Scholar]
- Karabchevsky A., Tsapovsky L., Marks R. S., and Abdulhalim I., Proc. SPIE 8099, 809918 (2011). 10.1117/12.899617 [DOI] [Google Scholar]
- Abadian P. N., Kelley C. P., and Goluch E. D., “Cellular analysis and detection using surface plasmon resonance techniques,” Anal. Chem. (published online). 10.1021/ac500135s [DOI] [PubMed]
- Jenkins A. T. A., Ffrench-Constant R., Buckling A., Clarke D. J., and Jarvis K., Biotechnol. Prog. 20, 1233 (2004). 10.1021/bp034367u [DOI] [PubMed] [Google Scholar]
- Landrygan-Bakri J., Wilson M. J., Williams D. W., Lewis M. A. O., and Waddington R. J., Res. Microbiol. 163, 436 (2012). 10.1016/j.resmic.2012.07.006 [DOI] [PubMed] [Google Scholar]
- Pranzetti A., Salaun S., Mieszkin S., Callow M. E., Callow J. A., Preece J. A., and Mendes P. M., Adv. Funct. Mater. 22, 3672 (2012). 10.1002/adfm.201103067 [DOI] [Google Scholar]
- Bouguelia S., Roupioz Y., Slimani S., Mondani L., Casabona M. G., Durmort C., Vernet T., Calemczuk R., and Livache T., Lab Chip 13, 4024 (2013). 10.1039/c3lc50473e [DOI] [PubMed] [Google Scholar]
- Janknect P. and Melo L. F., Rev. Environ. Sci. Biotechnol. 2, 269 (2003). 10.1023/B:RESB.0000040461.69339.04 [DOI] [Google Scholar]
- Schneider W. R. and Doetsch R. N., J. Bacteriol. 117(2), 696 (1974); available at http://jb.asm.org/content/117/2/696. [DOI] [PMC free article] [PubMed] [Google Scholar]
- Abadian P. N., Tandogan N., Webster T. A., and Goluch E. D., “Real-time detection of bacterial biofilm growth using surface plasmon resonance imaging,” in Proceedings of 16th International Conference on Miniaturized Systems for Chemistry and Life Sciences, microTAS (2012), pp. 413–415.
- See supplementary material at http://dx.doi.org/10.1063/1.4867739 for a 12× accelerated SPRi video of E. coli biofilm forming on a sensor surface in a 1 cm × 1 cm area.
- Ryder C., Byrd M., and Wozniak D. J., Curr. Opin. Microbiol. 10(6), 644 (2007). 10.1016/j.mib.2007.09.010 [DOI] [PMC free article] [PubMed] [Google Scholar]
- Botzenhardt K. and Doring G., “Ecology and epidemiology of Pseudomonas aeruginosa,” in Pseudomonas aeruginosa as an Opportunistic Pathogen (Springer, 1993; ). [Google Scholar]
- Chastre J. and Fagon J.-Y., Am. J. Respir. Crit. Care Med. 165(7), 867 (2002). 10.1164/ajrccm.165.7.2105078 [DOI] [PubMed] [Google Scholar]
- Fick R. B., Pseudomonas aeruginosa: The opportunist (CRC Press, 1993). [Google Scholar]
- Gibson R. L., Burns J. L., and Ramsey B. W., Am. J. Respir. Crit. Care Med. 168(8), 918 (2003). 10.1164/rccm.200304-505SO [DOI] [PubMed] [Google Scholar]
- Van Delden C. and Iglewski B. H., Emerging Infect. Dis. 4(4), 551 (1998). 10.3201/eid0404.980405 [DOI] [PMC free article] [PubMed] [Google Scholar]
- Vasseur P., Vallet-Gely I., Soscia C., Genin S., and Filloux A., Microbiology 151(3), 985 (2005). 10.1099/mic.0.27410-0 [DOI] [PubMed] [Google Scholar]
- Desrosiers M., Myntti M., and James G., Am. J. Rhinol. 21(5), 527 (2007). 10.2500/ajr.2007.21.3069 [DOI] [PubMed] [Google Scholar]
- Fang Y., Shen Z., Li L., Cao Y., Gu L.-Y., Gu Q., Zhong X.-Q., Yu C.-H., and Li Y.-M., World J. Gastroenterol. 16, 1019 (2010). 10.3748/wjg.v16.i8.1019 [DOI] [PMC free article] [PubMed] [Google Scholar]
- Silva R. C., Carver R. A., Ojano-Dirain C. P., and Antonelli P. J., Laryngoscope 123(1), 259 (2013). 10.1002/lary.23612 [DOI] [PubMed] [Google Scholar]