Abstract
We examine a maximum-a-posteriori method for estimating the primary interaction position of gamma rays with multiple interaction sites (hits) in a monolithic detector. In assessing the performance of a multiple-hit estimator over that of a conventional one-hit estimator, we consider a few different detector and readout configurations of a 50-mm-wide square cerium-doped lutetium oxyorthosilicate block. For this study, we use simulated data from SCOUT, a Monte-Carlo tool for photon tracking and modeling scintillation- camera output. With this tool, we determine estimate bias and variance for a multiple-hit estimator and compare these with similar metrics for a one-hit maximum-likelihood estimator, which assumes full energy deposition in one hit. We also examine the effect of event filtering on these metrics; for this purpose, we use a likelihood threshold to reject signals that are not likely to have been produced under the assumed likelihood model. Depending on detector design, we observe a 1%–12% improvement of intrinsic resolution for a 1-or-2-hit estimator as compared with a 1-hit estimator. We also observe improved differentiation of photopeak events using a 1-or-2-hit estimator as compared with the 1-hit estimator; more than 6% of photopeak events that were rejected by likelihood filtering for the 1-hit estimator were accurately identified as photopeak events and positioned without loss of resolution by a 1-or-2-hit estimator; for PET, this equates to at least a 12% improvement in coincidence-detection efficiency with likelihood filtering applied.
Index Terms: Detector scatter, Gamma-ray imaging, maximum likelihood estimation, monolithic detectors, multiple-hit positioning, three-dimensional (3-D) interaction positioning
I. Introduction
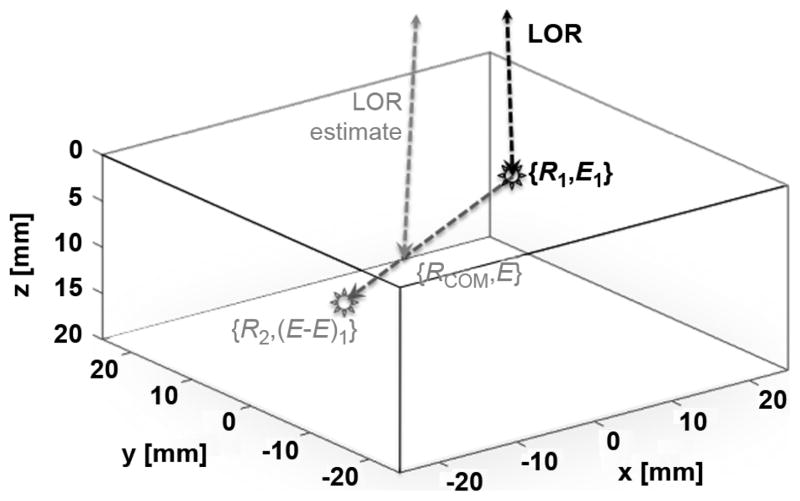
Much of single-photon and positron emission tomography (SPECT and PET) is presently done under the assumption that photons deposit all their energy in one location (hit). To the contrary, many photon-detector interactions result in scatter or secondary emission that result in multiple hits. For PET, in particular, multiple-hit interactions represent the norm. If ignored, multiple hits can blur or bias our estimate of the first-hit position (Fig. 1); for an ensemble of such events, the estimate position is blurred. Alternatively, scatter events may be filtered (e.g., based on likelihood of the observed signals under an assumed signal-probability model) at the expense of reduced detection efficiency.
Fig. 1.
Incorrect identification of the energy-weighted centroid (RCOM) of a multi-hit interaction as the primary interaction position (R1).
A gamma ray deposits its energy by one of several mechanisms; for sub-MeV photons, energy deposition occurs predominantly via photoelectric and Compton interactions. In the case of Compton scatter, the deposition of incident gamma-ray energy can occur in more than one location. The direction and energy of the scattered gamma ray distributes itself according to the Compton and Klein–Nishina equations; depending on its characteristic path length and detector geometry, a scattered photon may reinteract or escape the detector. Photons with escaped secondaries may be confused for object scatter and can be filtered by energy windowing, or as we show later, by likelihood threshold. We see from Fig. 2 that the percent of interactions without escaped secondary that result from two or more hits is 50%–60% for detector thickness ranging from 5 to 20 mm. Thus, multi-hit interactions are often the majority of photopeak events.
Fig. 2.
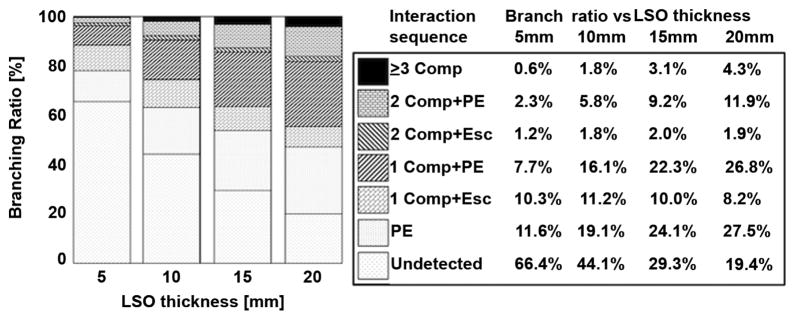
Branching ratios for 511-keV photons at normal incidence to various thicknesses of 50 × 50-mm2 Lu2SiO5 (LSO). The fraction of undetected photons is computed from NIST attenuation data. Other branching ratios were determined by Monte-Carlo simulation using 105 simulated interactions for each detector thickness. For compactness, Compton is abbreviated as Comp, escaped secondary as Esc, and photoelectric as PE.
Characteristic X-rays and Auger electrons can also play a part in secondary interactions, but the mean free path of X-rays (~ 600 μm for K-fluorescence in LSO [13]) and range of Auger electrons (often < 100 μm) are often negligible compared to detector resolution. In comparison, the mean free path of 90° Compton scatter in LSO from incident 511-keV photons is roughly 4.3 mm. Here, we consider multiple hits due to Compton scatter and the photoelectric effect only.
Noteworthy methods that do not assume single interaction sites are the Compton camera [1], [2], Bayesian methods for determining interaction sequence in a system of arrayed-crystal detectors [3], [4], and a method for determining interaction sequence by minimizing the sum of the squared difference of scatter-angle cosines [5], [6]. However, for each of these methods, signals from multiple interactions are assumed to be separable, either occurring in isolated detector blocks (i.e., Compton camera), in decoupled detector elements (i.e., discrete crystal arrays), or in well-separated regions of the detector volume.
In contrast, here we consider estimating first-hit position when multiple-hit signals are multiplexed by shared detector readouts. We are motivated to do so by our continued interest in monolithic detectors [7]. We also seek a more exact probability model for use in list mode maximum-likelihood reconstruction as discussed in [8] and [9].
II. Methods
We examine a maximum-a-posteriori (MAP) method for estimating the first-hit position and incident-photon energy for multiple-hit events. We demonstrate this method in simulation for monolithic detectors and compare estimate bias, estimate variance, and gamma detection efficiency of these methods to that of the conventional approach, which assumes full energy deposition in a single hit.
Our application of interest is PET imaging, for which coincidence photons interacting in separate detectors may each result in multiple hits. The likelihood of these PET multi-hit parameters (coordinates for one or more hits of both positron-annihilation photons) is constrained by the angular distribution of the positron-annihilation photons (nearly collinear). In contrast, multi-hit estimation in SPECT represents a simplified case of the PET estimation task; prior knowledge of the geometric collimator can be used in lieu of additional parameters for a coincident photon to constrain the incident direction.
In an unguided search for a MAP estimate, the volume of parameter space and computation time can grow rapidly with the number of parameters to be determined. However, often in PET, the distance between coincidence detectors is large enough that we can decouple parameter estimates for the two coincidence photons if we have an approximate estimate of first-hit position of the coincidence partner. For this purpose, we can use a one-hit estimate independently generated for each photon to constrain the incident direction and then improve upon this estimate by iteration of the multi-hit estimator. Thus, for the purpose of this work, we estimate the first-hit interaction position of one photon for a given interaction position of the coincident partner.
A. One-Hit Estimator
We compare results for multiple-hit estimation to results for a MAP estimator of 3-D position for a one-hit assumption. Signal centroiding (Anger estimation) is traditionally used to estimate one-hit 2-D position. However, centroiding is significantly biased near the detector periphery [8]. Here, we aim to assess the benefit of multiple-hit estimation over just the one-hit assumption.
Escaped secondaries and multiple-hit events can result in signals that are not well represented by a one-hit probability model. To reduce position bias that may result from such events, a likelihood threshold can be used to reject unlikely estimates from the one-hit maximum-likelihood (ML) estimator (Section II-F). However, any improvement to estimate variance and/or bias resulting from event filtering is at the expense of gamma-detection efficiency.
B. Two-Hit Estimator
The pertinent parameters we are considering for PET are the first-hit 3-D positions, Rj1, and the number of hits, Kj, for each of a pair of coincident photons, j ∈ {1,2}; the incident-photon energies,
 , are assumed to be fixed. All other multiple-hit parameters (hit positions beyond the first hit for either coincidence photon) we term nuisance parameters. Two methods for dealing with nuisance parameters are: A) to estimate them along with the desired parameters and then discard their result or B) to marginalize their effect on the probability model. Further information on nuisance parameters is found in [9]. Either method, A or B, can be accomplished with or without prior information for the distribution of estimate parameters.
In each case above, we begin by defining the signal- probability model for a coincidence pair of multiple-hit events, pr(G|Θ), where G = {g1, g2} are the observed signals and Θ = {θ1, θ2} are the dependent parameters; we use bold-faced characters here and throughout to denote vectors. The vector gj = {gj1, gjMj} is the set of the Mj signals for photon j. The vector θj = {
 , Kj, Rj1,…, RjKj, EjKj} is the set of dependent parameters associated with photon j. Here,
 is incident-photon energy, Kj is the number of hits, {Rj1,…,RjKj} are the 3-D hit positions, and EjKj is the deposited energy of the final hit. Energies deposited at k < Kj are constrained by the Compton Equation given θj and the incident direction ΔRj ≡ (Rj1 − Rj′1), where both and {j,j′} ∈ {1,2} and j ≠ j′ The energy incident upon the kth-hit location,
 , is thus a function of
 , ΔRj, and the preceding hit positions, {Rj1,…, Rj(k−1)}.
The probability model for a pair of coincidence photons, pr(G|Θ), can be factored as pr(g1|θ1, ΔR1)pr(g2|θ2, ΔR2), where
| (1) |
We assume here that light from each hit independently contributes to the resultant signals: ; the Dirac delta, , in (1) enforces this constraint on the integral limits. Note that the term pr(gjk|Rjk, Ejk) here is just the one-hit signal-probability model, which can be experimentally calibrated [10].
The ML estimate of Θ given G is found by maximizing
 (Θ) = pr(G|Θ). A MAP estimate of Θ is found by maximizing
 (Θ)pr(Θ), where pr(Θ) is our prior (prior knowledge of the distribution) of Θ. Our priors include the Klein–Nishina distribution, the Beer–Lambert attenuation equation, and energy-dependent cross-sections for Compton and photoelectric interactions (Section II-D). To estimate just a subset of parameters, Θkeep we can maximize the integral of either
 (Θ) or over
 (Θ)pr(Θ) over Θnuis, where Θ = {Θnuis, Θkeep}
Again, using a likelihood threshold, we can filter events such as escaped secondaries that are not likely to have been produced under the assumed probability model (Section II-F).
C. Practical Application
As a practical example of multi-hit estimation for monolithic detectors, we consider an estimator of up to two (one or two) hits per photon with no escaped secondaries (i.e., photopeak events). This choice is made as a trade-off between computational complexity (three additional search parameters per hit per photon) and the fraction of accurately modeled photopeak events (i.e., Fig. 2).
To further reduce the volume of parameter space that we search in PET, we can separate the search for the parameters of the two coincident photons; to do so, we use an initial estimate of the incident direction generated from a ML 1-hit position estimate. As is often the case, if the detector-block separation is large compared to the mean-free path length of photon scatter within a detector, the error in this initial estimate of the incidence angle will tend to be small. The incident direction and the final line-of-response estimate can then be iteratively improved after the multiple-hit estimation procedure. Subsequently, a localized simultaneous search for both coincident-photon parameters can be performed. In this work, we focus on multiple-hit parameter estimation given the incident direction.
As described in [11] and in Section II of [12], the input to photodetectors of a monolithic detector is a low-efficiency binomial-selection process. Assuming low-noise amplification and electronic readout (as we do in this simulation study), the joint probability density of the resulting output signals are well described by a multivariate scaled Poisson
| (2) |
where Nm ≡ round(gm/Am), N̄m ≡ ḡm(R, E)/Am, and Am is the mth channel gain. With this one-hit signal-probability model, the signal-probability model for a superposition of hits (1) then becomes
| (3) |
D. Prior Density: pr(Theta;)
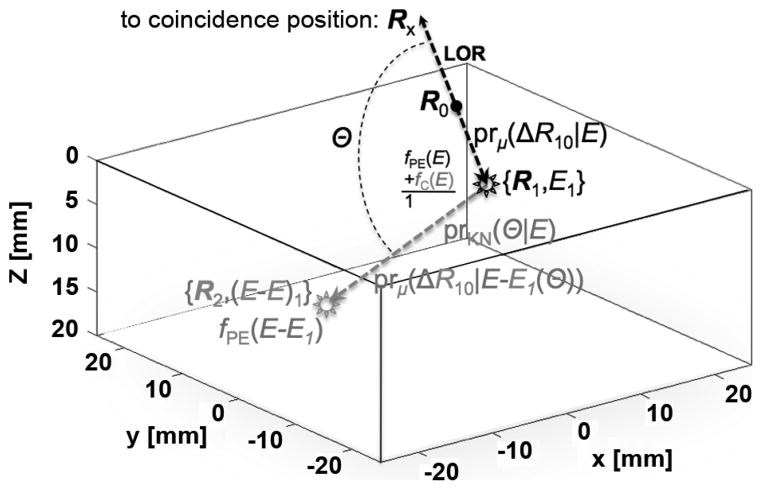
We generate a MAP estimate using knowledge of the underlying physical processes (Fig. 3). In this work, we will discretize the parameter space. So, we express the prior as a probability of the parameter falling within a small volume about a discrete coordinate (i.e., ±δVk about a discrete coordinate, Rk, for the kth hit).
Fig. 3.
Illustration of a priori densities for 1-hit and 2-hit interaction events.
For a one-hit estimator, we weight the estimate likelihood by the probability of the primary interaction voxel given the location of a coincidence event and given that an interaction has occurred (i.e., the prior is normalized over the volume of the detector). The one-hit prior distribution is thus
| (4) |
where fPE(E) is the energy-dependent photoelectric branching ratio, Prμ(ΔR10 ± δR1|E) is the integral of total attenuation at an energy E over the interval [ΔR10 − δR1, ΔR10 + δR1], Pr(hit|RX, E) is the total probability of a hit given the incident energy, E, and the coincident photon coordinate, RX. For this purpose, we use attenuation-coefficient data for LSO [13].
The prior distribution for the two-hit MAP estimate has a branching ratio of fC(E) = 1 − fPE(E) and has additional factors associated with the scatter distribution and attenuation of the second interaction. We assume here that the second interaction is photoelectric, such that the total incident energy is deposited. The two-hit prior distribution can be written as
| (5) |
where
| (6) |
and
| (7) |
The volume integral about the secondary position (7) is over a voxel (R + δV2) in spherical-polar coordinates (r, ϑ, and φ, where dω = sin(ϑ)dϑdφ). In (7), prK N(…) is the energy-dependent scatter-angle probability density (Klein–Nishina equation), prμ(…) is the total-attenuation probability density, and fPE(…) is the photoelectric cross section of the secondary. Energy of the secondary, E − E1(ϑ), is constrained by the Compton equation, E1(ϑ).
E. One-Hit or Two-Hit Classification
To accurately evaluate the signal likelihood, we attempt to classify events by their number of hits (one or two). We do so by integrating the two-hit a priori weighted likelihood over secondary parameters about the two-hit MAP estimate of the primary parameters. We then determine the a priori weighted likelihood of one-hit MAP estimate and choose the interaction sequence that is most likely.
F. Event Filtering
Events that do not conform to the assumed signal-probability model may be subject to significant estimate error. We therefore conduct event filtering by applying a threshold to the prior-weighted likelihood of estimates. A common threshold is applied to one-hit and two-hit estimates. In practice, this threshold can be selected to optimize a given imaging task. Here, we select this threshold to minimize primary-position estimate variance for the 1-hit estimator.
G. Simulation Tool and Detector Model
We use an in-house Monte-Carlo tool for modeling Scintillation Camera OUTput named SCOUT [14], which includes high-energy-photon and optical-photon tracking. For comparing multiple-hit and one-hit estimation methods, we consider a 50 × 50 mm2 monolithic scintillation detector with single-ended or double-ended readout. The readout sensors have dimensions similar to Hamamatsu H8500 and H9500 multi-anode PMTs. Table I is a summary of the detector configurations used in this work; we examine excursions of a baseline configuration to see how design parameters would affect the comparison of single-hit and multi-hit estimators.
TABLE I.
Detector Configuration Parameters Used for This Simulation Study. We Used Scintillator Light-Yield Statistics From [15], [16]. For Parameters With More Than one Value, the Underlined Quantities are the Baseline Configuration and the Second Value Represents an Excursion That we Have Examined
| Scintillator: | LSO |
| Area: | 50×50 mm2 |
| Thickness: | 10, 20 mm |
| Side treatment: | Lambertian |
| Side absorption: | 95% |
| Interface treat.: | Polished |
| Front reflector: | Lambertian |
| Readout side: | Back, Front+Back |
| Channels/face: | 8×8, 16×16 |
| Fill factor: | 90% |
| PDE: | 35%, 70% |
| Gain: | 1 |
| Gain var.: | 0 |
| Dark current: | 0 |
To calibrate the likelihood model, we measured the single-hit mean detector response as a function of the 3-D hit position. To do so, we used SCOUT to simulate 2000 photoelectric interactions at each location on a 3-D grid over the detector volume with 1-mm spacing. This calibration was repeated for each detector configuration. The resulting mean detector response function (MDRF) was smoothed (separately for each channel) using a locally fitted second-order 3-D polynomial with adaptive window size. The window width was increased from three pixels in each dimension near the peak mean response to a maximum of five pixels at an eighth of the MDRF peak. The MDRF was then interpolated at 0.2-mm-spaced grid points using a tri-cubic spline. Further interpolation is used to determine the MDRF for secondary-hit positions, which are discretized on a polar grid about the primary position.
To examine ensemble statistics (variance, bias, etc.) of the estimation methods considered, we examine primary 511-keV interactions forced to be at the detector center with a Compton-to-photoelectric branching ratio appropriate for the scintillator considered [13]. We choose to focus on interactions at the detector center since primary interactions that occur near the boundary of the detector (e.g., front, back, or sides) have a greater chance of an escaped secondary. We compare estimator performance using an ensemble of 40 000 511-keV photons for detector configuration at normal angle of incidence.
H. MAP Estimate Search Strategy
To find parameters for a MAP estimate, we use a contracting grid search algorithm devised by Furenlid et al. [17]. A 3-D search is performed for the one-hit estimator. For the two-hit estimator, we also perform a 3-D contracting-grid of the primary hit position. However, at each primary test position, we determine the MAP likelihood of the secondary position for the given primary position using a nested 3-D contracting grid search. After finding the best secondary position for each primary position at one scale, we then contract the primary test grid about this current best point.
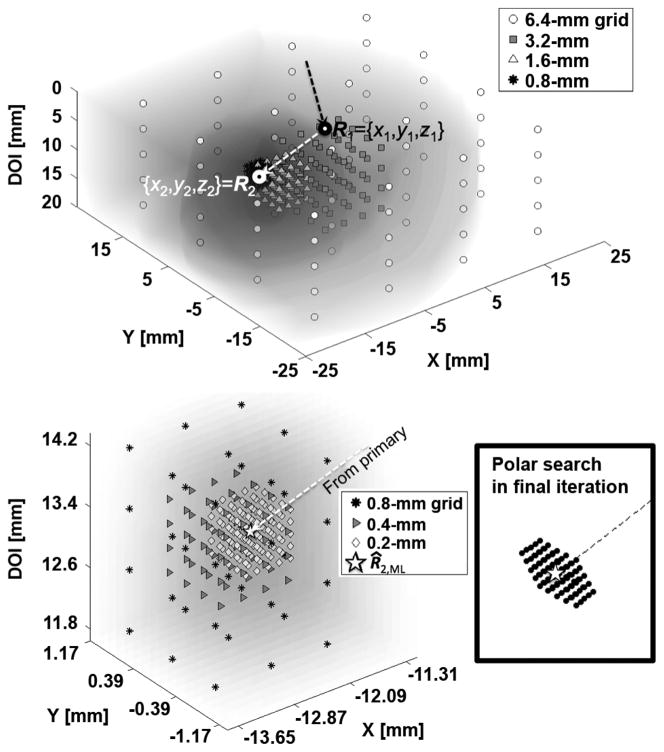
Fig. 4 shows a contracting grid search for the maximum likelihood of the secondary position for a given primary position. The first (coarsest) grid of test points uniformly spans all possible secondary position. The grid of test points at successive scales center about the maximum likelihood position of the previous scale. This Cartesian search grid is contracted 6 times to a final grid spacing of 0.2 mm; 4 × 4 × 4 test points are examined in each of the first five grid scales. A 5 × 5 × 5 test grid is examined at the finest Cartesian grid scale. Cartesian test points are rounded to the nearest polar grid point (with respect to the primary position) and the prior-weighted likelihood is integrated over a polar voxel. After these six contracting Cartesian searches, a final 5 × 5 × 5 array of test points on a polar grid relative to the primary test position is then examined to avoid precision errors upon coordinate conversion. To find the maximum-likelihood two-hit coordinates, this secondary-position-search process is then repeated over a contracting Cartesian array of test points for the primary position.
Fig. 4.
Contracting grid search for the maximum likelihood of the secondary position for a given primary position. The upper figure shows the Cartesian search pattern at four consecutively finer scales. The lower-left figure is a magnified view of the contracting grid search about the fifth and sixth scales and of the resulting maximum-likelihood estimate of the secondary position for given primary position, R̂2.M L. The lower-right figure illustrates a final array of test points on a polar grid relative to the primary position. To find the maximum-likelihood two-hit coordinates, this secondary-position-search process is then repeated over a contracting Cartesian array of test points for the primary position.
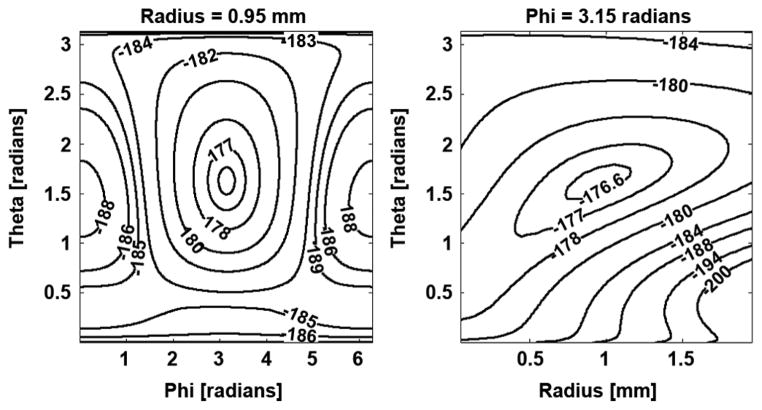
Prior-weighted likelihood functions we have examined appear to be smoothly varying with a well-defined global maximum (Fig. 5). Occasionally, for low-probability events, small local maxima can appear at the boundary of the explored parameter space due to larger signal variance in this region. However these regions do not appear to attract significant attention by this multi-scaled search method. Of 10 K randomly sampled events, the contracting-grid search yielded nearly the same solution as an exhaustive search; a mean error of 0.05 pixels was observed for the 10 K events (Fig. 6).
Fig. 5.
Polar cross sections of log likelihood through the MAP second-hit estimate for fixed first-hit position.
Fig. 6.
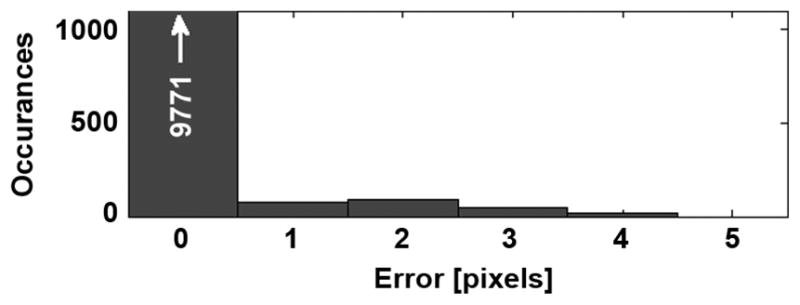
Distribution of contracting-grid estimate error compared with exhaustive search. This error is mitigated by expanding the number of search points in the last iteration from 4–5 pixels wide in each dimension.
III. Results
The process of 1-hit versus 2-hit event classification for the multi-hit estimator is depicted in Fig. 7 for one of the detector configurations considered (10 mm thick, with 8 × 8 back-side photodetectors, and 35% PDE). Events with escaped secondaries are well distinguished from nonescape events. Multiple hit events with larger displacement orthogonal to the incident direction tend towards smaller 1-hit MAP log-likelihood, making them easier to classify them as multiple-hit events. In the zoomed view to the right in Fig. 7 are the photopeak events, including all photoelectric events; here we observe the impact of signal variance on our ability to classify interaction type. The accuracy of this event classification for each of the detector configurations considered is summarized in Table II. We observe better classification accuracy of all event types with improved PDE and use of dual-sided readout. We also see better 1-hit classification for a thinner detector.
Fig. 7.
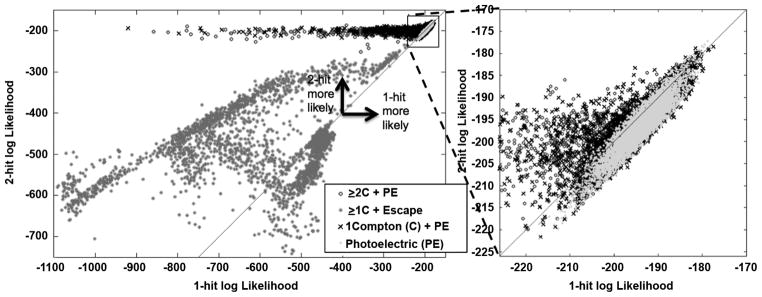
Scatter plot of 1-hit versus 2-hit MAP log-likelihood for an ensemble of 40 000 normally incident 511-keV gammas with primary interaction at the middle of a 10-mm-thick LSO scintillator with back-face readout using 8 × 8 photodetectors with 35% photodetection efficiency.
TABLE II.
Classification Aaccuracy. The Following Definitions Apply Here
Λ1 ≡ log(1-hit MAP likelihood);
Λ2 ≡ log (1-or-2-hit MAP likelihood);
#C ≡ Number of Compton scatters;
PE ≡ final photoelectric interaction
| PD array type | B8×8 | B8×8 | B16×16 | F8×8+B8×8 | B8×8 |
|---|---|---|---|---|---|
| PD Efficiency [%] | 35 | 35 | 35 | 35 | 70 |
| Thickness [mm] | 20 | 10 | 20 | 20 | 20 |
| Pr(Λ1>Λ2 | OC+PE) | 74% | 84% | 73% | 77% | 81% |
| Pr(Λ2>Λ1 | 1C+PE) | 55% | 54% | 56% | 64% | 70% |
| Pr(Λ2>Λ1 | >1C+PE) | 72% | 75% | 75% | 85% | 92% |
Use of a likelihood threshold and its relation to the deposited energy and interaction type are shown in Figs. 8 and 9. Here, we constrain the likelihood threshold to be below the peak-likelihood distribution and select a value that minimizes primary-position estimate variance for the 1-hit estimator. The likelihood threshold used for the 1-hit estimates is also applied to the multi-hit-estimate likelihood distribution. In Fig. 9, we observe a better ability to distinguish multiple-hit events from escape events for the multi-hit estimator than we do for the 1-hit estimator in Fig. 8.
Fig. 8.
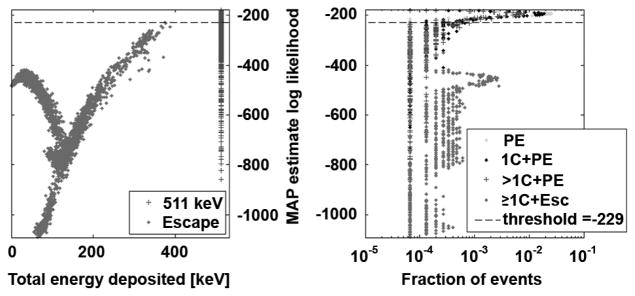
Log-likelihood-threshold filtering for 1-hit estimator: (left) scatter plot of event likelihood versus deposited energy, and (right) histogram of log- likelihood values MAP estimates for all 40 K events. Results here are shown for the detector configuration with 8 × 8 photodetectors on the back face, 35% PDE, and 10 mm LSO thickness.
Fig. 9.
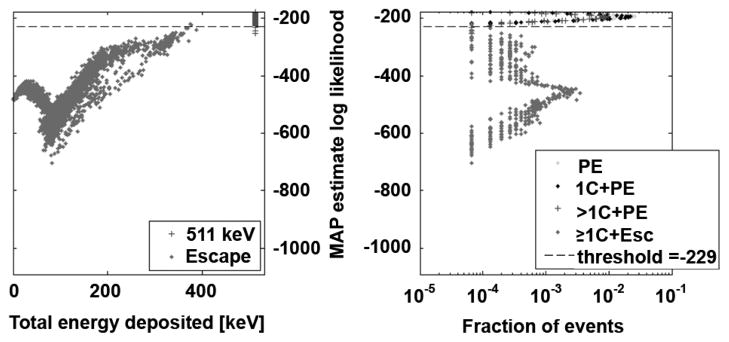
Log-likelihood-threshold filtering for 1-or-2-hit estimator. The same threshold is applied as for the 1-hit distribution.
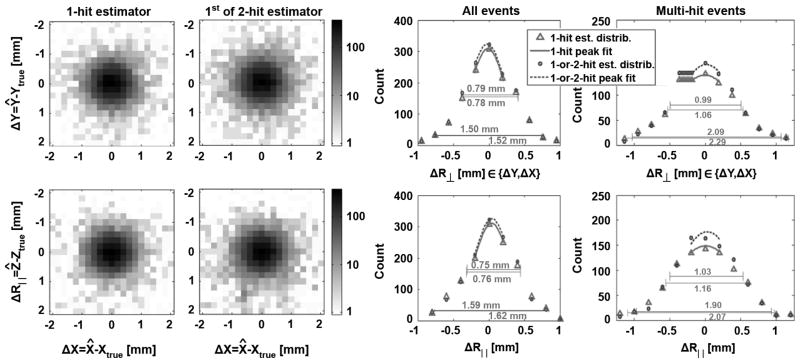
Cross-sectional views of the 3-D position-estimate error for the primary interaction are given for two detector configurations in Figs. 10 and 11. X and Y directions of the lateral distribution (termed ΔR⊥) were averaged. By contrast, the depth or Z direction is termed ΔR||. In these figures we also show the 1-D profiles for just events with more than one hit; this result permits us to assess the differences in multi-hit estimator performance for other scintillators with different branching ratios (e.g., LaBr3 or BGO). In Tables III and IV, we give a summary of the estimate resolution (FWHM and FWTM) and estimate bias for the first-hit 3-D-position estimate for each of the detector configurations considered. Table III is for all likelihood-qualified interactions; Table IV is for just multi-hit interactions.
Fig. 10.
(Top) lateral cross-section and (bottom) transverse cross-sections of 3-D histograms for the first-hit position estimates of 40 000 events for a detector with 8 × 8 photodetectors on the back face, 35% PDE, and 20-mm LSO thickness. Two-dimensional cross sections of estimate-error distribution are shown for 1-hit estimator and 1-or-2-hit estimator to the left. To the right is shown the 1-D profile for all likelihood-qualified event and for just those likelihood-qualified events that are multi-hit events.
Fig. 11.
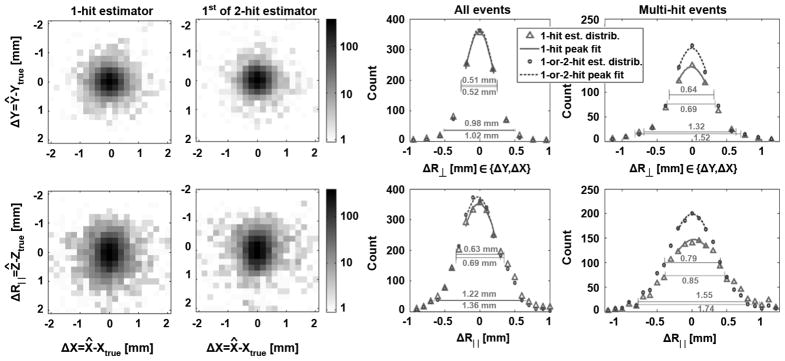
Comparable results to Fig. 10 for a detector configuration with 8 × 8 photodetectors on the back face, 35% PDE, and 10 mm LSO thickness.
TABLE III.
Estimated Resolution and Bias for Both the Multi-Hit and One-Hit Estimators. Metrics are Given for two Directions: Parallel (||) and Perpendicular (⊥) to the Incident Direction. Results for the 1-or-2-hit Estimator are Bolded and Those for the 1-hit Estimator are the Nonbolded Values
| Array Type | PDE [%] | Thick [mm] | FWHM⊥ [mm] for estimator: | FWHM|| [mm] for estimator: | FHTM⊥ [mm] for estimator: | FWTM|| [mm] for estimator: | Bias⊥ [mm] for estimator: | Bias|| [mm] for estimator: | Filter loss [% photopk events] | |||||||
|---|---|---|---|---|---|---|---|---|---|---|---|---|---|---|---|---|
| 1-hit | multi-hit | 1-hit | multi-hit | 1-hit | multi-hit | 1-hit | multi-hit | 1-hit | multi-hit | 1-hit | multi-hit | 1-hit | multi-hit | |||
| B8×8 | 35 | 20 | 0.78 | 0.79 | 0.76 | 0.75 | 1.52 | 1.50 | 1.62 | 1.59 | −0.008 | −0.003 | +0.64 | +0.43 | 7.1% | 0.0% |
| B8×8 | 35 | 10 | 0.52 | 0.51 | 0.69 | 0.63 | 1.02 | 0.98 | 1.36 | 1.22 | +0.001 | −0.005 | +0.17 | +0.19 | 6.3% | 0.0% |
| B16×16 | 35 | 20 | 0.70 | 0.65 | 0.73 | 0.67 | 1.49 | 1.43 | 1.60 | 1.57 | +0.005 | +0.002 | +0.63 | +0.44 | 6.8% | 0.0% |
| F8×8 & B8×8 | 35 | 20 | 0.54 | 0.52 | 0.53 | 0.51 | 1.06 | 1.02 | 1.02 | 0.99 | −0.012 | −0.014 | +0.64 | +0.34 | 6.5% | 0.0% |
| B8×8 | 70 | 10 | 0.39 | 0.35 | 0.59 | 0.52 | 0.70 | 0.68 | 0.94 | 0.88 | +0.005 | −0.005 | +0.60 | +0.39 | 6.2% | 0.0% |
TABLE IV.
Similar Results as Reported in Table III for Interaction That are Truly Just Multi-Hit Events
| Array Type | PDE [%] | Thick [mm] | FWHM⊥ [mm] for estimator: | FWHM|| [mm] for estimator: | FHTM⊥ [mm] for estimator: | FWTM|| [mm] for estimator: | Bias⊥ [mm] for estimator: | Bias|| [mm] for estimator: | Filter loss [% photopk events] | ||||||||
|---|---|---|---|---|---|---|---|---|---|---|---|---|---|---|---|---|---|
| 1-hit | multi-hit | 1-hit | multi-hit | 1-hit | multi-hit | 1-hit | multi-hit | 1-hit | multi-hit | 1-hit | multi-hit | 1-hit | multi-hit | ||||
| B8×8 | 35 | 20 | 1.06 | 0.99 | 1.16 | 1.03 | 2.29 | 2.09 | 2.07 | 1.90 | −0.007 | −0.004 | +0.98 | +0.61 | 13.8% | 0.0% | |
| B8×8 | 35 | 10 | 0.69 | 0.64 | 0.85 | 0.79 | 1.52 | 1.32 | 1.74 | 1.55 | +0.000 | −0.005 | +0.24 | +0.25 | 10.6% | 0.0% | |
| B16×16 | 35 | 20 | 0.94 | 0.82 | 1.10 | 0.93 | 2.22 | 1.99 | 2.04 | 1.90 | +0.002 | 0.002 | +0.89 | +0.59 | 13.3% | 0.0% | |
| F8×8 & B8×8 | 35 | 20 | 0.75 | 0.66 | 0.80 | 0.70 | 1.57 | 1.40 | 1.30 | 1.21 | −0.008 | −0.007 | +0.91 | +0.50 | 12.9% | 0.0% | |
| B8×8 | 70 | 10 | 0.51 | 0.42 | 0.74 | 0.63 | 1.03 | 0.92 | 1.21 | 1.14 | +0.001 | −0.009 | +0.83 | +0.52 | 10.2% | 0.0% | |
For both estimators, we filter unlikely events using a threshold on estimate prior-weighted likelihood, which is set as described in Section II-F and in Figs. 8 and 9. Results are shown for normal-incidence (0°) 511-k eV photons with primary interaction at the 3-D center of the detector block for each detector configuration. Preliminary results for 45° incidence angle indicate FWHM and FWTM values are roughly equal in the || and ⊥ directions and are also equal to the geometric average of the || and ⊥ values for the normal-incidence case. Estimate bias for 45° incidence angle is roughly the same as for normal incidence in both || and ⊥ directions. In order to quantify the uncertainty of our results, we also conducted ten trials for the 20-mm-thick, 35% PDE, and B8 × 8 case; here, we find a 1-sigma uncertainty of 0.004 mm for FWHM, 0.009 mm for FWTM and 0.003 mm for bias.
IV. Discussion
We have demonstrated a MAP method of multiple-hit estimation in a monolithic detector. We estimated 1-hit parameters and also jointly estimated 2-hit parameters by maximizing the prior-weighted likelihood. We then classified events as one-hit or two-hit events by MAP comparison. We used likelihood windowing to filter unaccounted event sequences (i.e., escaped secondaries). The performance of this multi-hit (1-or-2 hit) estimator was then compared to that of 1-hit ML estimator.
Slight improvement of primary-position resolution (1%–12% reduction in detector FWHM) for the multi-hit estimator is observed compared to that of the one-hit estimator. More modest improvement of contrast (2%–14% reduction in detector FWTM) is observed. Improvements to FWHM and FWTM are more substantial for events that are in fact multi-hit interactions (7%–20%).
The relative error of multi-hit versus 1-hit estimates was most affected by improving signal-to-noise and less so by photodetector spacing, dual-sided readout, and decreasing detector thickness (in that order). Signal-to-noise ratio (SNR) can be improved with better photodetection efficiency (as was simulated) or with brighter more-proportional scintillators; while a two fold increase in PDE may not be likely, a combination of increased PDE and proportional scintillator light output may achieve the same SNR improvement. The above results suggest that the precision of the multi-hit estimator is most affected by our ability to disentangle the energies for a multiple-hit event. In contrast, variations of the crystal and photodetector geometry that significantly improved position resolution of the 1-hit estimator made only about the same impact on the multi-hit-estimator position resolution (rather than being synergistic).
For this study, we chose to focus on interactions at the detector center since primary interactions that occur near the boundary of the detector (e.g., front, back, or sides) have a greater chance of an escaped secondary; as we show in Figs. 7–9, both the one-hit and multi-hit estimators, which assume full energy deposition, can easily distinguish such events based on their likelihood. Since we cannot distinguish detector scatter from object scatter, we would reject these events by likelihood threshold. Thus, near detector boundaries, there would be fewer multi-hit interactions and the average performance of one-hit and multi-hit estimators would be more equivalent. For a similar reason, the fraction of nonescape events that are multi-hit events for lower incident photon energies (e.g., in SPECT) would also decrease the performance difference between the 1-hit and multi-hit estimators.
Little bias is observed perpendicular to the incident direction either for 1 or 2 hit estimates. There is significant bias in the direction parallel to the incident direction, which is reduced by the 1-or-2-hit estimator relative to the 1-hit estimator. However, this type of bias does not cause parallax, but may slightly skew timing estimates.
The likelihood of 1-or-2-hit estimates is well separated from escape events, in contrast to the 1-hit estimates. About 6%–7% of photopeak events were rejected for the 1-hit estimator. This equates to a 12%–14% improvement in overall sensitivity for coincidence events in LSO. For coincidence events involving only multi-hit interactions, the improvement of the multi-hit estimator in coincidence sensitivity is 19%–26%. Sensitivity improvement of the multi-hit estimator will thus be more substantial in less dense crystals such as LaBr3.
Improvements by the multi-hit estimator come at the expense of increased processing needs. Computational requirements for the 1-or-2-hit estimator are nearly 500-fold greater than the 1- hit estimator. However, recent improvements in processor technologies (e.g., GPU) make this level of processing feasible for real-time applications. The added complexity of a multi-hit estimator may be worthwhile for applications that are photon starved and for which Compton scatter is a dominant interaction type. PET studies which require very limited dose, such as preclinical neuroimaging, is one example.
In conclusion, we find in LSO only slight gains in detector resolution (1%–12%) and coincidence-detection efficiency (12%–14%) by the multi-hit estimator relative to the 1-hit estimator. This improvement can be a bit more for less dense scintillators such as LaBr3 and a bit less for more dense scintillators such as BGO. For conventional image-reconstruction methods, where position estimates are first binned, we may realize more significant gains in image resolution and sensitivity by improving detector SNR (via increased proportional scintillator yield and improved photodetection efficiency) and increasing detector thickness.
However, even without significant improvement in detector resolution, an area where improved likelihood modeling may be of importance is in listmode maximum-likelihood expectation-maximization (LMMLEM) reconstruction [8]. With an accurate model of the detector blur, LMMLEM reconstruction may significantly reduce image distortion and improve spatial resolution over conventional binned-estimate MLEM reconstruction [9]. For this purpose, more accurate (unbiased and efficient) position estimates may permit better resolution recovery in the reconstruction step. Thus, an accurate PDF of the first-hit position for multi-hit events may yet lead to significant resolution and bias improvements in an LMMLEM reconstructed image. Testing this hypothesis is beyond the scope of this paper and remains as future work.
Acknowledgments
This work was supported in part by the National Institute of Biomedical Imaging and Bioengineering (NIBIB) under Grant EB002117 and Grant EB002035, in part by the National Cancer Institute (NCI) under Grant CA136569 and Grant CA134855, and in part by the Department of Energy (DOE) under Grant DE-FG02-05ER15709.
Contributor Information
William C. J. Hunter, Email: wcjh@uw.edu, Department of Radiology, University of Washington, Seattle, WA 98105 USA.
Harrison H. Barrett, Email: barrett@radiology.arizona.edu, Department of Radiology, the College of Optical Sciences, the Applied Mathematics Program, and the Biomedical Engineering Program, University of Arizona, Tucson, AZ 85721 USA.
Tom K. Lewellen, Email: tkldog@uw.edu, Departments of Radiology and Electrical Engineering, University of Washington, Seattle, WA 98105 USA.
Robert S. Miyaoka, Email: rmiyaoka@uw.edu, Department of Radiology, University of Washington, Seattle, WA 98105 USA.
References
- 1.Schönfelder V, Hirner A, Schneider K. A telescope for soft gamma ray astronomy. Nucl Instrum Meth. 1973;107:385–394. [Google Scholar]
- 2.Singh M. An electronically collimated gamma camera for single photon emission computed tomography. Part I: Theoretical considerations and design criteria. Med Phys. 1983;10:421–427. doi: 10.1118/1.595313. [DOI] [PubMed] [Google Scholar]
- 3.ChampleyK M, Lewellen TK, MacDonald LR, Miyaoka RS, Kinahan PE. Statistical LOR estimation for a high-resolution dMiCE PET detector. Phys Med Biol. 2009;54:6369–6382. doi: 10.1088/0031-9155/54/20/022. [DOI] [PMC free article] [PubMed] [Google Scholar]
- 4.Pratx G, Levin CS. Bayesian reconstruction of photon interaction sequences for high-resolution PET detectors. Phys Med Biol. 2009;54:5073–5094. doi: 10.1088/0031-9155/54/17/001. [DOI] [PMC free article] [PubMed] [Google Scholar]
- 5.Oberlack UG, Aprile E, Curioni A, Egorov V, Giboni KL. Compton scattering sequence reconstruction algorithm for the liquid xenon gamma-ray imaging telescope (LXeGRIT) Proc SPIE. 2000;4141:168–177. [Google Scholar]
- 6.Boggs S, Jean P. Event reconstruction in high resolution Compton telescopes. Astron Astrophys. 2000;145:311–321. [Google Scholar]
- 7.Miyaoka RS, Li X, Lockhart C, Lewellen TK. Comparison of detector intrinsic spatial resolution characteristics for sensor on the entrance surface and conventional readout designs. IEEE Trans Nucl Sci. 2010 Jun;57(3):990–997. doi: 10.1109/TNS.2010.2046675. [DOI] [PMC free article] [PubMed] [Google Scholar]
- 8.Barrett HH, Hunter WCJ, Miller BW, Moore SK, Chen Y, Furenlid LR. Maximum-likelihood methods for processing signals from gamma-ray detectors. IEEE Trans Nucl Sci. 2009 Jun;56(3):725–735. doi: 10.1109/tns.2009.2015308. [DOI] [PMC free article] [PubMed] [Google Scholar]
- 9.Caucci L, Furenlid LR, Barrett HH. Maximum likelihood event estimation and list-mode image reconstruction on GPU hardware. IEEE Nucl Sci Symp Conf Rec. 2009:4072–4076. doi: 10.1109/NSSMIC.2009.5402392. [DOI] [PMC free article] [PubMed] [Google Scholar]
- 10.Barrett HH, Myers KJ. Foundations of Image Science. New York: Wiley-Interscience; 2004. [Google Scholar]
- 11.Hunter WCJ. PhD degree. Univ. Arizona; Tucson: 2007. Modeling stochastic processes in Gamma-Ray imaging detectors and evaluation of multi-anode PMT scintillation camera for use with maximum-likelihood estimation methods. [Google Scholar]
- 12.Hunter WCJ, Barrett HH, Furenlid LR. Calibration method for ML estimation of 3-D interaction position in a thick gamma-ray detector. IEEE Trans Nucl Sci. 2009;56:189–196. doi: 10.1109/TNS.2008.2010704. [DOI] [PMC free article] [PubMed] [Google Scholar]
- 13.Hubbell JH, Seltzer SM. Tech Rep NISTIR 5632. Nat. Inst. Standards Technol; Gaithersburg, MD: 2004. Tables of X-ray mass attenuation coefficients and mass energy-absorption coefficients (Version 1.4) Technical Report NISTIR 5632. [Google Scholar]
- 14.Hunter WCJ, Barrett HH, Lewellen TK, Miyaoka RS, Muzi JP, Li X, McDougald W, MacDonald LR. SCOUT: A Fast Monte- Carlo Modeling Tool of Scintillation Camera Output. IEEE Nucl. Sci. Symp. Conf. Rec.; Knoxville, TN. Nov. 6, 201; pp. 1203–1208. [DOI] [PMC free article] [PubMed] [Google Scholar]
- 15.Rooney BD, Valentine ND. Scintillator light yield nonproportionality: Calculating photon response using measured electron response. IEEE Trans Nucl Sci. 1997;44:509–516. [Google Scholar]
- 16.Valentine JD, Rooney BD, Li J. The light yield nonproportionality component of scintillator energy resolution. IEEE Trans Nucl Sci. 1998 Jun;45(3):512–517. [Google Scholar]
- 17.Furenlid LR, Hesterman JY, Chen Y-C, Barrett HH. Real-time data acquisition and maximum-likelihood estimation for gamma cameras. IEEE Trans Nucl Sci, 14th IEEE-NPSS. 2005:498–501. doi: 10.1109/RTC.2005.1547506. [DOI] [PMC free article] [PubMed] [Google Scholar]


