Abstract
The way in which bacterial communities colonize flow in porous media is of importance, but basic knowledge on the dynamic of these phenomena is still missing. The aim of this work is to develop microfluidic experiments in order to progress in the understanding of bacteria capture in filters and membranes. PDMS microfluidic devices mimicking filtration processes have been developed to allow a direct dynamic observation of bacteria across 10 or 20 μm width microchannels. When filtered in such devices, bacteria behave surprisingly: Escherichia coli, Pseudomonas aeruginosa or Staphylococcus aureus accumulate in the downstream zone of the filter and form large streamers which oscillate in the flow. In this study, streamer formation is put in evidence for bacteria suspension in non nutritive conditions in less than 1 h. This result is totally different from the one observed in same system with “inert” particles or dead bacteria which are captured in the bottleneck zone and are accumulated in the upstream zone. Observations within different flow geometries (straight channels, connected channels, and staggered row pillars) show that the bacteria streamer development is influenced by the flow configuration and, particularly by the presence of tortuosity within the microchannels zone. These results are discussed at the light of 3D flow simulations. In confined systems and in laminar flow, there is secondary flow (z-velocities) superimposed to the streamwise motion (in xy plane). The presence of the secondary flow in the microsystems has an effect on the bacterial adhesion. A scenario in three steps is established to describe the formation of the streamers and to explain the positive effect of tortuous flow on the development kinetics.
INTRODUCTION
Because of their ability to attach to surfaces, bacteria often form biofilms: complex assemblies of packed bacteria bound by biopolymers and linked to surfaces. These biofilms are different compared to planktonic (free-floating) bacteria and exhibit a much higher resistance to antibiotics (Nguyen et al., 2011), a specific metabolic activity and generally present significant resistance against external stresses (Flemming and Wingender, 2010). According to applications, these biofilms can play a positive role by participating in the removal of organics in waste-water treatment (bioremediation) or of carbon dioxide (CO2 sequestration). However, they can also have the undesirable effect of increasing the risk of infection in industrial processes or medical devices when biofilms colonize and clog flow systems. For instance, when producing drinking water with membrane processes, the bacteria retention by the membrane must be maximized (Lebleu et al., 2009), while the formation of biofilm on the membrane surface has to be avoided (Li and Chu, 2003).
In these applications, porous media (exhibiting high surface to volume ratio) provide an appropriate environment for the attachment of bacteria and formation of biofilms. The biofilm formation is generally described in 5 steps: transport; reversible adhesion; irreversible adhesion; maturation and cellular detachment. Biophysical aspects of the different steps of the biofilm formation in porous media are still unclear: many parameters can influence the steps of adhesion and three-dimensional structure of the biofilm including physico-chemical and hydrodynamic environment. Bacterial adhesion and biofilm formation have been proved sensitive to numerous physico-chemical factors: the bacteria cell type (Gannon et al., 1991 and van Loosdrecht et al., 1987), their physiology and surface properties with the presence of extracellular polymeric substances (Burks et al., 2003), their motility (de Kerchove and Elimelech, 2008), the wall surface hydrophobicity (Schäfer et al., 1998). The aqueous solution in which bacteria are dispersed (ionic strength, pH) can also induce changes in the bacterial wall (Gaboriaud et al., 2008) thus influencing the capture of bacteria in porous media (Jewett et al., 1995 and Torkzaban et al., 2008). The impact of the fluid flow has been studied for different flow configurations such as stagnation points and packed bed (Burks et al., 2003; Liu and Li, 2008; and Walker et al., 2004). Yazdi and Ardekani (2012) have shown that a vertical flow of an oscillating bubble can play an important role in Escherichia coli collection and eventually triggers the formation of streamers. These studies emphasize the coupling of hydrodynamic and surface interaction on the first step of adhesion.
Depending on these conditions, bacteria can form biofilms with various architectures and microbial activities: the biofilm can form mushroom-like structures on a plane surface but also in some cases filamentous structures called streamers (Stoodley et al., 1999). The latter appears in flow of bacteria suspension with the characteristic “head” (attached to the surface) and “tail” (oscillating in the flow). Often, these streamers are induced by strong streams and their associated turbulence. In industrial applications, bacterial streamers are found between the spacers in nanofiltration and reverse osmosis (Ngene et al., 2010 and Vrouwenvelder et al., 2009).
Recent studies have shown how such bacterial streamers can form zig-zag microchannels in laminar conditions with a different angle of curvature (Rusconi et al., 2010). These authors show that hydrodynamics can play an important role in the development of these streamers and link the formation of streamers in zig-zag microchannels (200 μm * 200 μm) to the presence of secondary flow (Rusconi et al., 2011). Using microfabricated porous media, it has been demonstrated that the streamer's formation is strongly correlated to hydrodynamics and acts as a precursor to mature biofilm structure (Valiei et al., 2012). These streamers progressively bridge the spaces between obstacles in nonuniform flow and induce bio-accumulation (Drescher et al., 2013). It has been shown (Marty et al., 2012) that these bacterial streamers form in microfluidic arrays of microchannels of a size varying from 5 to 20 μm with E. Coli suspensions even in nonnutritive conditions. The streamer formation is relatively rapid: a 200 μm long streamer is observed in 1 h.
The aim of this work is to acquire an in-depth understanding of the biofilm streamer development in microfluidics porous media and to investigate the impact of hydrodynamics. In Sec. 2, the effect of hydrodynamics on streamer formation is analysed in the light of numerical flow simulation to link the streamer formation to the local properties of the flow.
MATERIALS AND METHODS
The experiments were performed with transparent polydimethysiloxane (PDMS) micro-separators that mimic transport in porous media or in filtration systems. Bacterial suspensions were filtered through these devices. Direct observation by digital video microscopy of bacterial accumulation in micro-channels allowed bacterial capture to be studied while altering the micro-channel geometries and the hydrodynamic conditions. Images were then analyzed to quantify the efficiency of the capture of bacteria by the microfiltration system.
Characteristics of the PDMS micro-separator
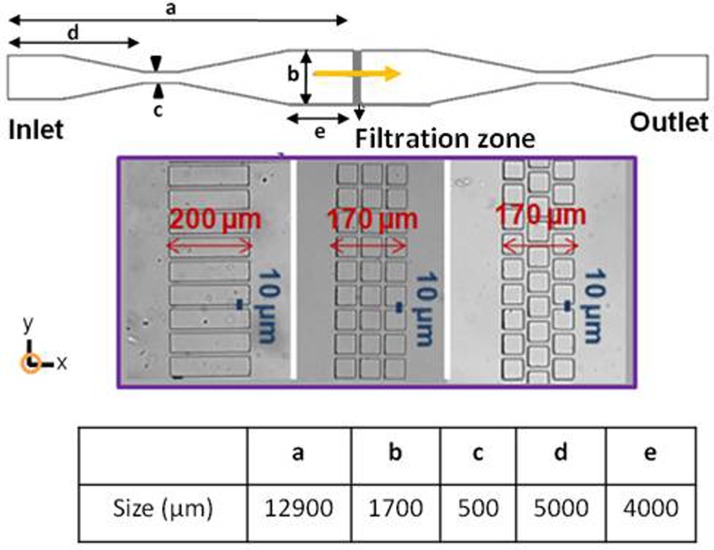
PDMS micro-separators were designed to mimic filtration in the dead-end mode: one inlet (the feed) and one outlet (the filtrate). A sketch of the PDMS dead-end filtration micro-separators is shown in Figure 1. The dimensions are detailed in the figure caption. In these systems, the filtering part of the device consisted of a parallel arrangement of 25 micro-channels with a width of 10 or 20 μm. Different kinds of micro-channel geometry (straight, interconnected, or staggered) reproduced the various flow conditions that can be encountered during filtration. The depth (along z direction) of all the channels in the network was 50 μm.
Figure 1.
Sketch of the PDMS micro-separators working in dead-end mode. The dimensions of the two micro-separators were: (a) 12.90 mm; (b) 1.70 mm; (c) 0.50 mm; (d) 11 mm; (e) 5 mm; (f) 4 mm. The inset details the filtration zone with different micro-channel geometries: straight, connected and staggered (from left to right). The microchannels width is equal to 10 μm.
These devices were made by the soft lithography technique (Mc Donald et al., 2000). The techniques of PDMS micro-separator preparation and the main surface properties of PDMS are reported in Bacchin et al. (2011).
Bacteria suspension
E. coli strain CIP 54.127 was obtained from the Institute Pasteur collection (Paris, France). Cells were grown aerobically on complex medium (tryptone soy agar, Biomérieux) incubated at 37 °C for 24 h (stationary phase). For inoculum preparation, isolated colonies were suspended in sterile physiological saline (NaCl 9 g l−1), i.e., in non-nutritive conditions. The suspension concentration was adjusted to approximately 108 cells ml−1 by optical density at 640 nm (OD640 ranged from 0.11 to 0.15). Other bacteria strains Pseudomonas aeruginosa CIP 82118 and Staphylococcus aureus CIP 4.83 have been used following the same protocol.
Cell filtration and microscopic observation
The bacterial suspensions were filtered through the PDMS micro-separators with a constant filtration flow rate (1.41 ml h−1) using a syringe pump (PHD 22/2000, Harvard Apparatus). Before filtration, the micro-separators were rinsed with sterile physiological saline. The flows in the micro-channels and in the other zones of the micro-separator were laminar. In a micro-channel, the average velocity (the interstitial velocity) was 15.7 mm s−1 (Re = 0.45), while in the feed channel, the average velocity (the superficial velocity) was 4.53 mm s−1 (Re = 0.44). The characteristic length used for the calculation of the Reynolds number was the hydraulic diameter of the channel. These superficial filtration velocities (approx. 16 m · h−1) are in the range of the ones used in membrane microfiltration (until 50 m · h−1-data for a MF-Millipore membrane with 8 μm pore size, operated at 100 mbar-) and in conventional filtration with wooden filters or sand filters (until 20 m · h−1 for rapid filtration). The mean residence time in a channel was 13 ms. The capture of bacteria was followed over 120 min through observation of the micro-channels by an optical microscope (Axiolab, Zeiss). Images were filmed using a highly light-sensitive camera (Pixelfly QE, PCO) mounted on the microscope with an exposure time of 30 ms (Figure 2) and operated at 2 frames min−1. All experiments were performed a minimum of three times to ensure repeatability.
Figure 2.

Microscopic observation of streamer formation with E. coli after 2 h of dead end filtration for three hydrodynamic conditions with a channel width of 10 μm: (a) Straight channels; (b) connected channels; (c) staggered channels. (Scale bar: 200 μm.)
Simulation conditions
The flows were simulated with the finite element method in order to know fully the 3D flow in the experimentation. The software used for the Navier-Stockes equation resolution is Comsol multiphysics with the chemical engineering toolbox. The parameters and the geometries used for the resolutions are the same as the ones chosen for experimentations (velocity = 0.0157 m/s; fluid density = 1000 kg/m3; fluid viscosity = 10−3 Pa · s). The mesh has been refined until convergence of the simulation results was achieved: a minimum of 8 meshes across the microchannel cross section was necessary in order to ensure effective simulations.
EXPERIMENTAL AND NUMERICAL RESULTS
Formation of bacteria streamers: Experimental evidence and main parameters
This section reports the experimental evidence of bacterial streamers and the analysis of the main parameters playing a role in this formation. In this paper, experiments were carried out over a short period of time, approximately 2 h, in non-nutritive conditions for non mature biofilm. It should be noted that these conditions are quite different to the ones classically used to study a mature biofilm formation, which occur over a longer period of time in nutritive conditions (Stoodley et al., 1999). Only first steps of transport and adhesion (reversible or not) were considered in our work.
As a reminder of our previous experimental work (Marty et al., 2012), the E. coli filtration across microchannels having different geometries is presented in Figure 2 with microscopic images taken after two hours of filtration.
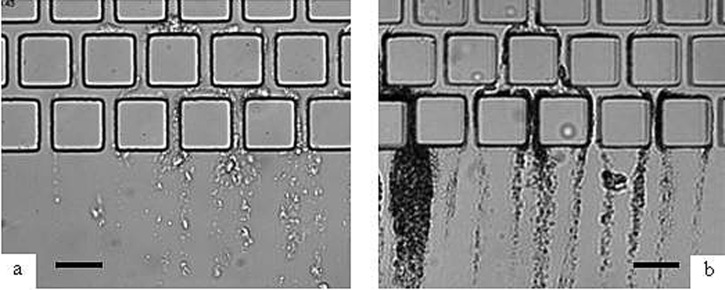
Compared to the straight channel (Fig. 2a), operating with connected channels (Fig. 2b) lead to the presence of “dead” zones with slow velocities of flows. It has been discussed that such zones in the flow have only a minor role in the capture efficiency. On the other hand, the introduction of tortuosities in the flow (in Fig. 2c with a staggered row of pillars) results in a significant increase in bacteria streamer formation. The staggered row geometry leads to the appearance of numerous direction changes near the corners. A zoom (Fig. 3) within the downstream staggered rows after 20 min of filtration shows the development of the bacteria colonies in the zone where changes in flow direction occur: the tortuosity of the flow promotes the capture of bacteria.
Figure 3.
Microscopic observation after 20 min of filtration with E. coli (a), S. aureus (b). ×500 magnification, scale bar: 50 μm.
Experiments have been performed with other bacteria (P. aeruginosa and S. aureus). Observations after 2 h of dead end filtration across straight channels are presented in Figure 4 for three bacterial strains.
Figure 4.

Observation of streamer formation after 2 h of dead end filtration with a channel width of 10 μm for three bacterial strains: (a) P. aeruginosa CIP 82118; (b) S. aureus CIP 4.83; (c) E. coli CIP 54127. (Scale bar: 200 μm.)
Streamer formations are observed with these three bacterial strains in non-nutritive conditions: the formation of streamers is then a generic behavior of bacteria for positive or negative Gram types and for bacilli or shells. With these experiments, the positive effect of the tortuosity is clearly put in evidence for E. coli and S. aureus. For the P. aeruginosa strain, this effect is less important mainly because of the strong ability of this strain to form streamers with straight channels configuration. For P. aeruginosa, experiments have been conducted with mucoid and non mucoid strains and the formation of streamers remains in the investigated range of operating conditions (Marty, 2012).
This behavior is linked to the “living” character of bacteria. In Figure 5, the clogging behavior of bacteria (Fig. 5a) is compared to the behavior observed with dead bacteria (Fig. 5b) and with particles (Fig. 5c). The concentration was 108 UFC/ml for both bacteria suspensions. In comparison, Figure 5c presents the clogging with 5 μm of diameter latex particles (Sulfate latex microspheres 4% w/v from Invitrogen Molecular Probes) after 60 min of filtration through straight channel with a width of 20 μm. The volume fraction was 10−3 v/v in a KCl solution (10−1 M).
Figure 5.

Observation of clogging behavior after two hours of dead end filtration for the filtration of living E. coli CIP 54127 (a), dead Escherichia coli CIP 54127 (b) and after 1 h for Latex particles with 5 μm diameter (c) (Agbangla et al., 2012). (Scale bar: 200 μm.)
As previously shown, live bacteria accumulates in the form of streamers in the downstream zone and are only very slightly captured on the upstream area (Fig. 5a). Conversely, when filtered in such microsystems, “inert” particles with the same “particle”/microchannel size ratio (2/10 for bacteria and 5/20 for latex particles) accumulate on the pillars constituting the wall of microchannels to form dendrites (Fig. 5c) that can lead to the formation of dense deposits in the upstream zone (Agbangla et al., 2012). Particles are then captured in low velocities zone (hydrodynamic stagnation point in the pillars) but are not accumulated in areas where the flow is important (or, to be more precise, if particles are deposited at these locations the importance of the flow leads to their immediate detachment and reentrainment in the flow). Experiments performed with dead bacteria (Fig. 5b) show clogging behaviour similar to that which can be observed with inert particles of a similar size (Fig. 5c).
The streamer formation is then linked to the living character of bacteria: this living character makes it possible for the attachment of bacteria in the domain where flow velocity is high. However, when dead, bacteria behave as inert particles and accumulate in the dead flow zone where the flow is not sufficient to detach them from the surface.
Numerical simulation of flow and evidence of secondary flow near corners
In a confined system, for a laminar flow between two walls, the flow is in the direction of the wall planes. But, it has been shown (Balsa, 1998) that the presence of obstacles can generate a flow perpendicular to the walls. These flows are known as secondary flows as they are still controlled by viscous diffusion and thus not linked to turbulence or vortices. They are generated by the change of curvature of the boundaries of the system, either by the presence of an obstacle or simply by a change in the direction of the flow due to an angle. These three-dimensional features in low-Reynolds-number confined corner flows existing in microfluidic devices have been recently analyzed to explain the formation of biofilm streamers (Guglielmini et al., 2011).
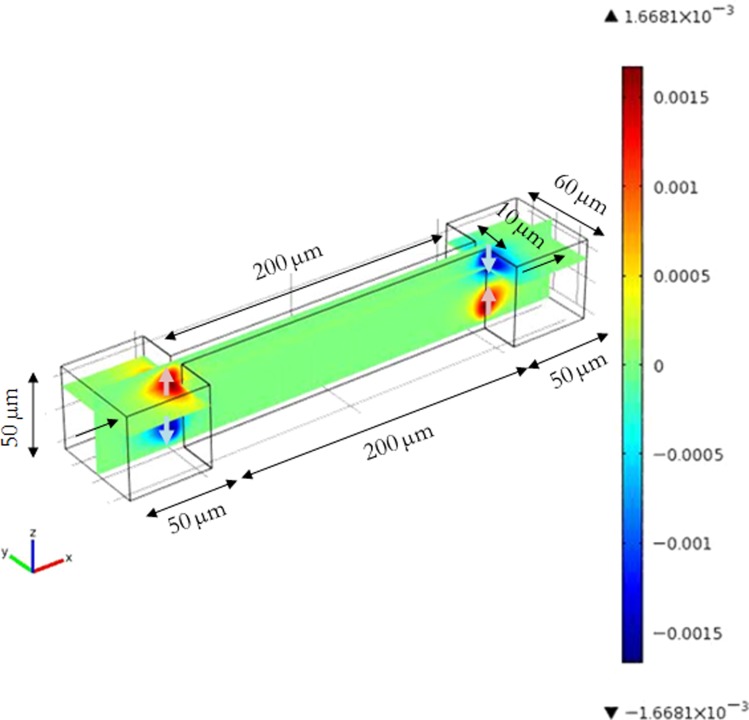
To highlight this secondary flow, three-dimensional flow simulation has been conducted in the microsystems geometries used in the experimental section. The flow is laminar: the inlet average velocity in the feed channel is 4.61 × 10⁻³ m s−1 (the value of the Reynolds number is 0.45) and the maximum velocity in a microchannel (10 μm of opening and 50 μm of thickness) is 0.027 m s−1 (Reynolds number is 0.45). The velocity along the z-axis, i.e., perpendicular to the main flow, is presented in Figure 6.
Figure 6.
Velocity along z in a 10 μm width straight microchannel. The main flow in xy plane is along x, i.e., from the left to the right of the figure.
Arrows indicate the direction of the corresponding velocities. The green zone corresponds to the zone where the velocity is oriented in the x-y plane; there is no velocity along z. There are four zones in which a positive or negative z-velocity exist. These areas are located at the inlet of microchannels and at the outlet: with a secondary flow directed toward the wall in the upstream zone of the restriction section and toward the bulk in the downstream zone. This result confirms the presence of secondary flows at the entrance of a pore similarly to secondary flows shown around an obstacle in a Hele-Shaw cell (Balsa, 1998) and at a corner in a microfluidic channel (Rusconi et al., 2010). In Figure 6, the velocity along z is approximately 6% of the main velocity. The maximum z velocity was located at 9.40 μm from the wall corresponding to 20% and 80% of the thickness.
Consequences of secondary flows on wall shear stress and on streamlines deviation
Three-dimensional flow simulations make the determination of the local wall shear stress and the calculation of streamlines possible. The analysis of the local wall shear stress near the secondary flow area shows neither increase nor decrease in wall shear stress at the inlet or the outlet of the microchannels. Only the normal increase of the wall shear stress within the microchannels due to the velocity increase in the restriction is in evidence. The maximum shear stress is constant and equal to 14 Pa inside the microchannel.
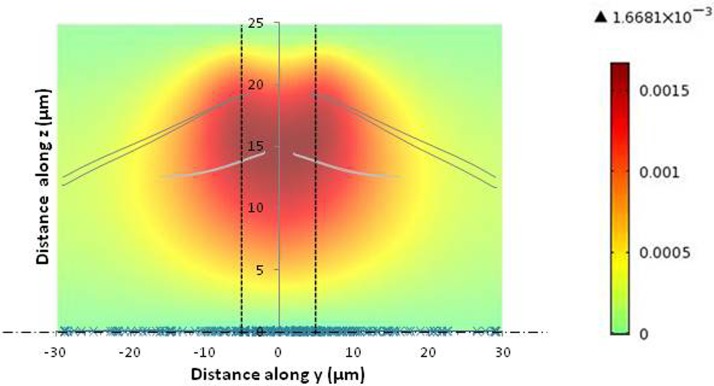
The influence of secondary flow areas on the streamlines has also been analysed. Streamlines are plotted in Figure 7 in the upper part of the microchannel for different initial positions along the thickness: z = 0 μm; 12.5 μm.
Figure 7.
Plot of the streamlines in the y-z plane within the upper half microchannel part. The color map represents the z-velocity at the microchannel inlet to put in light the position of the secondary flow. The vertical dashed lines represent the 10 μm microchannel aperture and the horizontal dash line represents the axis of symmetry at the middle of the microchannel height. Streamlines start at z = 0 μm (cross symbols) and at z = 12.5 μm (line).
First, it can be seen that the streamlines starting in the middle of the channel, z = 0 (represented with a cross symbol in Fig. 7) do not deviate and stay in the x-y plane. On the contrary, streamlines starting at z = 12.5 μm are deviated when they enter the secondary flow zone. Streamlines initially located at a distance of 12.5 μm from the wall can come closer to the wall (at a distance of 5 μm from the wall): a significant flow in the z direction results from the secondary flow. Because of the flow symmetry at low Reynolds number, the streamlines at the microchannel inlet (towards the walls) and the outlet (toward the bulk) are almost perfectly superimposed.
Role of connectivity and tortuosity on secondary flow
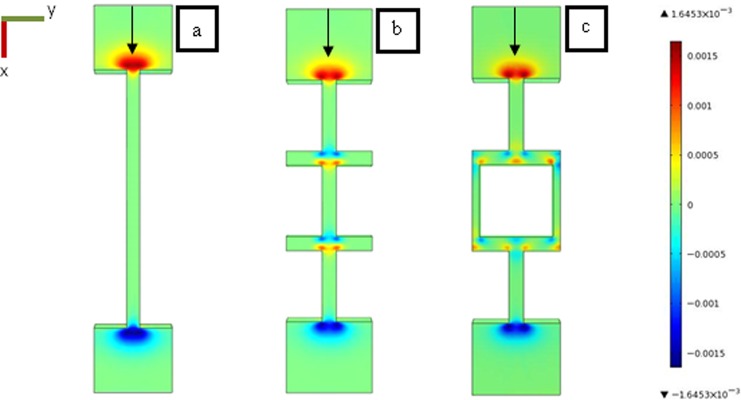
The secondary flow formation has been analyzed for the other microchannels geometries having connections between channels (Figure 2b) or tortuosities between staggered row pillars (Figure 2c). Figure 8 presents the z-velocities obtained with three-dimensional simulation of the flow in the different geometries. The zone where z-velocities is significant with a positive (toward the wall) or a negative value (toward the bulk) highlight the presence of secondary flow that can potentially deviate the streamlines as seen in previous section.
Figure 8.
Three-dimensional flow simulation for the flow geometries presented in Figure 2 [(a) straight channel; (b) connected channel; (c) staggered row]. The color map represents the z-velocity component. The green zones are relative to zones where z-velocity is not significant: the velocity vector is in xy plane. Hot colours and cold colours represent positive (towards the wall) and negative (toward the bulk) z velocity, respectively. The flow rate was 1.41 ml h−1 in the xy plane.
Secondary flows generated by the restriction at the inlet and the expansion at the outlet of the microchannels zone exist in all configurations: the magnitude and the location of secondary flows are similar. However, other secondary flows are created because of the connection between channels (Figure 8b) or because of flow tortuosity between staggered rows (Figure 8c). For connected microchannels, the secondary flows appear at each corner between channel connections, i.e., at 8 corners for one microchannels. In the staggered row flow, the secondary flow develops at the corners (8 positions) but also in the stagnation points (4 positions): the number of the secondary flow is thus more important in the staggered row geometry. In the case of the staggered row, it can also be noted (Fig. 8c) that the positive and the negative secondary flows are located alternatively in opposite sides of the channels. As discussed in Sec. 4, this particularity with tortuous flow plays a crucial role on streamers formation: the alternating positions of secondary flows favor the formation of filament joining opposite walls then playing the role of an efficient fishing line for bacteria.
DISCUSSION
It has been shown experimentally (Fig. 2) that the configuration of the flow has an effect on the bacterial streamers formation. The presence of “dead” zones with slow flow velocities introduced with connected channels does not promote the formation of streamers. Conversely, the streamers development is enhanced when the flow is tortuous (staggered row pillars). In confined geometries, the flow exhibits secondary flows where the flow curvature is important (Fig. 8). Recent papers have discussed the role of hydrodynamics and secondary flow on the bacterial streamers formation (Rusconi et al., 2011 and Valiei et al., 2012). In Rusconi et al. 2010, velocities of secondary flow of 5% of the average velocity of the main flow are considered as responsible for bacterial streamers of P. aeruginosa in nutritive conditions. It has been shown (Guglielmini et al., 2011) that secondary flow with velocities representing more than 1% of the average velocity in the microchannel correspond to a minimum flow configuration to favor streamers formation; this secondary flow velocity being obtained for a radius of curvature of more than 30°. In Sec. 3, 3D flow simulations showed secondary flow in our experimental devices representing approximately 6% of the main velocity. In Sec. 5, we discuss the possible role of these secondary flows on streamers formation with E. coli in non nutritive conditions.
Role of secondary flow on streamers formation
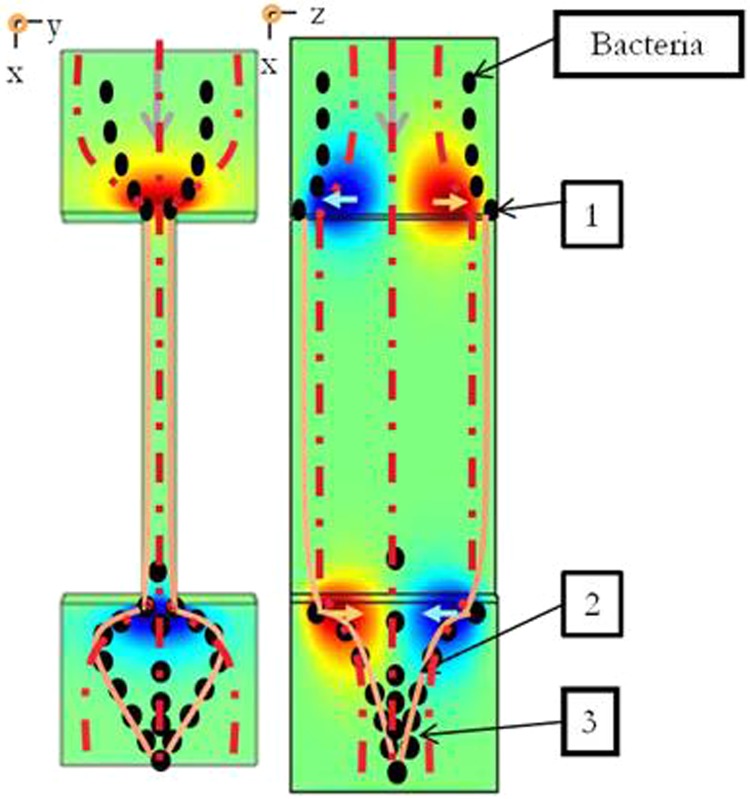
Previous studies (Rusconi, 2011) have shown the importance of secondary flow on the development of filaments (formed mainly by extracellular polymeric substances EPS) as the first step in the formation of streamers. According to this background, the scenario of the bacterial streamer formation in our experiments could be divided into three mains steps. Figure 9 illustrates this scenario by superimposing secondary flows determined with numerical simulations and a schematized view of the filaments and the streamer formations observed experimentally.
Figure 9.
Schematization of the scenario for the formation of a streamer in a microchannel based on hydrodynamic conditions. The flow direction is from top to bottom. The z velocity for xy and xz planes in a microchannel is represented with the color map. Bacteria are depicted as black ellipses, the streams lines as dotted lines and the filaments of EPS by solid lines. Steps 1, 2, and 3 represent, bacteria adhesion, formation of filaments (fishing line) and formation of streamers (fishing net), respectively.
The first step is the bacterial adhesion (step 1 in Figure 9). By following the stream lines directed towards the walls at the pore entrance (as shown in Figure 7), bacteria are deflected toward the wall and have a higher probability of reaching the walls (upper or lower walls) at the entrance of the microchannel. The “shear-enhanced adhesion” mechanisms highlighted by Lecuyer et al. (2011) for bacteria could then lead to the increase of the residence time of adhered bacteria in those areas where the shear stress is higher because of the flow section restriction.
The second step is the formation of filaments (step 2 in Figure 9) acting as a fishing line. Once adhered, the EPS of bacteria form filaments (with possibly few bacteria attach to it) that are transported by the flow along the microchannel wall until the outlet. The presence of this very thin filament made of extracellular matrix wall is difficult to visualize, but it is sometimes possible to see the slow movement of bacteria along the microchannel wall, probably because they are entrapped in these filaments. These filaments are transported by the flow and thus returned towards the center of the liquid stream at the outlet of the channel, due to the presence of secondary flows (directed towards the center of the flow at the microchannels outlet). After a while, the secondary flows and local flow disturbances allow them to connect together to form a fishing line, crossing the stream lines.
The third step is the streamer formation (step 3 in Figure 9). The filaments, once joined in the flow, form a fishing net in the flow which favor the capture of the bacteria at the outlet of the microchannels. The capture efficiency is relatively good as these filaments cross the streamlines of the flow transporting bacteria.
Role of tortuosity on streamers formation
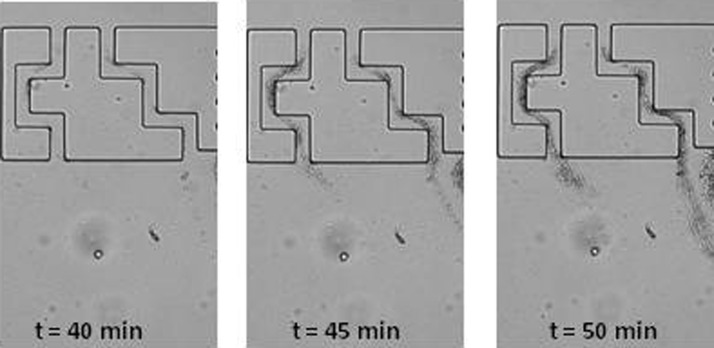
In the staggered row geometry leading to tortuous flow, the formation of the streamers is significantly more important (Figure 2c) and quicker (Marty et al., 2012). As demonstrated with flow simulations in this geometry, secondary flows exist near each corner but also in stagnation points (Figure 8c). Rusconi et al. (2010) already pointed out the role of tortuous geometry on streamer development in 200 μm width channels after about ten hours of bacteria flow in nutritive conditions. We therefore observe the same trend with bacteria in non nutritive conditions, in 10 μm large channels, after one hour. This difference in kinetics between these works could be partially attributed to the bacteria/channels size ratio differences. The mechanisms leading to streamer formation in such tortuous geometry has been discussed by Rusconi et al. (2011). These authors highlighted the creation of EPS filaments and bacterial streamers between consecutive angles in the flow. This mechanism could also be the cause of the initial formation of streamers in our experiments carried out over shorter periods of time: the formation of filaments joining consecutive angles on opposite channels side are clearly observed in Figs. 310 after 40 min.
Figure 10.
Microscopic observation of first streamer formation after 45 min in tortuous flow with E. coli with a ×500 magnification. The channels are 20 μm width.
The secondary flows directed towards the wall are promoting bacteria adhesion, while secondary flows directed toward the bulk enhance the release of the EPS filaments into the bulk: EPS thread is stretched into the bulk by the drag force induced by the secondary velocity and then act as a fishing line to catch free-floating bacteria. In the tortuous geometry, such phenomena occur alternatively in opposite sides of microchannels and can help filaments join successive corners as observed in Figure 10. If we consider a perfect laminar flow such a junction between opposite corners should be impossible: the filament could not cross the flow stream lines. However, the flow in such system is not perfectly regular and transient flow perturbation coupled with the visco-elasticity of the EPS filament (Rusconi et al., 2011) could help filament tails to reach the other side of the channel. When the EPS filament reaches the other side, it leads to the formation of an efficient fishing net for the capture of bacteria. This internal fouling within the tortuosity of the microchannels then comes out of the microchannels which lead to the formation of streamers in the downstream area. Such a mechanism could explain why the staggered row geometry favors the formation of bacteria streamers.
CONCLUSIONS
Direct observations of transfer through 10 and 20 μm width channels of E. coli, P. aeruginosa, and S. aureus bacterial suspensions in non nutritive conditions have shown bacterial accumulation having the form of streamers oscillating in the downstream zone of microchannels. These streamers can be 200 μm long (thus constituted of millions of bacteria) in less than 1 h of filtration. Experiments suggest that the important role played by the flow tortuosity through microchannels on the formation of streamers. Indeed, streamer formation is promoted in tortuous flow (staggered row pillars). Conversely, the presence of dead flow zones (connected microchannels) does not increase the streamer formation. Three dimensional flow simulations highlighted the presence of secondary flows deflecting streamlines near the walls that have previously been discussed as responsible for streamer formation (Rusconi et al., 2011). A scenario in three steps for the formation of streamers is established, connecting the experimental results with numerical simulations: 1-bacterial adhesion promoted by the secondary flow towards the walls at microchannels entrance, 2-formation of thin EPS filaments transported by the flow within the microchannels and then stretched to the middle of the channel by the secondary flow at the microchannels outlet, 3-EPS filaments act as a fishing line and after a while join themselves to form a fishing net leading to the capture of bacteria in the streamers. The tortuosity of channels exacerbates this scenario because of the presence of secondary flow at consecutive angles on opposite sides of the channels. Such a tortuous flow leads to the formation of EPS filaments crossing the streamline and thus enhancing the capture of bacteria. The internal biofouling within the tortuous porous media then promotes the formation of streamers at the channel outlet. These findings underline the need to investigate the role of bacteria streamer development in processes where biofilm formation is critical.
ACKNOWLEDGMENTS
The authors thank Paul Duru (IMFT) and David Bourrier (LAAS) for their help in the development of microfluidic devices. The authors would like to thank Eric Climent, Mark Durham, Howard Stone and Roberto Rusconi for the helpful discussions on streamer formation.
References
- Agbangla, G. C., Climent, E., and Bacchin, P., “Experimental investigation of pore clogging by microparticles: Evidence for a critical flux density of particle yielding arches and deposits,” Sep. Purif. Technol. 101, 42–48 (2012). 10.1016/j.seppur.2012.09.011 [DOI] [Google Scholar]
- Bacchin, P., Marty, A., Duru, P., Meireles, M., and Aimar, P., “Colloidal surface interactions and membrane fouling: Investigations at pore scale,” Adv. Colloid Interface Sci. 164, 2–11 (2011). 10.1016/j.cis.2010.10.005 [DOI] [PubMed] [Google Scholar]
- Balsa, T. F., “Secondary flow in a Hele-Shaw cell,” J. Fluid Mech. 372, 25–44 (1998). 10.1017/S0022112098002171 [DOI] [Google Scholar]
- Burks, G. A., Velegol, S. B., Paramonova, E., Lindenmuth, B. E., Feick, J. D., and Logan, B. E., “Macroscopic and nanoscale measurements of the adhesion of bacteria with varying outer layer surface composition,” Langmuir 19, 2366–2371 (2003). 10.1021/la026375a [DOI] [Google Scholar]
- de Kerchove, A. J., and Elimelech, M., “Bacterial swimming motility enhances cell deposition and surface coverage,” Environ. Sci. Technol. 42, 4371–4377 (2008). 10.1021/es703028u [DOI] [PubMed] [Google Scholar]
- Drescher, K., Shen, Y., Bassler, B. L., and Stone, H. A., “Biofilm streamers cause catastrophic disruption of flow with consequences for environmental and medical systems,” PNAS 110, 4345–4350 (2013). 10.1073/pnas.1300321110 [DOI] [PMC free article] [PubMed] [Google Scholar]
- Flemming, H.-C. and Wingender, J., “The biofilm matrix,” Nat. Rev. Micro. 8, 623–633 (2010). 10.1038/nrmicro2415 [DOI] [PubMed] [Google Scholar]
- Gaboriaud, F., Gee, M. L., Strugnell, R., and Duval, J. F. L., “Coupled electrostatic, hydrodynamic, and mechanical properties of bacterial interfaces in aqueous media,” Langmuir 24, 10988–10995 (2008). 10.1021/la800258n [DOI] [PubMed] [Google Scholar]
- Gannon, J. T., Manilal, V. B., and Alexander, M., “Relationship between cell surface properties and transport of bacteria through soil,” Appl. Environ. Microbiol. 57, 190–193 (1991); available at http://aem.asm.org/content/57/1/190.short. [DOI] [PMC free article] [PubMed] [Google Scholar]
- Guglielmini, L., Rusconi, R., Lecuyer, S., and Stone, H. A., “Three-dimensional features in low-Reynolds-number confined corner flows,” J. Fluid Mech. 668, 33–57 (2011). 10.1017/S0022112010004519 [DOI] [Google Scholar]
- Jewett, D. G., Hilbert, T. A., Logan, B. E., Arnold, R. G., and Bales, R. C., “Bacterial transport in laboratory columns and filters: Influence of ionic strength and pH on collision efficiency,” Water Res. 29, 1673–1680 (1995). 10.1016/0043-1354(94)00338-8 [DOI] [Google Scholar]
- Lebleu, N., Roques, C., Aimar, P., and Causserand, C., “Role of the cell-wall structure in the retention of bacteria by microfiltration membranes,” J. Membr. Sci. 326, 178–185 (2009). 10.1016/j.memsci.2008.09.049 [DOI] [Google Scholar]
- Lecuyer, S., Rusconi, R., Shen, Y., Forsyth, A., Vlamakis, H., Kolter, R., and Stone, H. A., “Shear stress increases the residence time of adhesion of pseudomonas aeruginosa,” Biophys. J. 100, 341–350 (2011). 10.1016/j.bpj.2010.11.078 [DOI] [PMC free article] [PubMed] [Google Scholar]
- Li, X. and Chu, H. P., “Membrane bioreactor for the drinking water treatment of polluted surface water supplies,” Water Res. 37, 4781–4791 (2003). 10.1016/S0043-1354(03)00424-X [DOI] [PubMed] [Google Scholar]
- Liu, Y. and Li, J., “Role of pseudomonas aeruginosa biofilm in the initial adhesion, growth and detachment of escherichia coli in porous media,” Environ. Sci. Technol. 42, 443–449 (2008). 10.1021/es071861b [DOI] [PubMed] [Google Scholar]
- Marty, A., “Formation de panaches bactériens lors de la filtration à travers des microsystèmes,” Ph.D. dissertation, University of Toulouse, France (2012). [Google Scholar]
- Marty, A., Roques, C., Causserand, C., and Bacchin, P., “Formation of bacterial streamers during filtration in microfluidic systems,” Biofouling 28, 551–562 (2012). 10.1080/08927014.2012.695351 [DOI] [PubMed] [Google Scholar]
- McDonald, J. C., Duffy, D. C., Anderson, J. R., Chiu, D. T., Wu, H., Schueller, O. J. A., and Whitesides, G. M., “Fabrication of microfluidic systems in poly(dimethylsiloxane),” Electrophoresis 21, 27–40 (2000). 10.1002/(SICI)1522-2683(20000101)21:1%3C27::AID-ELPS27%3E3.0.CO;2-C [DOI] [PubMed] [Google Scholar]
- Ngene, I. S., Lammertink, R. G. H., Wessling, M., and Van der Meer, W. G. J., “Particle deposition and biofilm formation on microstructured membranes,” J. Membr. Sci. 364, 43–51 (2010). 10.1016/j.memsci.2010.07.048 [DOI] [Google Scholar]
- Nguyen, D., Joshi-Datar, A., Lepine, F., Bauerle, E., Olakanmi, O., Beer, K., McKay, G., Siehnel, R., Schafhauser, J., Wang, Y., Britigan, B. E., and Singh, P. K., “Active starvation responses mediate antibiotic tolerance in biofilms and nutrient-limited bacteria,” Science 334, 982–986 (2011). 10.1126/science.1211037 [DOI] [PMC free article] [PubMed] [Google Scholar]
- Rusconi, R., Lecuyer, S., Autrusson, N., Guglielmini, L., and Stone, H. A., “Secondary flow as a mechanism for the formation of biofilm streamers,” Biophys. J. 100, 1392–1399 (2011). 10.1016/j.bpj.2011.01.065 [DOI] [PMC free article] [PubMed] [Google Scholar]
- Rusconi, R., Lecuyer, S., Guglielmini, L., and Stone, H. A., “Laminar flow around corners triggers the formation of biofilm streamers,” J. R. Soc. Interface 7, 1293–1299 (2010). 10.1098/rsif.2010.0096 [DOI] [PMC free article] [PubMed] [Google Scholar]
- Schäfer, A., Harms, H., and Zehnder, A. J. B., “Bacterial accumulation at the air−water interface,” Environ. Sci. Technol. 32, 3704–3712 (1998). 10.1021/es980191u [DOI] [Google Scholar]
- Stoodley, P., Lewandowski, Z., Boyle, J. D., and Lappin-Scott, H. M., “Structural deformation of bacterial biofilms caused by short-term fluctuations in fluid shear: An in situ investigation of biofilm rheology,” Biotechnol. Bioeng. 65, 83–92 (1999). [DOI] [PubMed] [Google Scholar]
- Torkzaban, S., Tazehkand, S. S., Walker, S. L., and Bradford, S. A., “Transport and fate of bacteria in porous media: Coupled effects of chemical conditions and pore space geometry,” Water Resour. Res. 44, W04403, doi: 10.1029/2007WR006541 (2008). [DOI] [Google Scholar]
- Valiei, A., Kumar, A., Mukherjee, P. P., Liu, Y., and Thundat, T., “A web of streamers: biofilm formation in a porous microfluidic device,” Lab Chip 12, 5133–5137 (2012). 10.1039/c2lc40815e [DOI] [PubMed] [Google Scholar]
- van Loosdrecht, M. C., Lyklema, J., Norde, W., Schraa, G., and Zehnder, A. J., “The role of bacterial cell wall hydrophobicity in adhesion,” Appl. Environ. Microbiol. 53, 1893–1897 (1987); available at http://aem.asm.org/content/53/8/1893.short. [DOI] [PMC free article] [PubMed] [Google Scholar]
- Vrouwenvelder, J. S., Graf von der Schulenburg, D. A., Kruithof, J. C., Johns, M. L., and van Loosdrecht, M. C. M., “Biofouling of spiral-wound nanofiltration and reverse osmosis membranes: A feed spacer problem,” Water Res. 43, 583–594 (2009). 10.1016/j.watres.2008.11.019 [DOI] [PubMed] [Google Scholar]
- Walker, S. L., Redman, J. A., and Elimelech, M., “Role of cell surface lipopolysaccharides in Escherichia coli K12 adhesion and transport,” Langmuir 20, 7736–7746 (2004). 10.1021/la049511f [DOI] [PubMed] [Google Scholar]
- Yazdi, S. and Ardekani, A. M., “Bacterial aggregation and biofilm formation in a vortical flow,” Biomicrofluidics 6, 044114-9 (2012). 10.1063/1.4771407 [DOI] [PMC free article] [PubMed] [Google Scholar]


