

Abstract
Purpose: Transcranial magnetic resonance-guided focused ultrasound surgery is a noninvasive technique for causing selective tissue necrosis. Variations in density, thickness, and shape of the skull cause aberrations in the location and shape of the focal zone. In this paper, the authors propose a hybrid simulation-MR-ARFI technique to achieve aberration correction for transcranial MR-guided focused ultrasound surgery. The technique uses ultrasound beam propagation simulations with MR Acoustic Radiation Force Imaging (MR-ARFI) to correct skull-caused phase aberrations.
Methods: Skull-based numerical aberrations were obtained from a MR-guided focused ultrasound patient treatment and were added to all elements of the InSightec conformal bone focused ultrasound surgery transducer during transmission. In the first experiment, the 1024 aberrations derived from a human skull were condensed into 16 aberrations by averaging over the transducer area of 64 elements. In the second experiment, all 1024 aberrations were applied to the transducer. The aberrated MR-ARFI images were used in the hybrid simulation-MR-ARFI technique to find 16 estimated aberrations. These estimated aberrations were subtracted from the original aberrations to result in the corrected images. Each aberration experiment (16-aberration and 1024-aberration) was repeated three times.
Results: The corrected MR-ARFI image was compared to the aberrated image and the ideal image (image with zero aberrations) for each experiment. The hybrid simulation-MR-ARFI technique resulted in an average increase in focal MR-ARFI phase of 44% for the 16-aberration case and 52% for the 1024-aberration case, and recovered 83% and 39% of the ideal MR-ARFI phase for the 16-aberrations and 1024-aberration case, respectively.
Conclusions: Using one MR-ARFI image and no a priori information about the applied phase aberrations, the hybrid simulation-MR-ARFI technique improved the maximum MR-ARFI phase of the beam's focus.
Keywords: phase aberration correction, tcMRgFUS, MR-ARFI, MR-ARFI-based corrections, ultrasound beam simulations
BACKGROUND
Transcranial Magnetic Resonance-guided focused ultrasound surgery (tcMRgFUS) is a noninvasive technique for causing tissue necrosis in a small region in the brain. In the tcMRgFUS treatment setup, the transducer surrounds the head (with water between the transducer and the patient head) and the ultrasound beams focus inside the brain to cause coagulative tissue necrosis at the focal zone, while sparing the intervening tissue. The spatial (resulting from varying skull thickness and shape) and acoustic heterogeneities of the cranium cause distortions in the location and shape of the focus and a reduction in the focal intensity, thereby posing a challenge in achieving a focus in the brain. These skull-caused aberrations can be corrected by modifying the transducer elements’ phases such that the beams add constructively at the focus after travelling through the skull. Aberration correction techniques are used to calculate these element-by-element phase modifications for the transcranial application of FUS. Imaging-based techniques have used both MRI (Ref. 1) and Computed Tomography (CT) (Refs. 2 and 3) imaging to estimate these phases, though the CT-based techniques are currently used clinically.4, 5, 6, 7 This method uses approximate derivations of acoustic parameters from Hounsfield units as input to ultrasound beam propagation simulations to estimate phase corrections. The computation is fast and CT-based techniques have been shown in ex vivo human studies to recover much of the focal intensity, although not all of it.8
There has been interest in using MRI for aberration correction in order to use the same imaging modality for treatment planning and guidance. Techniques that use MRI to measure acoustic radiation force (MR-ARFI) displacement phase have been proposed.9, 10, 11, 12 A short ultrasound pulse is used to cause tissue displacement due to the beam's radiation force, and motion encoding gradients are used to encode this displacement into the phase of the MR image. MR-ARFI-based phase aberration correction techniques13, 14, 15, 16 consider the measured MR-ARFI phase as an estimate of the beam's intensity pattern. These techniques measure the change in MR-ARFI phase at the focus due to each element's phase and derive the optimum phase correction for all elements analytically using transducer groupings derived from basis functions13, 14, 15 or iteratively.16
For all MR-ARFI based techniques, many displacement-measurements per element are required to recover the focal intensity (4 × number of transducer elements,13 resulting in about 2000–4000 pretreatment ultrasound pulses for different tcMRgFUS systems). Subsequently, a large number of MR-ARFI measurements are required to achieve phase correction for a single focal position. Further, it is likely that advancements in phased array manufacturing and increased requirements for larger steering and treatment envelope17, 18 for tcMRgFUS will result in increasingly larger number of elements used in transcranial applicators19 increasing the time for MR-ARFI based focusing.
The purpose of this work is to introduce a hybrid simulation-MR-ARFI technique. The technique uses an experimentally derived MR-ARFI image in combination with ultrasound beam propagation simulations to estimate phase aberration corrections for tcMRgFUS. The simulated aberrations that are most consistent with the measured MR-ARFI image are taken as the estimated aberrations and subtracted to achieve a corrected MR-ARFI image. This corrected MR-ARFI image can be used to run another iteration of the hybrid simulation-MR-ARFI technique to improve the correction. Here, we demonstrate the gain achievable by using one MR-ARFI image in the hybrid simulation-MR-ARFI technique.
THEORY
An MR-ARFI image of the aberrated ultrasound beam at the focus is used as an experimental measure of aberrations. In addition, ultrasound beam propagation simulations are used to simulate the aberrated focal spot using simulated aberrations based on an initial estimate. Then, an optimization routine minimizes the difference between the simulated and experimental MR-ARFI phase maps by modifying the simulated aberrations, as shown in loop 1 of Fig. 1. The aberrations in the simulation that minimize the difference between the simulated and experimental focal patterns are considered an estimate of the real aberrations. The details of the components of the technique are described below.
Figure 1.

The flowchart of the hybrid simulation-MR-ARFI technique is shown. Loop 1 charts the optimization routine, which modifies the simulated aberrations. The loop terminates when the difference between the simulated and experimental pattern is less than the user defined constraint (the minima). Loop 1 uses only one MR-ARFI image. Loop 2 charts the steps of using successive MR-ARFI images to improve focusing. In this paper, we demonstrate improvements in focusing that can be achieved using loop 1 only.
Experimental displacement pattern (dispexp)
It has been shown using simulation and experiments that the displacement measurement taken immediately after the application of an ultrasound pulse is a good estimate of the beam's intensity pattern.20 The phase of the MR-ARFI image is an integral of the displacement function of the tissue over the duration of the encoding gradient. For the hybrid simulation-MR-ARFI technique, we ensure that this encoding is sufficiently short to consider the MR-ARFI phase at the focus a measure of the beam's radiation force and hence intensity. In this work, a short ultrasound pulse (e.g., 5 ms or less) is applied to the tissue and a MR-ARFI phase image (dispexp) is acquired using a 2D spin echo MR-ARFI pulse sequence.21
Simulated radiation force pattern (dispsim)
The Hybrid Angular Spectrum (HAS) technique22 that has been shown to accurately model the effects of attenuation, refraction, and reflection of the beam in complex inhomogeneous tissue geometries is used to simulate the propagation of the ultrasound beam. For the work in this paper, a homogeneous model is used based on high resolution gradient recalled echo (GRE) images of the experimental setup. The ultrasound beam is propagated in the model and the beam's radiation force pattern is derived from the simulated intensity pattern using
| (1) |
where I [W/m2] is the temporal average intensity, c [m/s] is the speed of sound, and α [Np/m] is the absorption coefficient of the tissue. The values for α and c are set using published tissue data.23
The experimental MR-ARFI phase pattern is expected to be broader than the beam's intensity profile, as other investigators have reported,24, 25 due to shear wave propagation during the finite duration of the motion encoding gradient and the ultrasound pulse, beam scattering26 (it has been shown that tissue scattering may cause blurring of the focal spot), and transducer irregularities. In theory, a broadening filter could be calculated from the MR pulse sequence if sufficient information on tissue parameters is available. For human tissues, these parameters are published.27, 28 However, for the phantom work described here, we experimentally found the broadening filter in the following manner. The filter was assumed to be a 2D rotationally symmetric Gaussian kernel given by
| (2) |
where W is the width of the Gaussian filter. We derive the terms in the equation using a calibration image, which is an image derived by applying a known aberrator to the transducer. The first part of the equation is an amplitude term to convert simulated force to MR-ARFI phase. It is calculated by dividing the maximum MR-ARFI phase of the experimental calibration image (dispcalibration) with the maximum radiation force in the simulated calibration image (Fcalibration). The width of the broadening filter is set by comparing the simulated and experimental calibration patterns; the normalized simulated radiation force pattern [shown in Fig. 2a] is compared with the normalized MR-ARFI phase pattern [shown in Fig. 2b] for the calibration image. The value of W that minimizes the squared difference between both patterns [shown in Fig. 2d] for the calibration image is considered the width of the filter.
Figure 2.

Comparison of (a) a normalized radiation force pattern simulated for the transducer using average values for acoustic parameters (speed of sound = 1520 m/s attenuation = 0.04 Np/cm/MHz) and (b) a normalized experimental MR-ARFI phase image in a homogeneous phantom with no aberration applied to the transducer. Transverse slice profile of experimental (solid line) and simulated patterns (dotted line) (c) without Gaussian filtering and (d) with Gaussian filtering are shown.
After calibration calculation, all the simulated radiation force patterns [Fsim(x,y)] are convolved with the broadening filter (Filter) to obtain the simulated MR-ARFI phase patterns to be used in the optimization routine, such that
| (3) |
where * is the convolution operator and dispsim is the simulated MR-ARFI phase pattern to be used in the optimization routine.
Optimization routine
The cost function of the optimization routine is
| (4) |
where dispsim is the simulated pattern derived from HAS beam simulation technique and convolved with a broadening filter [as given in Eq. 3] and dispexp is the experimental MR-ARFI phase pattern. The variable i denotes the region around the focal zone where the difference is minimized. In this paper, we use the area around the focal zone where the experimental MR-ARFI phase values are greater than 5% of the maximum MR-ARFI phase for the calculation of the cost function. The values of phase aberrations applied to each element in the simulation are modified until J achieves the convergence criterion. The present implementation uses a simplex based unconstrained derivative-free optimization routine29 (using the MATLAB Optimization Toolbox Release 2012b, The MathWorks, Inc., Natick, MA). An example optimization run specifying the convergence criterion, maximum number of iterations, and the initial starting point is detailed below.
Optimization example
Figure 3a shows a defocused radiation force pattern that was simulated using the HAS technique with random numerical phase aberrations applied during transmission to all 1024 elements. The resulting aberrated radiation force pattern [Fig. 3a], was used to estimate the applied phase aberrations using the simplex based optimization routine (MATLAB®fminsearch command). Zero aberrations were used as the initial starting point, maximum number of function evaluations was set at 6000, and the optimization routine was terminated if the cost function value did not change by 10−8 between successive iterations. The estimated aberrations after the convergence of the optimization routine were equal to the applied phase aberrations as shown in Fig. 3b. Only the first 100 elements are shown for clarity, all 1024 aberrations were estimated correctly by the optimization algorithm, demonstrating that the algorithm is able to find the global minima in the solution parameter space.
Figure 3.
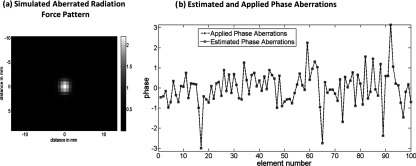
(a) The simulated aberrated radiation force image that was used to estimate aberrations using the hybrid simulation-MR-ARFI technique. (b) Applied aberrations compared to the estimated aberrations. A representative sample of the phase aberrations applied to the first 100 elements is shown for clarity. The estimated aberrations were equal to the applied aberrations for all 1024 elements in this simulation study.
Application of correction
The phase aberrations recovered from the simulation after convergence of the optimization routine can be subtracted from the aberrations applied to the corresponding transducer elements to achieve the corrected beam focus.
METHODS
All the experiments were performed on the InSightec ExAblate Focused Ultrasound Surgery conformal bone system consisting of a 1024-element phased-array transducer operating at 550 kHz, with a 3T GE scanner for ARFI measurements. The frequency and number of elements of this transducer are comparable to the hemispherical systems currently in use for tcMRgFUS treatments, and this was an ideal platform for this proof of concept study. The transducer geometry is planar, with the 1024 elements divided into four quadrants. Steering phases were applied to the transducer to focus the ultrasound beam at a predefined location; these phases were calculated automatically by the vendor provided software. The setup for the experiments is shown in Fig. 4a. The transducer shown in Fig. 4b was placed below the tissue mimicking phantom [Elasticity Phantom, Computerized Imaging Reference Systems, Inc. (CIRS), Norfolk, VA] with degassed water between the two for coupling. A simple homogeneous phantom model (homogeneous cylinder) was generated using GRE images of the setup to define the dimensions of the cylinder and the distance of the transducer from the phantom. A single-channel receive-only radio frequency coil for MRI imaging was placed around the phantom and secured using a rigid phantom holder.
Figure 4.

(a) A schematic of the experimental setup illustrating the transducer, the homogeneous phantom, the imaging plane, and the beam propagation direction. The location of the imaging plane coincides with the beam's focus and is shown using dashed lines. (b) The 1024 element FUS transducer is shown, with the transducer membrane deflated. The skull-based phase aberrations applied to the transducer for the (c) 16-aberration and (d) 1024-aberration experiments are plotted.
We used a skull-based aberration pattern calculated for a tcMRgFUS patient treatment at the Focused Ultrasound Surgery Center at the University of Virginia, Charlottesville, for this work. The aberrations were calculated for the 1024-element spherical head FUS system (ExAbalate 4000, InSightec, Tirat Carmel, Israel). To calculate the aberrations, the patient underwent a preoperative CT scan. Using the bone density and thickness from the CT scan the phase distortion for each transducer element was calculated based on a three layered model (water, bone, and brain). Further information about the calculation of the aberrations is given in Ref. 3. In this study, the skull-based aberrations were applied during transmission to the FUS conformal bone transducer using vendor provided software. These phase aberrations were added in addition to the phases applied to the transducer to focus at a particular depth. For calculation of the ultrasound beam simulation and the optimization routine, an Intel® Core™ i7 laptop with a 2.70 GHz processor and a 4 GB RAM was used. The calculation time for one simulation run in loop 1 was approximately 1 s.
Two experiments were conducted for this study. In the first experiment, the 1024 skull-based aberrations were condensed to 16 aberrations shown in Fig. 4c. These 16 aberrations were applied during transmission to the transducer to cause an aberrated focal zone. In the second experiment which mimics a clinical situation, all 1024 aberrations were applied to the transducer to generate an aberrated focal spot. For both experiments, the MR-ARFI image of the aberrated focus was used in the hybrid simulation-MR-ARFI technique to calculate 16 phase corrections for the transducer. In other words, the technique calculated one phase correction for each group of 64 elements resulting in 16 total corrections for the transducer for both experimental cases. For the 16-aberration experiment, the aberration and correction were applied to the same transducer groupings. The transducer groupings were based on manufacturer specified element numbering [as shown in Fig. 4c]. The transducer elements are numbered in a raster pattern from the left to right in each quadrant starting from the top left, clockwise between quadrants. The initial starting point of the optimization algorithm was fixed at zero aberrations, the maximum number of function evaluations was allowed to be 8000, and the optimization routine was terminated if the cost function value did not change by 10−8 between successive iterations. These parameters were chosen to ensure that the total computation time of the optimization routine was kept less than 4 h for the implementation on our computer (see Sec. 5). Further discussion about correcting aberrations over 16 effective elements for both experiments is provided later in Sec. 5. Both experiments were replicated three times, each conducted on a separate day. The experimental configuration (setup with transducer, phantom, and coil) during one experiment was kept fixed and was taken apart and rebuilt for each repeat experiment.
Since sufficient information on the ultrasound parameters of the phantom for calculation of the broadening filter were not known, one calibration image was acquired without applying any phase aberrations to the transducer at the beginning of each experiment. This image was used to calibrate the width of the Gaussian kernel as described in Sec. 2. The calibration terms were obtained experimentally, as shown in Fig. 2, by comparing the (a) simulated radiation force pattern (using literature values for water23 and manufacturer provided values for the tissue mimicking phantom, speed of sound 1533 m/s, attenuations 0.46 dB/cm/MHz) and (b) MR-ARFI phase image with no aberrations.
The experimental MR-ARFI image of the aberrated focus was acquired perpendicular to the beam direction as shown in Fig. 4, with the beam focus located inside the phantom in a plane close to the point of maximum sensitivity of the MRI coil. The distance from the transducer to the focus was kept between 8 and 9 cm for all experiments. A 2D spin echo sequence with unipolar gradients was used for imaging. The duration of the ultrasound pulse and unipolar gradient was set to 5 ms to achieve the narrowest displacement profiles that would match the intensity patterns. The following imaging parameters were used: TE = 36 ms, TR = 800 ms, FOV = 18 × 13.5 cm2, matrix size = 128 × 96, slice thickness = 3 mm, BW = 15.6 kHz. The ultrasound power was 70 W for all experiments and the ultrasound was turned on for 5 ms. Two MRI phase images (φ+, φ−) using opposite polarity encoding gradients were acquired and subtracted to calculate the MR-ARFI phase [Δφd = 1/2(φ+−φ−)]. The subtraction removed phase errors due to magnetic field inhomogeneities and eddy currents.9, 21
RESULTS
Contour plots of the simulated beam patterns of the ideal (unaberrated) and aberrated focal zone for the 16-aberration case and the 1024-aberration case are shown in Fig. 5. Experimentally acquired ideal, aberrated, and corrected MR-ARFI focal plane images of a 16-aberration and 1024-aberration experiment are shown in Fig. 6. Both simulated (Fig. 5) and experimental images (Fig. 6) show that the application of the aberration results in a decrease in the focal displacement as expected, with the 16-aberration experiment causing a smaller reduction in focal displacement compared to the 1024-aberration case. The two aberrated images shown in Fig. 6 were used in the hybrid simulation-MR-ARFI technique to calculate the estimated aberrations. The estimated aberrations were then subtracted during transmission from the applied aberrations to obtain the corrected images shown in Fig. 6. The transverse focal profiles of the ideal (unaberrated) image, the aberrated image (after applying numerical aberrations), and the corrected image (using the corrections from the hybrid simulation-MR-ARFI technique) for both experiments are compared in Fig. 7. An improvement in the focal displacement can be seen from Figs. 7a, 7b. Figure 8 plots the value of the cost function per iteration of the optimization routine for a representative case of the 16-aberration and 1024-aberration experiment. Values of the total number of iterations, calculation time, cost function at convergence, and width of the broadening filter for each experiment are given in Table 1. Figure 9 plots the value of the applied and estimated phase aberrations for a representative case of the 16-aberration and 1024-aberration experiment. The mean difference between the applied and estimated phase aberrations was −0.0846 and 0.6324 rad for the 16-aberration and the 1024-aberration experiments, respectively. The root mean squared difference between the applied and estimated phase aberration was 0.42 and 2.10 rad for the 16-aberration and 1024-aberration experiments, respectively. Figure 10 shows the average (over the three repetitions) ideal, aberrated, and corrected MR-ARFI phase at the focal spot (maximum MR-ARFI phase in the image) for the 16-aberration and the 1024-aberration experiments. Using a single MR-ARFI image as an input to the hybrid simulation-MR-ARFI technique resulted in an average 44% increase of the focal MR-ARFI phase compared to the aberrated pattern for the 16-aberration experiment and a 52% increase in the focal MR-ARFI phase for the 1024-aberration experiment. On average the technique recovered 83% and 39% of the ideal unaberrated focal MR-ARFI phase for the 16-aberrations and 1024-aberration experiments, respectively. The standard deviations for the ideal, aberrated, and corrected focal MR-ARFI phase (in radians) for the 16-aberration experiments were 0.033, 0.012, and 0.016 rad and the 1024-aberration experiments were 0.020, 0.003, 0.003 rad, respectively. Maximum focal MR-ARFI phase of the aberrated and corrected cases were compared using the Wilcoxon–Mann–Whitney two-sample rank-sum test. Median focal MR-ARFI phase in the aberrated and corrected groups were 0.388 and 0.557 rad for the 16-aberration experiments and 0.121 and 0.185 rad for the 1024-aberration experiments; the distributions in the two groups differed significantly (Mann–Whitney U = 0, n1 = n2 = 3, P < 0.05 one tailed, P < 0.10 two-tailed).
Figure 5.
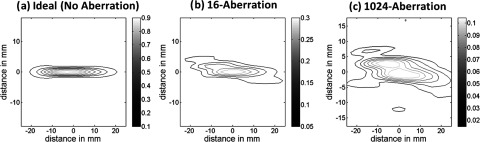
Simulated contour plots of normalized radiation force patterns for the (a) unaberrated (ideal), (b) the 16-aberration case, and (c) the 1024-aberration case are shown. All three patterns are normalized to the maximum radiation force simulated in the ideal (unaberrated) case. The horizontal axis is along the beam propagation direction and the vertical axis is perpendicular (transverse) to the beam propagation direction, depicting changes to the focal zone in both directions due to aberrations.
Figure 6.
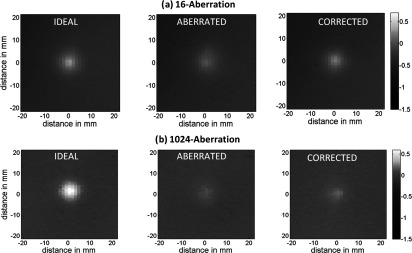
The ideal (unaberrated), aberrated and corrected 2D MR-ARFI displacement phase images (with phase in radians) for a representative case of (a) the 16-aberration and (b) the 1024-aberration experiment are shown. For both experiments, the hybrid simulation MR-ARFI technique used the aberrated image to estimate the corrections.
Figure 7.
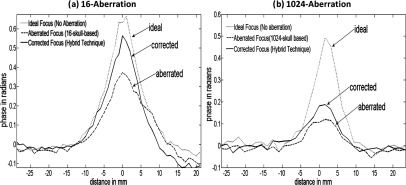
Transverse focal displacement phase profiles are shown for driving the transducer with no aberrations (ideal case) (dotted line), with aberrations (dashed line), and with phase compensation for aberrations using the estimated aberrations from the hybrid simulation-MR-ARFI technique (solid line) for a representative case of the (a) 16-aberration, (b) 1024-aberration experiment.
Figure 8.
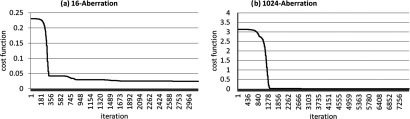
The convergence curves of the optimization routine for a representative case of the (a) 16-aberration and (b) 1024-aberration experiment are shown. The final values for the cost function for the 16-aberration and the 1024-aberration experiment were 0.0024 and 0.076, respectively.
Table 1.
Optimization algorithm performance details.
| Total | Final cost | Width of | ||
|---|---|---|---|---|
| Number of | calculation | function | broadening | |
| Experiment | iterations | time (s) | value | filter (W) (mm) |
| 16-aberration | 3198 | 8296 | 0.0153 | 2.70 |
| 16-aberration | 3200 | 9273 | 0.0243 | 2.70 |
| 16-aberration | 3457 | 9598 | 0.0021 | 2.71 |
| I 024-aberration | 7684 | 12 491 | 0.0284 | 2.71 |
| 1024-aberration | 7650 | 12 800 | 0.0760 | 2.70 |
| I024-aberration | 7476 | 12 134 | 0.0752 | 2.70 |
Figure 9.
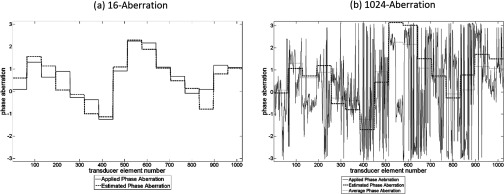
The applied (solid line) and estimated phase (dashed line) aberrations for a representative case of the 16-aberration and 1024-aberration experiment are shown. Figure 9(b) also plots (dotted line) the average phase aberration over each element grouping [equal to the solid line in Fig. 9(a)].
Figure 10.

The maximum MR-ARFI phase at the focus is shown for the three MR-ARFI images ideal, aberrated, and corrected for the three repeated experiments for the (a) 16-aberration and (b) 1024-aberration cases. The standard deviations for the three experiments are shown with the error bars for each image case. An average improvement of 44% is observed in the 16-aberration case and of 52% is observed for the 1024-aberration case. Although a single iteration was shown in this study, several iterations could be performed to improve the results.
DISCUSSION
The complex pressure distribution at the beam's focal plane is the Fourier transform of the aperture function [Eq. (5.15) in Ref. 30] and this information can be used to yield information about the aberrations applied on the transducer surface. Since phase information is lost with MR-ARFI measurement, we cannot recover these aberrations directly. In this proof of concept paper, we demonstrate that a measure of the intensity distribution at the focal plane (that corresponds to the power spectrum of the aperture30) can be used with 3D acoustic beam simulations to estimate and correct for phase aberrations. The hybrid simulation-MR-ARFI technique implemented in this work showed improvement in the maximum MR-ARFI phase at the focal zone using only one MR-ARFI image for correction and no a priori information about the aberrations. As a proof of concept we have used a simplex based optimization algorithm that is easily implemented. Figure 3 shows that in a simulation case, without any noise, the optimization algorithm can find the global minima in the solution parameter space. We demonstrate that even in an experimental case, where a noiseless measurement is not possible, the optimization routine results in a solution that consistently improves the focal MR-ARFI phase across the six experiments.
Two sets of experiments were performed in order to show first how well the algorithm worked when the number of aberration terms matched the number of aberration terms sought. The improvement to the focal MR-ARFI phase was 44% on average with 83% of the ideal focus recovered. The second experiment was designed to show the effect of increasing the actual number of aberrations on the focal spot, using 1024 as would be realistic in a clinical setup. And finally, we see from the experiment how the correction worked when the number of correction terms is smaller than those applied. While the improvement is still significant at 52%, further improvements are needed to recover more of the ideal focal MR-ARFI phase. Both the lower signal-to-noise ratio (SNR) of the initial aberrated MR-ARFI image and the lower number of applied corrections compared to the applied aberrations may have caused this lower improvement. Future work would include adding another iteration of the hybrid simulation-MR-ARFI technique (as shown in loop 2 of Fig. 1) to improve this result or using all 1024-elements for the correction.
The best use of time is a major tradeoff with the technique that was beyond the scope of this work. As can be seen in Fig. 8, the optimization algorithm converged well before the time allotted for the algorithm to run. The four hour calculation time (and hence the correction over 16 effective-elements) was designed to probe the cost function and time tradeoffs of the technique while still performing the experiment within one session. Each experiment was performed in one session to ensure that the positioning of the phantom (which may add additional aberrations) did not introduce variability in the experiment.
In future studies, the maximum number of function calls or the convergence criterion for the optimization routine can be reduced and the algorithm can be run more quickly using faster computers. These will be necessary to bring the computation time down from 4 h on Intel® Core™ i7 laptop (2.70 GHz processor and a 4 GB RAM) to a clinical relevant time of less than 10 min. Further, the time could be used to correct for more terms (the entire 1024-elements of the array) and/or to perform multiple hybrid simulations-MR-ARFI iterations (loop 2 in Fig. 1). Further improvements in calculation speed can be achieved with the use of a genetic search or similar global search optimization algorithm; a global search algorithm will also be less affected by local minima in the solution parameter space.
In this paper, we used an initial estimate of the aberrations that was not based on any information about the skull (zero aberrations were assumed initially). Studies have found that there are some similarities in aberration data across subjects (for example, in a previous work14 the authors found that there is a thickening of the posterior medial section of the skull across the five data sets studied). As more patients are treated and more CT data sets are available, we can utilize such data to generate initial aberration estimates that would speed up the optimization routine. Further, the hybrid simulation-MR-ARFI technique could be used in combination with skull-imaging-derived phase aberration corrections by using them as the initial estimate in the optimization algorithm.
One of the challenges to the clinical translation of this technique is the calibration of the broadening kernel; this term is used to broaden the simulated radiation force to the MR-ARFI phase pattern as shown in Eq. 2. The width of the broadening kernel can be calculated using experimental data where the simulation and experimental images from a known aberrator are compared as done in this study, but will not be possible for a clinical case where the aberrations are not numerical but physical. In those cases, the broadening kernel can be calibrated using displacement simulations, where using the known tissue properties of a media (e.g., by using tissue stiffness coefficient to calculate shear wave propagation speed in a tissue) the displacement map in a tissue can be simulated,12, 20 the radiation force pattern and the displacement pattern may then be compared. These parameters were not available for the tissue mimicking phantom we used; therefore, the calibration method was used.
The SNR of the aberrated MR-ARFI image acquired will affect the accuracy of the corrections estimated using the hybrid simulation-MR-ARFI technique. The region around the focal zone [variable i in Eq. 4] that is used to compare simulations to experiments in the optimization routine cost function depends on the contrast between the focal displacement and the noise floor of the image. In tcMRgFUS treatments, attenuation due to the skull will also reduce (apart from the phase distortions) the focal MR-ARFI phase. In cases where the MR-ARFI phase at the focus is reduced significantly, successive iterations of the hybrid technique (loop 2 in Fig. 1) may be used to recover the focus. Many groups are also looking at special coil designs18, 31 for the clinical transcranial tcMRgFUS systems and using these coils will improve the SNR and the accuracy of the hybrid simulation-MR-ARFI technique.
CONCLUSIONS
In this study, we have demonstrated that this hybrid simulation-MR-ARFI technique can be used to estimate phase aberrations experienced by ultrasound beams. An improvement of the beam focusing was demonstrated using only one MR-ARFI image and no a priori information for the initial aberration estimates. Using successive iterations of the technique and skull-imaging derived initial estimates will improve the performance of this technique.
ACKNOWLEDGMENT
This work was supported by the FUS Foundation, Grant Nos. P01 CA 159992 and R21 EB011559.
References
- Hynynen K. and Sun J., “Trans-skull ultrasound therapy: The feasibility of using image-derived skull thickness information to correct the phase distortion,” IEEE Trans. Ultrason. Ferroelectr. Freq. Control 46(3), 752–755 (1999). 10.1109/58.764862 [DOI] [PubMed] [Google Scholar]
- Aubry J.-F., Tanter M., Pernot M., Thomas J.-L., and Fink M., “Experimental demonstration of noninvasive transskull adaptive focusing based on prior computed tomography scans,” J. Acoust. Soc. Am. 113, 84–93 (2003). 10.1121/1.1529663 [DOI] [PubMed] [Google Scholar]
- Clement G. T. and Hynynen K., “A non-invasive method for focusing ultrasound through the human skull,” Phys. Med. Biol. 47, 1219–1236 (2002). 10.1088/0031-9155/47/8/301 [DOI] [PubMed] [Google Scholar]
- Martin E., Jeanmonod D., Morel A., Zadicario E., and Werner B., “High-intensity focused ultrasound for noninvasive functional neurosurgery,” Ann. Neurol. 66(6), 858–861 (2009). 10.1002/ana.21801 [DOI] [PubMed] [Google Scholar]
- McDannold N., Clement G., Black P., Jolesz F., and Hynynen K., “Transcranial MRI-guided focused ultrasound surgery of brain tumors: Initial findings in three patients,” Neurosurgery 66(2), 323–332 (2010). 10.1227/01.NEU.0000360379.95800.2F [DOI] [PMC free article] [PubMed] [Google Scholar]
- Monteith S. et al. , “Potential intracranial applications of magnetic resonance-guided focused ultrasound surgery,” J. Neurosurg. 118(2), 215–221 (2013). 10.3171/2012.10.JNS12449 [DOI] [PubMed] [Google Scholar]
- Elias W. J. et al. , “A pilot study of focused ultrasound thalamotomy for essential tremor,” N. Engl. J. Med. 369(7), 640–648 (2013). 10.1056/NEJMoa1300962 [DOI] [PubMed] [Google Scholar]
- Marquet F. et al. , “Non-invasive transcranial ultrasound therapy based on a 3D CT scan: Protocol validation and in vitro results,” Phys. Med. Biol. 54(9), 2597–2613 (2009). 10.1088/0031-9155/54/9/001 [DOI] [PubMed] [Google Scholar]
- McDannold N. and Maier S. E., “Magnetic resonance acoustic radiation force imaging,” Med. Phys. 35(8), 3748–3758 (2008). 10.1118/1.2956712 [DOI] [PMC free article] [PubMed] [Google Scholar]
- Radicke M. et al. , “New image contrast method in magnetic resonance imaging via ultrasound,” Hyperfine Interact. 181(1–3), 21–26 (2008). 10.1007/s10751-008-9628-6 [DOI] [Google Scholar]
- Kaye E. A., Chen J., and Pauly K. B., “Rapid MR-ARFI method for focal spot localization during focused ultrasound therapy,” Magn. Reson. Med. 65(3), 738–743 (2011). 10.1002/mrm.22662 [DOI] [PMC free article] [PubMed] [Google Scholar]
- Larrat B. et al. , “MR-guided transcranial brain HIFU in small animal models,” Phys. Med. Biol. 55(2), 365–388 (2010). 10.1088/0031-9155/55/2/003 [DOI] [PMC free article] [PubMed] [Google Scholar]
- Larrat B., Pernot M., Montaldo G., Fink M., and Tanter M., “MR-guided adaptive focusing of ultrasound,” IEEE Trans. Ultrason. Ferroelectr. Freq. Control 57(8), 1734–1747 (2010). 10.1109/TUFFC.2010.1612 [DOI] [PMC free article] [PubMed] [Google Scholar]
- Kaye E. A. et al. , “Application of Zernike polynomials towards accelerated adaptive focusing of transcranial high intensity focused ultrasound,” Med. Phys. 39(10), 6254–6263 (2012). 10.1118/1.4752085 [DOI] [PMC free article] [PubMed] [Google Scholar]
- Marsac L. et al. , “MR-guided adaptive focusing of therapeutic ultrasound beams in the human head,” Med. Phys. 39(2), 1141–1149 (2012). 10.1118/1.3678988 [DOI] [PMC free article] [PubMed] [Google Scholar]
- Hertzberg Y., Volovick A., Zur Y., Medan Y., Vitek S., and Navon G., “Ultrasound focusing using magnetic resonance acoustic radiation force imaging: Application to ultrasound transcranial therapy,” Med. Phys. 37(6), 2934–2942 (2010). 10.1118/1.3395553 [DOI] [PubMed] [Google Scholar]
- Eames M., Hananel A., Kassell N. F., and Snell J. W., “Intracranial treatment envelope mapping of transcranial focused ultrasound,” AIP Conf. Proc. 1503, 181–184 (2012). 10.1063/1.4769940 [DOI] [Google Scholar]
- Focused Ultrasound Surgery Foundation, “White Paper,” in Brain Workshop 3, 2011.
- Pajek D. and Hynynen K., “The design of a focused ultrasound transducer array for the treatment of stroke: A simulation study,” Phys. Med. Biol. 57(15), 4951–4968 (2012). 10.1088/0031-9155/57/15/4951 [DOI] [PMC free article] [PubMed] [Google Scholar]
- Palmeri M. L., Sharma A. C., Bouchard R. R., Nightingale R. W., and Nightingale K. R., “A finite-element method model of soft tissue response to impulsive acoustic radiation force,” IEEE Trans. Ultrason. Ferroelectr. Freq. Control 52(10), 1699–1712 (2005). 10.1109/TUFFC.2005.1561624 [DOI] [PMC free article] [PubMed] [Google Scholar]
- Kaye E. A. and Pauly K. B., “Adapting MRI acoustic radiation force imaging for in vivo human brain focused ultrasound applications,” Magn. Reson. Med. 69(3), 724–733 (2013). 10.1002/mrm.24308 [DOI] [PMC free article] [PubMed] [Google Scholar]
- Vyas U. and Christensen D., “Ultrasound beam simulations in inhomogeneous tissue geometries using the hybrid angular spectrum method,” IEEE Trans. Ultrason. Ferroelectr. Freq. Control 59(6), 1093–1100 (2012). 10.1109/TUFFC.2012.2300 [DOI] [PubMed] [Google Scholar]
- Fairchild A., “ICRU Report 61: Providing reference data for tissue properties,” J. Acoust. Soc. Am. 105(2), 1324 (1999). 10.1121/1.426203 [DOI] [Google Scholar]
- Mahoney K., Fjield T., McDannold N., Clement G., and Hynynen K., “Comparison of modelled and observed in vivo temperature elevations induced by focused ultrasound: Implications for treatment planning,” Phys. Med. Biol. 46(7), 1785–1798 (2001). 10.1088/0031-9155/46/7/304 [DOI] [PubMed] [Google Scholar]
- Payne A., Vyas U., Todd N., de Bever J., Christensen D. A., and Parker D. L., “The effect of electronically steering a phased array ultrasound transducer on near-field tissue heating,” Med. Phys. 38(9), 4971–4981 (2011). 10.1118/1.3618729 [DOI] [PMC free article] [PubMed] [Google Scholar]
- Christensen D. and Almquist S., “Incorporating tissue absorption and scattering in rapid ultrasound beam modeling,” Proc. SPIE 8584(7) (2013). 10.1117/12.2008021 [DOI] [Google Scholar]
- Duck F. A., Physical Properties of Tissue: A Comprehensive Reference Book (Academic, London, 1990). [Google Scholar]
- Skovoroda A. et al. , “Quantitative analysis of the mechanical characteristics of pathologically altered soft biological tissues,” Biophysics 40(6), 1359–1364 (1995). [PubMed] [Google Scholar]
- Lagarias J. C., Reeds J. A., Wright M. H., and Wright P. E., “Convergence properties of the Nelder–Mead simplex method in low dimensions,” SIAM J. Optim. 9(1), 112–147 (1998). 10.1137/S1052623496303470 [DOI] [Google Scholar]
- Goodman J. W., Introduction to Fourier Optics, 3rd ed. (Roberts and Company, Greenwood Village, 2004). [Google Scholar]
- Minalga E., Payne A., Merrill R., Todd N., Parker D., and Hadley J., “A 6-channel brain coil for MR guided high intensity ultrasound,” in Proceedings of the 20th Annual Meeting of ISMRM (Melbourne, Australia, 2012), p. 2662.