Abstract
Purpose: The pharmacokinetic parameters derived from dynamic contrast-enhanced (DCE) MRI have been used in more than 100 phase I trials and investigator led studies. A comparison of the absolute values of these quantities requires an estimation of their respective probability distribution function (PDF). The statistical variation of the DCE-MRI measurement is analyzed by considering the fundamental sources of error in the MR signal intensity acquired with the spoiled gradient-echo (SPGR) pulse sequence.
Methods: The variance in the SPGR signal intensity arises from quadrature detection and excitation flip angle inconsistency. The noise power was measured in 11 phantoms of contrast agent concentration in the range [0–1] mM (in steps of 0.1 mM) and in one in vivo acquisition of a tumor-bearing mouse. The distribution of the flip angle was determined in a uniform 10 mM CuSO4 phantom using the spin echo double angle method. The PDF of a wide range of T1 values measured with the varying flip angle (VFA) technique was estimated through numerical simulations of the SPGR equation. The resultant uncertainty in contrast agent concentration was incorporated in the most common model of tracer exchange kinetics and the PDF of the derived pharmacokinetic parameters was studied numerically.
Results: The VFA method is an unbiased technique for measuring T1 only in the absence of bias in excitation flip angle. The time-dependent concentration of the contrast agent measured in vivo is within the theoretically predicted uncertainty. The uncertainty in measuring Ktrans with SPGR pulse sequences is of the same order, but always higher than, the uncertainty in measuring the pre-injection longitudinal relaxation time (T10). The lowest achievable bias/uncertainty in estimating this parameter is approximately 20%–70% higher than the bias/uncertainty in the measurement of the pre-injection T1 map. The fractional volume parameters derived from the extended Tofts model were found to be extremely sensitive to the variance in signal intensity. The SNR of the pre-injection T1 map indicates the limiting precision with which Ktrans can be calculated.
Conclusions: Current small-animal imaging systems and pulse sequences robust to motion artifacts have the capacity for reproducible quantitative acquisitions with DCE-MRI. In these circumstances, it is feasible to achieve a level of precision limited only by physiologic variability.
Keywords: quantitative imaging, DCE-MRI uncertainty, T1 uncertainty
INTRODUCTION
Dynamic contrast-enhanced (DCE) MRI provides a noninvasive measurement of the time-dependent concentration of an injected contrast agent (CA). The kinetic curves observed in the tissue of interest are subsequently incorporated into a pharmacologic model describing the underlying physiologic process. This method is used extensively in the measurement of hemodynamic parameters. The most widely reported measures are the rate of transport of the CA across the endothelium barrier (Ktrans, ke), the fractional volume of the extravascular-extracellular space (ve), the fractional volume of the plasma space (vp), and the initial area under the contrast concentration curve (AUC). In tumor studies, the pharmacokinetic models, their respective measures, and the conditions under which the outputs may be correctly interpreted, have been recently reviewed in detail.1
In the clinical domain, more than 100 phase I trials and investigator-led studies of antiangiogenic and vascular-disrupting therapeutic agents have incorporated as end-points the functional parameters from DCE-MRI.2 The reported therapeutic effects are in the range of 5% − 97% decrease in Ktrans, 27% − 50% decrease in vp, and 36% − 50% decrease in AUC.2 A comparison of the absolute values of these quantities, e.g., across a population or in a longitudinal study, requires an estimation of their respective probability distribution functions (PDF). Such knowledge is critical in selecting the appropriate statistical test for determining significance and confidence intervals. The estimation of the PDF from a region of interest (ROI) in the image may be incorrect given that tumors exhibit a highly heterogeneous spatial distribution of the DCE-MRI parameters.3
The aim of this work is to determine the statistical variation of the pharmacokinetic parameters measured with DCE-MRI. The probability density function of these measures is estimated by analyzing the fundamental sources of error in the MR signal acquired with the spoiled gradient-echo (SPGR) pulse sequence. These results extend and complement previous research studying the uncertainty in measuring the contrast agent concentration4 and the functional DCE-MRI parameters.5, 6
MATERIALS AND METHODS
Theory
The magnitude of the SPGR signal at pixel is given by
| (1) |
where is proportional to the equilibrium longitudinal magnetization and the system gain function. The T2* term is assumed to equal unity. In this study, TE = 0.02 ms; for the typical values of T2* found in tumors,7 the error arising from the above assumption is <0.1%. Equation 1 can then be linearized voxel-wise as
| (2) |
A varying flip-angle acquisition (VFA) with α = {α1, …, αN} and fixed TR is used to measure S(αi). The T1 and S0 maps are obtained by solving
| (3) |
The magnitude of follows a Rician distribution. If SNR > 5,
| (4) |
where N(⋅⋅⋅) denotes the normal distribution, is the true pixel intensity determined from Eq. 1, and σ2 is the noise power of the real and imaginary acquisition channels.8, 9 The noise power can be measured independently in an artifact-free image with no NMR signal.9 In the absence of flow and susceptibility artifacts, Eq. 4 characterizes the noise properties of the MR signal to an accuracy of better than 2%.10
The mean value of the magnitude of the SPGR signal is dependent on three system variables: , TR, and α. We assume the gain function contained in is uniform and the timing parameters TR/TE are known with absolute certainty. The spatial distribution of the excitation flip angle (α) is determined by the amplitude and shape of the field. In turn, the distribution of the field is a function of the shape of the object being scanned, its electromagnetic properties, the resonance frequency (main magnetic field), the RF-pulse design (hard vs slice selective or adiabatic), and the polarization of the radiofrequency coil.11 For a given object, , and hence , can be measured with a spin-echo pulse sequence using the double angle method (DAM).12 This technique has the advantage of being independent of the coil sensitivity; its main disadvantage is the impractically long scan time.
Given a fixed set of imaging parameters, after the injection of a contrast agent, the signal intensity from the SPGR sequence is only a function of the time-varying T1. Using the formalism of Schabel and Parker, the relative signal enhancement is given by4
| (5) |
with the subscript denoting the native (pre-injection) quantities. Equation 5 may be readily solved for the relaxation rate R1 = 1/T1
| (6) |
In the fast exchange limit, the functional dependence of the CA concentration on the longitudinal relaxation rate is13
| (7) |
where r1 is the longitudinal relaxivity of the injected contrast agent.
The temporal evolution of the concentration of the contrast agent is widely believed to arise from a two compartment exchange system described by the extended Tofts model14
| (8) |
where Cp(t) is the arterial input function (AIF), vp is the fractional volume of the plasma compartment, ve is the fractional volume of the extravascular-extracellular space (EES), and Ktrans is the rate constant for the transfer of the contrast agent from plasma to EES measured in ml/s of contrast agent per ml of tissue. Equation 8 can be written in matrix form15
| (9) |
where n is the total number of time points.
Simulations
In DCE-MRI, the concentration of the contrast agent is only a function of the change in the longitudinal relaxation time. Thus, the accuracy and precision of the pharmacokinetic parameters derived from this technique depend on the accuracy and precision with which T1 can be measured. Based on Eq. 7, two separate terms need to be considered: the statistical variation in the measurement of T10 and the statistical variation in the measurement of the change in T1.
The VFA method is able to provide accurate and precise measurements of T10 using two predetermined nutation angles.16 The pair of flip angles is chosen such that the variance of a single T10 is minimized. A variable degree of precision would be achieved in vivo given that a range of relaxation times are measured. Consider a single pixel at position with a true longitudinal relaxation and equilibrium magnetization . Assume that at this location α arises from a distribution Dα. Given the prescribed flip angle , we represent
| (10) |
where and equal the mean and the standard deviation of Dα. In this context, the quantity αSNR describes the precision of attaining , while δα is a measure of the accuracy (bias). Under these conditions, we are interested in determining the probability distribution function of . An analytic expression for error propagation when inverting a matrix [Eq. 3] with elements of unequal variance in not known. Hence, the PDF of in the range [100–4000] ms (in steps of 50 ms) was estimated through numerical simulations of Eq. 3 with α = {2o, 10o}. The distribution of the signal intensity at position was calculated using Eqs. 1, 4, with the flip angle distribution described by Eq. 10. The simulation was repeated 106 times.
The degree of uncertainty and bias in concentration measurements using the SPGR pulse sequence has been previously studied in detail.4 The variance of the concentration is calculated by
| (11) |
where NB is the number of baseline scans (number of pre-injection scans) and SNR is the signal-to-noise ratio of the imaging sequence. Note that Eq. 11 assumes the contrast agent does not change T2*. A bias in the native longitudinal relaxation (δT10) or in the excitation flip angle (δα) would lead to a bias in the calculation of the concentration:
| (12) |
The partial derivatives are obtained by implicit differentiation of Eq. 5.
Finally, assume that at the pixel in position , the pharmacokinetic parameters are given by the triplet . Using the population AIF reported by Loveless et al.,17 the true time-varying concentration was calculated using Eq. 8. The measured concentration was then assumed to arise from
| (13) |
Equation 13 was used to generate 104 different C(t) and Cp(t) curves. The imaging parameters were: TR/TE = 5/0.02 ms, NEX = 1, α = 10o, NB = 12, and 10 s temporal resolution. The probability distribution function of the triplets was determined by solving Eq. 9.
Measurements
Experiments were performed on a 7T small-animal, MRI scanner (Bruker BioSpin MRI GmbH, Ettlingen, Germany) equipped with self-shielded gradient coils having a maximum gradient strength of 450 mT/m and rise time of 110 μs. An actively detuned volume excite RF-coil was used in conjunction with a four-element array coil for surface receive.
The pulse sequence and the k-space sampling strategy used in this study have been described elsewhere.3 The acquisition parameters were: FOV = 20 mm3, matrix = 1283, TR/TE = 5/0.02 ms, NEX = 1, α = 10o, and 10 s temporal resolution. A rect pulse with a length of 20 μs was used for excitation. The raw data from each channel in the four-element array coil were separately reconstructed using the regridding method and combined with the Sum-of-Squares technique.18 The pre-injection longitudinal relaxation time was measured with the variable flip-angle acquisition using the same acquisition parameters and α = {2o, 10o}. The noise power of the sequence with the above parameters was measured in 11 phantoms of CA concentration in the range [0−1] mM (in steps of 0.1 mM) and in one in vivo acquisition of a tumor-bearing mouse. The range of phantom concentrations was chosen to be representative of the range encountered in a typical small animal DCE-MRI study.3
The distribution of the flip angle was measured in a uniform 10 mM CuSO4 phantom using the spin echo DAM with the following parameters: FOV = 20 mm3, matrix = 128 × 128 × 100, TR/TE = 4000/25 ms, NEX = 20, α = {40o, 80o}. A rect pulse with a length of 20 μs was used for excitation and refocusing. The DAM acquisition was repeated with α = {30o, 60o} for comparison with the α = {40o, 80o} results.
All animal studies were approved by the Duke University Institutional Animal Care and Use Committee. A DCE-MRI dataset was acquired in a tumor-bearing (tumor volume ≈470 μl) nu/nu mouse with the LS174t cell line implanted in the mammary fat pad (Charles River Laboratories Wilmington, MA). A custom-made animal positioning system was used to maintain the mouse under anesthesia by isoflurane delivery via a nose cone. Body temperature was controlled between 36°C and 37°C by circulating warm water. The contrast agent was injected after the acquisition of twelve baseline scans (NB = 12); dynamic imaging lasted for approximately 20 min postinjection. An automatic syringe pump (KD Scientific Inc., Holliston, MA) provided a consistent contrast injection. Gd-DTPA (Magnevist, Schering AG, Berlin, Germany) was administered as a bolus via a 27-gauge tail vein catheter at a dose of 0.5 mmol/kg and flow rate of 2.4 ml/min as described by Loveless et al.17 At 7T, the longitudinal relaxivity of Magnevist in blood plasma is r1 = 3.275 mM−1s−1.19
RESULTS
Uncertainty and bias in measurements
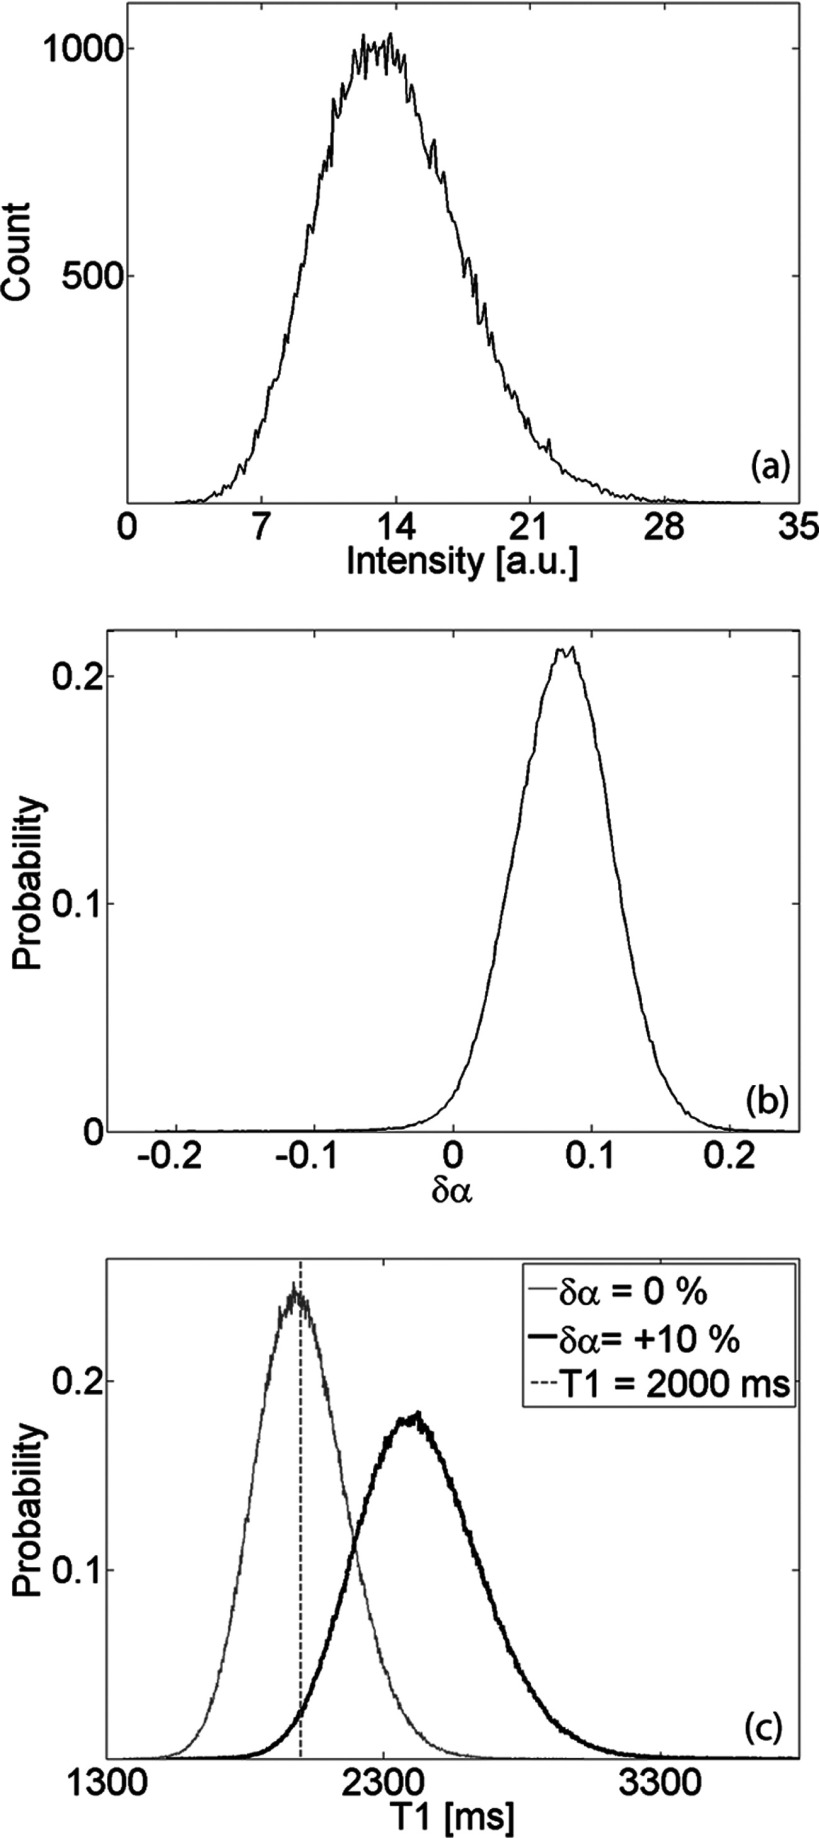
The mean value of the SPGR signal is dependent on three system variables: , TR, and α. The distribution of the signal is dependent on the noise power and the distribution of the flip angle. Figure 1a shows a representative histogram of the signal intensity in an artifact-free background region, while Fig. 1b plots the flip angle distribution measured with the spin echo DAM. In phantoms with varying Magnevist concentration, the standard deviation of the noise was found to be σ = (0.057 ± 0.002)% of the mean of S0. The distribution of the flip angle measured in the CuSO4 phantom is described by
| (14) |
Figure 1.
(a) Representative histogram of signal intensity in artifact-free background ROI (region with no NMR signal). The noise power equals the variance of the measured distribution. (b) Distribution of excitation flip angle (referenced with respect to prescribed flip angle) measured in uniform CuSO4 phantom. (c) Estimated PDF of T10 in a single pixel with for two cases: no bias in flip angle (αSNR ≈ 30, δα = 0) and distribution given in panel (b).
Figure 1c displays the estimated PDF of T10 in a single pixel with for two cases: no bias in flip angle (αSNR ≈ 30, δα = 0) and distribution described by Eq. 14. Notice that a flip angle bias would not only bias the mean of T10, but it would also decrease the precision with which it can be measured.
The estimated probability distribution function of T10 was characterized by two main parameters
| (15) |
where DT1 represents the PDF of T10, is the mean, is the standard deviation, and is the true longitudinal relaxation rate. The quantity T1SNR is an indicator of the precision of the measurement technique, while δT1 describes its accuracy (bias). The asymmetry of the PDF was studied through an analysis of the skewness of DT1.
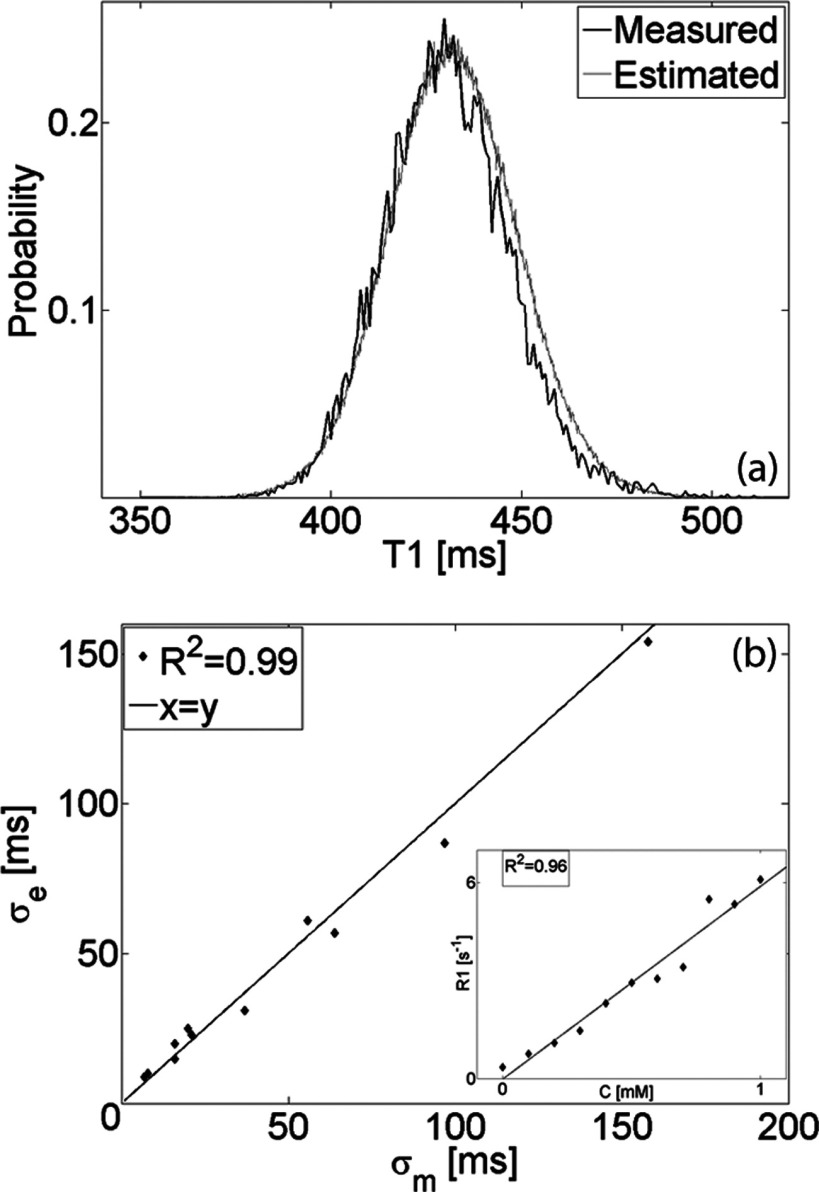
The variance of the T10 distribution estimated numerically was compared with the variance of the distribution measured in 11 uniform phantoms of increasing longitudinal relaxation rate. Figure 2a depicts the measured histogram of T10 in an ROI of ≈104 pixels and the estimated PDF of a single pixel with the same mean T10. The estimated standard deviation (σe) is plotted in Fig. 2b as a function of the standard deviation measured (σm) in phantoms with increasing CA concentration (inset shows relation between the concentration C[mM] and measured relaxation rate R1 [s−1]).
Figure 2.
(a) Comparison of T10 distribution estimated numerically with distribution measured in an ROI of ≈104 pixels in uniform phantom. (b) Estimated (σe) vs measured (σm) T10 standard deviation in phantoms with increasing CA concentration (inset shows relation between the concentration C [mM] and measured relaxation rate R1 [s−1]).
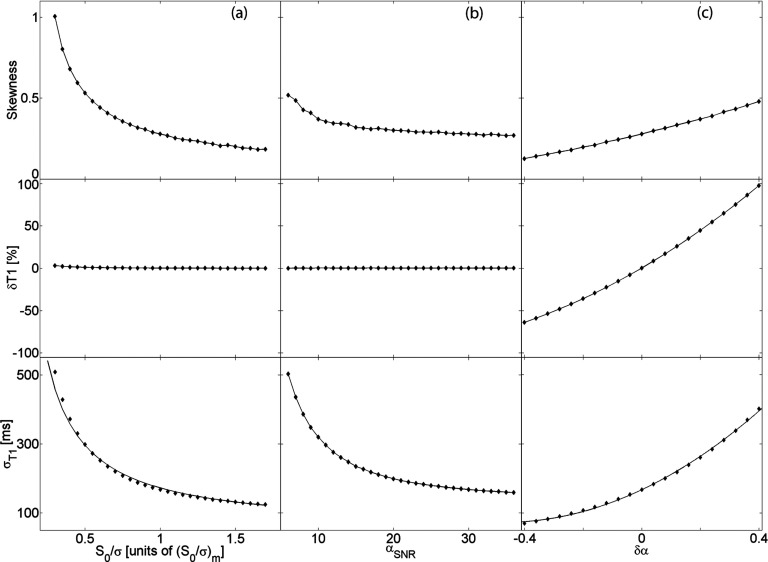
The uncertainty and bias in the measurement of the spin-lattice relaxation time arises from the distribution of the SPGR signal intensity. This dependence was studied by numerical simulations of Eq. 3 and the results are described in Figs. 34. In the context of DCE-MRI, since the contrast agent does not have an effect on the equilibrium magnetization, we define the measured ratio
| (16) |
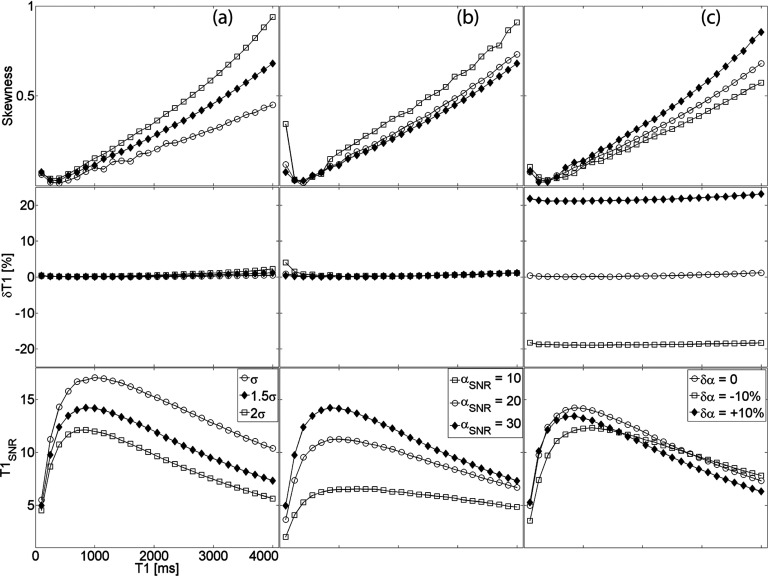
as the intrinsic SNR of the pulse sequence (with the specific image acquisition parameters listed above). Figure 3 examines the standard deviation, percent deviation, and the skewness of the PDF of in the presence of varying intrinsic SNR, αSNR, and flip angle bias. Figure 3a shows the effect of the intrinsic SNR assuming the flip angle is known with absolute certainty. The flip angle uncertainty is subsequently added to the simulation revealing the dependence in Fig. 3b. Lastly, we incorporate a flip angle bias and demonstrate the effect on T10 measurements in Fig. 3c. This analysis is extended to longitudinal relaxation times in the range as shown in Fig. 4.
Figure 3.
(a) Uncertainty and bias in T10 measurements as a function of (a) intrinsic SNR, (b) flip angle uncertainty, and (c) flip angle bias. Graphs in each column have the same x-axis as the respective lower graph; graphs in each row have the same y-axis as the respective leftmost graph.
Figure 4.
(a) Uncertainty and bias in T1 measurements as a function of longitudinal relaxation time in the presence of varying (a) noise power, (b) flip angle uncertainty, and (c) flip angle bias. All graphs have the same x-axis; the legends in the bottom row are column-specific.
Uncertainty and bias in DCE-MRI parameters
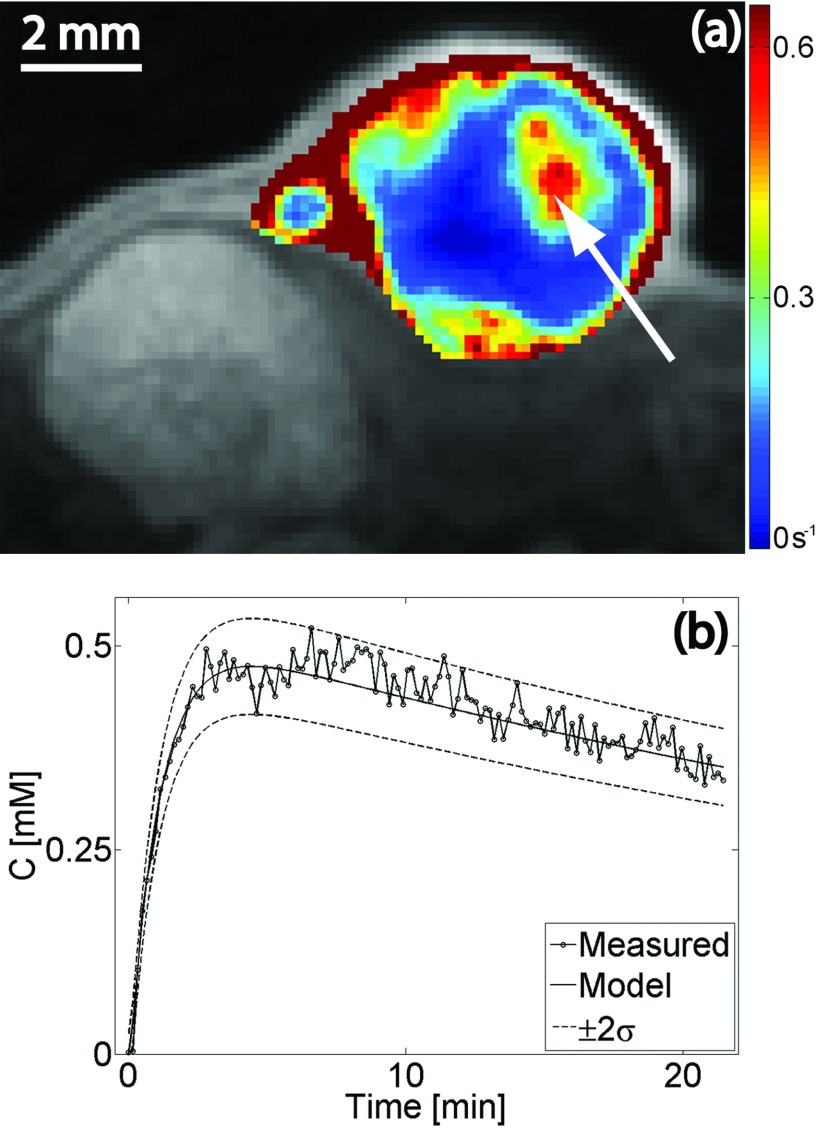
The noise power in the in vivo acquisition was in the range of the noise measured in the phantoms with varying contrast agent concentration. The intrinsic SNR was found to be (S0/σ)m ≈ 0.056%. The pre-injection longitudinal relaxation time in the tumor volume (manually segmented to exclude fatty tissue in the encapsulating epithelial sack) was in the range (μ ± 2σ) 1.58–2.88 s. Figure 5a presents an overlay of the Ktrans map on a contrast-enhanced T1-weighted image from a central slice in the tumor. The time dependence of the CA concentration in a single pixel (arrow) is plotted in Fig. 5b. The predicted curve obtained by solving Eq. 8 and the uncertainty estimated by Eq. 11 are superimposed on the measured concentration curve. Note that the graphs depicting the uncertainty (±2σ) were calculated using the concentration curve found by solving the pharmacokinetic model in Eq. 8.
Figure 5.
(a) Overlay of Ktrans map on a contrast-enhanced T1-weighted image from a central slice in the tumor. (b) Time-varying contrast agent concentration in a single pixel [arrow in panel (a)]. The predicted curve obtained by solving Eq. 8 and the uncertainty estimated by Eq. 11 are superimposed on the measured concentration curve.
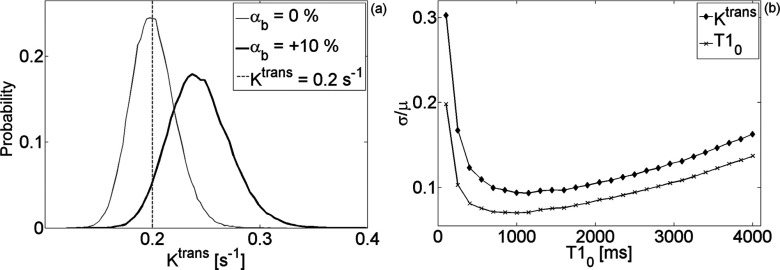
The probability distribution function of the CA concentration curve was used to estimate the uncertainty of the pharmacokinetic parameters measured with DCE-MRI. Figure 6a demonstrates the effect of flip angle bias (and consequently T1 bias) on a single pixel with Ktrans = 0.2 s−1 while Fig. 6b compares the coefficient of variation of Ktrans to the coefficient of variation of . Table 1 lists the range of the coefficient of variation and bias for ve and vp; for the volume parameters, the relation to the variance of was intractable.
Figure 6.
(a) Representative distributions demonstrating the effect of flip angle bias (and consequently T1 bias) on a single pixel with Ktrans = 0.2s−1. (b) Coefficient of variation of Ktrans and of T10 for the range of studied in this work.
Table 1.
Range of coefficient of variation and bias for ve and vp.
| σ/μ [min ; max] | δ [min ; max]% | |
|---|---|---|
| ve | [−3.42; −0.01] | [−3170; −118] |
| vp | [−0.2; 0.9] | [−112; −86] |
DISCUSSION
In quadrature detection, the signal intensity in an artifact-free image with no NMR signal is Rayleigh distributed.9 For acquisitions with an n-element array coil and Sum-of-Squares reconstruction, the noise power is unchanged while the SNR scales approximately as . Notice in Fig. 1a the effect of this reconstruction on the shape of the distribution.
The distribution of the excitation flip angle is a function of the shape of the object being scanned, its electromagnetic properties, the main magnetic field, the RF-pulse design (hard vs slice selective or adiabatic), and the polarization of the radiofrequency coil. In a uniform CuSO4 phantom, we found that the distribution of the flip angle from a rect pulse resembles a Gaussian distribution with the parameters given in Eq. 14.
Under these conditions, the variance of the pre-injection longitudinal relaxation time measured with the VFA technique can be predicted for a wide range of T10 values, as shown in Fig. 2. For , the uncertainty (standard deviation) of the measurement is inversely proportional to the intrinsic SNR of the pulse sequence [Fig. 3a]. While the bias is negligible, at low intrinsic SNR the distribution tends farther from a Gaussian and has a positive skewness. Figure 3b demonstrates the effect of flip angle uncertainty on the measurement of T10. Again, the standard deviation is inversely proportional to αSNR and the bias insignificant. Although the skewness is low, our simulations reveal that even at relatively high αSNR the T10 distribution is asymmetric. Finally, we find that the bias in T10 measurements is mainly caused by the bias in the excitation flip angle [Fig. 3c]. The uncertainty depends approximately on the square of the flip angle bias. Surprisingly, a negative bias decreases the standard deviation of the T10 distribution leading to a more precise measurement of an underestimated relaxation time.
The findings for apply reasonably well to T10 values in the range [100–4000] ms. Figure 4 uncovers the dependence of the precision and the accuracy of the VFA measurement technique on the pre-injection relaxation time. Unavoidably, the choice of two flip angles, in our case α = {2o, 10o}, leads to a narrow domain of T10 values where the uncertainty is minimized.
An understanding of the sources of error in determining the longitudinal relaxation time allows for the prediction of the uncertainty in the estimation of the concentration of the injected contrast agent. The assumption inherent in the fast-exchange limit [Eq. 7] seems to be satisfied in the range of concentrations encountered in a typical in vivo study [inset in Fig. 2b]. The temporal evolution of the CA concentration from a single pixel in a highly permeable region is shown in Fig. 5b. The estimated uncertainty superimposed on the solution to Eq. 8 reveals that Eq. 13 provides a reasonably accurate prediction for concentration variance. Given the location of the tumor [notice kidney in Fig. 5a], it is remarkable that signal changes caused by motion artifacts are still within the uncertainty estimated in Eq. 13: this equation assumes no motion artifacts. Consequently, we can confidently estimate the uncertainty in the pharmacokinetic parameters derived from DCE-MRI measurements using the SPGR pulse sequence. In Fig. 6b, we find that the coefficient of variation of Ktrans follows closely that of the pre-injection T1; the uncertainty in estimating Ktrans is on the order of, but always higher than, the uncertainty of T10. This suggests a simple rule of thumb: the SNR of the pre-injection T1 map indicates the limiting precision with which Ktrans can be calculated. The lowest achievable bias/uncertainty in estimating this parameter is approximately 20%–70% higher than the bias/uncertainty in the measurement of the pre-injection T1 map. We find no such rule for the volume of the plasma and the extravascular-extracellular space. Note that the results presented in Fig. 6 describe the probability distribution function of Ktrans in a single pixel. In a uniform ROI containing N pixels, the variance will be reduced by a factor of approximately N.
The analysis presented here assumes the statistical variability in signal intensity arises primarily during quadrature detection (i.e., instrumental noise). This approach has the advantage of allowing for the evaluation of the uncertainty and bias of the DCE-MRI parameters as a function of the noise power. The dependence of the noise power on the pulse sequence and hardware platform has been described in detail elsewhere.8
The term “physiologic variability” is used to describe the error introduced in the modeling phase; uncertainties arising due to discrepancies between the assumptions in the pharmacokinetic model and the underlying physiologic process. We appreciate the critical importance of a patient-specific arterial input function and recognize the additional error introduced when assuming a population-derived AIF. This issue has been previously studied in the preclinical17 and clinical domain.20 The effect of transmembrane water diffusion has also been examined at length.13, 21 The accuracy and precision of the DCE-MRI parameters is further affected by the temporal resolution and total scan time.22, 23
The results of this work apply to a wide range of pre-injection T1 values, noise power, and flip angle uncertainty. As the inversion problem posed by Eq. 8 does not have an analytic solution, we believe our findings can be justified by the following heuristic: the calculation of Ktrans depends on the calculation of the contrast agent concentration, which in turn depends on the longitudinal relaxation time. Hence, the uncertainty of the pre-injection T1 must limit the uncertainty of the contrast agent concentration, which in turn limits the uncertainty of Ktrans.
CONCLUSIONS
We demonstrate that the limit on the uncertainty of Ktrans is the uncertainty in the measurement of the pre-injection T1 map. The lowest achievable bias/uncertainty in estimating this parameter is approximately 20%–70% higher than the bias/uncertainty in the measurement of the pre-injection T1 map. Current small-animal imaging systems and pulse sequences robust to motion artifacts have the capacity for reproducible quantitative acquisitions with DCE-MRI. The uncertainty in the pharmacokinetic parameters derived from these studies can be readily minimized by decreasing the uncertainty in T10 measurements. In these circumstances, it is feasible to achieve a level of precision limited only by physiologic variability and to exploit the heterogeneity of tumor Ktrans as a more sensitive biomarker for therapeutic response.
ACKNOWLEDGMENTS
This work was performed at the Duke Center for In Vivo Microscopy, an NIH/NIBIB National Biomedical Technology Resource Center (P41 EB015897). The authors wish to thank Dr. Yi Qi for help with animal handling and Ms. Sally Zimney for the careful editorial assistance.
References
- Sourbron S. P. and Buckley D. L., “On the scope and interpretation of the Tofts models for DCE-MRI,” Magn. Reson. Med. 66(3), 735–745 (2011). 10.1002/mrm.22861 [DOI] [PubMed] [Google Scholar]
- O’Connor J. P. B., Jackson A., Parker G. J. M., Roberts C., and Jayson G. C., “Dynamic contrast-enhanced MRI in clinical trials of antivascular therapies,” Nat. Rev. Clin. Oncol. 9(3), 167–177 (2012). 10.1038/nrclinonc.2012.2 [DOI] [PubMed] [Google Scholar]
- Subashi E. et al. , “A comparison of radial keyhole strategies for high spatial and temporal resolution 4D contrast-enhanced MRI in small animal tumor models,” Med. Phys. 40(2), 022304 (10pp.) (2013). 10.1118/1.4774050 [DOI] [PMC free article] [PubMed] [Google Scholar]
- Schabel M. C. and Parker D. L., “Uncertainty and bias in contrast concentration measurements using spoiled gradient echo pulse sequences,” Phys. Med. Biol. 53(9), 2345–2373 (2008). 10.1088/0031-9155/53/9/010 [DOI] [PMC free article] [PubMed] [Google Scholar]
- Kershaw L. E. and Buckley D. L., “Precision in measurements of perfusion and microvascular permeability with T1-weighted dynamic contrast-enhanced MRI,” Magn. Reson. Med. 56(5), 986–992 (2006). 10.1002/mrm.21040 [DOI] [PubMed] [Google Scholar]
- Barnes S. L., Whisenant J. G., Loveless M. E., Ayers G. D., and Yankeelov T. E., “Assessing the reproducibility of dynamic contrast enhanced magnetic resonance imaging in a murine model of breast cancer,” Magn. Reson. Med. 69(6), 1721–1734 (2013). 10.1002/mrm.24422 [DOI] [PMC free article] [PubMed] [Google Scholar]
- Vautier J., Heilmann M., Walczak C., Mispelter J., and Volk A., “2D and 3D radial multi-gradient-echo DCE MRI in murine tumor models with dynamic R*2-corrected R1 mapping,” Magn. Reson. Med. 64(1), 313–318 (2010). 10.1002/mrm.22396 [DOI] [PubMed] [Google Scholar]
- Macovski A., “Noise in MRI,” Magn. Reson. Med. 36(3), 494–497 (1996). 10.1002/mrm.1910360327 [DOI] [PubMed] [Google Scholar]
- Gudbjartsson H. and Patz S., “The Rician distribution of noisy MRI data,” Magn. Reson. Med. 34(6), 910–914 (1995). 10.1002/mrm.1910340618 [DOI] [PMC free article] [PubMed] [Google Scholar]
- Henkelman R. M., “Measurement of signal intensities in the presence of noise in MR images,” Med. Phys. 12(2), 232–233 (1985). 10.1118/1.595711 [DOI] [PubMed] [Google Scholar]
- Glover G. H. et al. , “Comparison of linear and circular polarization for magnetic resonance imaging,” J. Magn. Reson. 64(2), 255–270 (1985). 10.1016/0022-2364(85)90349-X [DOI] [Google Scholar]
- Stollberger R. and Wach P., “Imaging of the active B1 field in vivo,” Magn. Reson. Med. 35(2), 246–251 (1996). 10.1002/mrm.1910350217 [DOI] [PubMed] [Google Scholar]
- Landis C. S. et al. , “Determination of the MRI contrast agent concentration time course in vivo following bolus injection: Effect of equilibrium transcytolemmal water exchange,” Magn. Reson. Med. 44(4), 563–574 (2000). [DOI] [PubMed] [Google Scholar]
- Tofts P. S., “Modeling tracer kinetics in dynamic Gd-DTPA MR imaging,” J. Magn. Reson. Imaging 7(1), 91–101 (1997). 10.1002/jmri.1880070113 [DOI] [PubMed] [Google Scholar]
- Murase K., “Efficient method for calculating kinetic parameters using T1-weighted dynamic contrast-enhanced magnetic resonance imaging,” Magn. Reson. Med. 51(4), 858–862 (2004). 10.1002/mrm.20022 [DOI] [PubMed] [Google Scholar]
- Deoni S. C. L., Rutt B. K., and Peters T. M., “Rapid combined T1 and T2 mapping using gradient recalled acquisition in the steady state,” Magn. Reson. Med. 49(3), 515–526 (2003). 10.1002/mrm.10407 [DOI] [PubMed] [Google Scholar]
- Loveless M. E. et al. , “A quantitative comparison of the influence of individual versus population-derived vascular input functions on dynamic contrast enhanced-MRI in small animals,” Magn. Reson. Med. 67(1), 226–236 (2012). 10.1002/mrm.22988 [DOI] [PMC free article] [PubMed] [Google Scholar]
- Roemer P. B., Edelstein W. A., Hayes C. E., Souza S. P., and Mueller O. M., “The NMR phased array,” Magn. Reson. Med. 16(2), 192–225 (1990). 10.1002/mrm.1910160203 [DOI] [PubMed] [Google Scholar]
- Noebauer-Huhmann I. M., Szomolanyi P., Juras V., Kraff O., Ladd M. E., and Trattnig S., “Gadolinium-based magnetic resonance contrast agents at 7 Tesla: In vitro T1 relaxivities in human blood plasma,” Invest. Radiol. 45(9), 554–558 (2010). 10.1097/RLI.0b013e3181ebd4e3 [DOI] [PubMed] [Google Scholar]
- Parker G. J. M. et al. , “Experimentally-derived functional form for a population-averaged high-temporal-resolution arterial input function for dynamic contrast-enhanced MRI,” Magn. Reson. Med. 56(5), 993–1000 (2006). 10.1002/mrm.21066 [DOI] [PubMed] [Google Scholar]
- Yankeelov T. E., Luci J. J., DeBusk L. M., Lin P. C., and Gore J. C., “Incorporating the effects of transcytolemmal water exchange in a reference region model for DCE-MRI analysis: Theory, simulations, and experimental results,” Magn. Reson. Med. 59(2), 326–335 (2008). 10.1002/mrm.21449 [DOI] [PMC free article] [PubMed] [Google Scholar]
- Henderson E., Rutt B. K., and Lee T-Y., “Temporal sampling requirements for the tracer kinetics modeling of breast disease,” Magn. Reson. Imaging 16(9), 1057–1073 (1998). 10.1016/S0730-725X(98)00130-1 [DOI] [PubMed] [Google Scholar]
- Hugo J. W. L. A., Jaspers K., and Walter H. B., “The precision of pharmacokinetic parameters in dynamic contrast-enhanced magnetic resonance imaging: The effect of sampling frequency and duration,” Phys. Med. Biol. 56(17), 5665–5678 (2011). 10.1088/0031-9155/56/17/013 [DOI] [PubMed] [Google Scholar]


