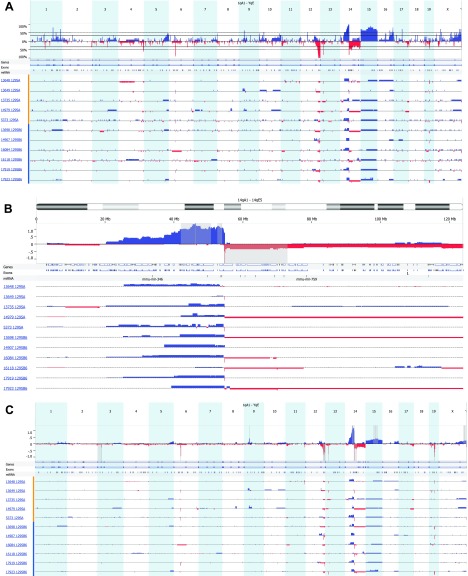
Figure 3.
aCGH profiles of sequence gains and losses in thymic lymphomas from five 129SAF1 Atm-/- mice (designated by mouse number and 129SA) and six 129SB6F1 Atm-/- mice (designated by mouse number and 129SB6) (A). The top panel represents the frequency of gain or loss of the 21 chromosomal regions of mouse. The lower panel describes gain or loss for each sample by mouse ID and strain. Most regions of gain or loss are single copy, whereas regions of gain or loss greater than 1 show a block of double the height of the single-loss regions. (B) A representation of regions of sequence gain and loss specifically on chromosome 14 as per the description in A. In addition, the gray regions were identified by GISTIC analysis as a highly overrepresented alteration associated with this sample set. (C) Identification of highly overrepresented regions of copy number gain and loss by GISTIC analysis. Within the upper panel are 14 regions where there is a statistically significant high frequency of aberrations over the background level in this sample set. A q-bound of 0.05 and G-score of 1.0 was used. The G-score is a measure of frequency of occurrence and the magnitude of that occurrence. The dark gray bar represents the peak region, maximal G-score, and nominal q-bound. The surrounding lighter gray shaded areas represent boundaries generated by a leave-one-out recalculation of the peak region.

