Abstract
Purpose: To reduce radiation dose in CT imaging, the statistical model based iterative reconstruction (MBIR) method has been introduced for clinical use. Based on the principle of MBIR and its nonlinear nature, the noise performance of MBIR is expected to be different from that of the well-understood filtered backprojection (FBP) reconstruction method. The purpose of this work is to experimentally assess the unique noise characteristics of MBIR using a state-of-the-art clinical CT system.
Methods: Three physical phantoms, including a water cylinder and two pediatric head phantoms, were scanned in axial scanning mode using a 64-slice CT scanner (Discovery CT750 HD, GE Healthcare, Waukesha, WI) at seven different mAs levels (5, 12.5, 25, 50, 100, 200, 300). At each mAs level, each phantom was repeatedly scanned 50 times to generate an image ensemble for noise analysis. Both the FBP method with a standard kernel and the MBIR method (Veo®, GE Healthcare, Waukesha, WI) were used for CT image reconstruction. Three-dimensional (3D) noise power spectrum (NPS), two-dimensional (2D) NPS, and zero-dimensional NPS (noise variance) were assessed both globally and locally. Noise magnitude, noise spatial correlation, noise spatial uniformity and their dose dependence were examined for the two reconstruction methods.
Results: (1) At each dose level and at each frequency, the magnitude of the NPS of MBIR was smaller than that of FBP. (2) While the shape of the NPS of FBP was dose-independent, the shape of the NPS of MBIR was strongly dose-dependent; lower dose lead to a “redder” NPS with a lower mean frequency value. (3) The noise standard deviation (σ) of MBIR and dose were found to be related through a power law of σ ∝ (dose)−β with the component β ≈ 0.25, which violated the classical σ ∝ (dose)−0.5 power law in FBP. (4) With MBIR, noise reduction was most prominent for thin image slices. (5) MBIR lead to better noise spatial uniformity when compared with FBP. (6) A composite image generated from two MBIR images acquired at two different dose levels (D1 and D2) demonstrated lower noise than that of an image acquired at a dose level of D1+D2.
Conclusions: The noise characteristics of the MBIR method are significantly different from those of the FBP method. The well known tradeoff relationship between CT image noise and radiation dose has been modified by MBIR to establish a more gradual dependence of noise on dose. Additionally, some other CT noise properties that had been well understood based on the linear system theory have also been altered by MBIR. Clinical CT scan protocols that had been optimized based on the classical CT noise properties need to be carefully re-evaluated for systems equipped with MBIR in order to maximize the method's potential clinical benefits in dose reduction and/or in CT image quality improvement.
Keywords: CT, iterative reconstruction, noise power spectrum (NPS), noise standard deviation, image quality
INTRODUCTION
X-ray computed tomography (CT) was introduced into the clinical practice in the 1970s, since then it has become a powerful imaging tool to diagnose diseases, to triage patients, and to provide image-guidance for radiotherapies and minimally invasive interventional surgeries. In the past four decades, joint efforts by medical physicists, clinicians, industry scientists, and engineers have been made to dramatically advance CT and find its new clinical applications. As a result of these collaborations, CT exams have helped to save lives and improve the quality of life for millions of patients each year.1 However, there has been a growing public concern over the small but uncertain risk associated the ionizing radiation from CT exams.2 To minimize this arguable risk, several guidelines for clinical CT routines have been established, including the Image Gently Campaign3 and the as low as reasonably achievable (ALARA) concept.4 Meanwhile, technological advances have also helped to further reduce radiation dose. These advances can be categorized as either hardware-driven methods, including improved x-ray tube technologies,5, 6, 7, 8 advanced tube current modulation methods,9, 10, 11 kV/spectrum shaping,12, 13, 14, 15 etc., or software-driven methods, including new image processing and reconstruction algorithms.16, 17, 18, 19, 20, 21, 22, 23, 24, 25, 26, 27, 28, 29, 30
The recently developed model based iterative reconstruction (MBIR) image reconstruction framework16, 17, 18, 19, 20, 21 is such a CT reconstruction method that has demonstrated the promise of generating clinically acceptable CT images at very low dose levels.31, 32, 33, 34 This new image reconstruction framework provides the flexibility to incorporate a model of each component of the CT data acquisition system, such as the cone-shaped x-ray beam, the finite sizes of the focal spot, the detector elements, and the reconstruction voxels, and also the x-ray physics, such as photon statistics and electronic noise, into the reconstruction process. In contrast, the conventional filtered-backprojection (FBP) CT reconstruction algorithm offers very limited flexibility to the reconstruction procedure. The MBIR method can also be adaptive to different tissue types or morphologies; It can reduce noise in homogeneous regions (low frequency content) and preserve details at edges (high frequency content), by incorporating an adaptive regularization method into its iterative reconstruction process.20
With the increasing clinical use of MBIR, optimizing CT protocols to maximize its diagnostic benefit with the lowest amount of radiation dose becomes urgent. Prior to the era of CT iterative reconstruction (IR) methods, CT protocol optimization could be conducted under the guidance of the linear system theory and objective image quality measures such as noise variance, noise power spectrum (NPS), noise equivalent quanta (NEQ), and modulation transfer function (MTF).35, 36, 37, 38, 39 For example, the measured MTF and NPS using a quality assurance (QA) phantom could be combined with a specific clinical imaging task to predict the human observer diagnostic performance, based on which scanning parameters (mAs, kV, image pixel size, slice thickness, filter, etc.) could be optimized for the task.40 In this approach, NPS plays an important role since its shape reflects the visual appearance (texture) of the image noise background, and its magnitude (i.e., noise variance σ2) is directly related to the radiation dose through35, 36 σ2 ∝ dose−1. This relationship directly links radiation dose and diagnostic performance and helps the customization of CT exposure levels for different diagnostic tasks or patients with different sizes.
For IR methods such as MBIR, however, CT protocol optimizations are much more challenging since the linear system theory is not directly applicable,20, 30, 41, 42 and the classical image quality measures must be re-assessed for MBIR before an accurate and robust CT protocol optimization framework can be established. Toward this goal, Richard et al. have developed a task-based approach to measure the MTF of MBIR.41 They found that the MTF may depend on local contrast level and may not be stationary within the image. Pal et al.43 and Chen et al.44 have characterized the NPS of MBIR and found that the method reduced the noise magnitude and shifted the noise spectrum toward lower frequencies. Yu et al.45 have used the image-domain-based channelized Hotelling observer (CHO) method to measure the task-specific detection performance of a specific IR method. Their CHO results demonstrated good correlation with human observers for relatively simple signal-known-exactly tasks.
In this paper, we focus on a systematic characterization of the noise performance of MBIR equipped on several state-of-the-art clinical 64-slice CT scanners in our institution. The three-dimensional (3D) NPS was employed to quantify both noise magnitude and noise spatial correlation. The 3D measurement was motivated by the fact that the MBIR method is implemented in 3D.20 The NPS was also measured in two dimension (2D) in the axial plane and in zero dimension (0D) to directly quantify the noise magnitude. Because of the possible noise nonstationarity introduced by MBIR, all of the NPS results were measured from noise ensembles collected from repeated CT scans. The often-used approach of sliding a region-of-interest (ROI) within an image to collect the noise ensemble was intentionally avoided. The noise characterization of MBIR was always accompanied by the noise characterization of FBP for comparison purpose, and a particular attention was given to the dose dependence of NPS.
METHODS AND MATERIALS
Data acquisition, image reconstruction, and phantoms
A 64-slice clinical diagnostic CT scanner (Discovery CT750 HD, GE Healthcare, Waukesha, WI) equipped with both the standard reconstruction engine and the MBIR reconstruction engine (Veo®, GE Healthcare, Waukesha, WI) was used in this study. The Veo reconstruction engine consists of 14 clustered computer nodes; each node is equipped with four quad-core 2.53 GHz Xeon E5540 CPUs (Intel, Santa Clara, CA) and 12 GB memory. The reconstruction speed varies for different reconstruction volume sizes and scanning protocols; it also depends on the reconstruction load. In this study, it took about 24 min to reconstruct a relatively small image volume with a 1024 × 1024 × 32 size acquired with a head scanning protocol, and it took about 80 min to reconstruct a relatively large CT image volume with a 512 × 512 × 658 in a clinical chest-to-pelvis scanning protocol. However, it is interesting to notice that, when the reconstruction engine was nearly fully loaded with 26 image volumes of the same size (1024 × 1024 × 32), the reconstructions of those volumes took only about 45 min. This indicates that the Veo reconstruction engine has the capacity to simultaneously reconstruct multiple independent image volumes without having any obvious overhead on the reconstruction time.
Three physical phantoms were used in this work (Fig. 1): The first one is a water phantom with an outer diameter of 21.5 cm; the second and the third phantoms are a 10-year-old pediatric head phantom (ATOM Pediatric 10 year phantom, Model 706, Sections 1-9, CIRS Inc., Norfolk, VA) and a 1-years-old pediatric head phantom (ATOM Pediatric 1 year phantom, Model 704, Sections 1-7, CIRS Inc., Norfolk, VA), respectively. The scanner was collimated to a 20-mm-thick section of each phantom. The dimensions of the two anthropomorphic phantoms at this position are approximately 17 cm (AP) × 14 cm (LR) and 14 cm (AP) × 12 cm (LR), respectively. All phantoms were scanned in an axial head scanning mode with a tube voltage of 120 kV and a scanning time of 0.5 s. Other data acquisition and reconstruction parameters are listed in Table 1. The water phantom was scanned at seven mAs levels (5, 12.5, 25, 50, 100, 200, 300), which correspond to CTDIvol values of (1.0, 2.5, 5.0, 10.0, 20.0, 40.0, 60.0) mGy, respectively. The two pediatric phantoms were scanned at five mAs levels (5, 12.5, 25, 50, 100). The two relatively high exposure levels (200 and 300 mAs) were not applied to the pediatric phantoms due to their relative small diameters. All scans were repeated 50 times at identical settings for noise analysis. Since the axial scans covered only a single collimated section of each phantom, there was no patient couch movement involved during the data acquisition of each phantom. This helped to avoid any subtle geometric misalignment across the 50 repeated scans.
Figure 1.

Physical phantoms used in this work. (a) A cylindrical water phantom with a PMMA wall; (b) CIRS 10-years-old pediatric head phantom; (c) CIRS 1-year-old pediatric head phantom.
Table 1.
Data acquisition and reconstruction parameters.
| FBP | Veo | |
|---|---|---|
| Reconstruction FOV | 250 mm | 250 mm |
| Slice thickness | 0.625 mm | 0.625 mm |
| Slice interval | 0.625 mm | 0.625 mm |
| Total number of slices | 32 | 32 |
| Axial matrix size | 512 × 512 | 1024 × 1024 |
| Axial pixel size | 0.488 mm | 0.244 mm |
| Axial Nyquist frequency | 1.025 mm−1 | 2.049 mm−1 |
| Nyquist frequency along fz | 0.800 mm−1 | 0.800 mm−1 |
The projection data of each scan were reconstructed using both the FBP method with a standard kernel and the Veo method. Note that the current version of the Veo reconstruction does not allow users to adjust reconstruction parameters, such as slice thickness or reconstruction matrix size. In the remainder of the paper, (x, y) were used to denote the axial plane while z was used to denote the longitudinal axis. A volume-of-interest (VOI) and a region-of-interest (ROI) segmented from the ith of the 50 repeated scans are denoted as Ii(x, y, z) and Ii(x, y), respectively. The word “frequency” refers to spatial frequency in the remainder of the paper and is denoted by letter f.
Multidimensional noise power spectrum analysis
In this study, multidimensional NPS, including 3D NPS, 2D NPS of the axial (x, y) plane, and zero-dimensional (0D) NPS (noise variance), were measured and analyzed. All NPSs were calculated for frequencies within the ±Nyquist frequency determined by the discrete sampling rates of the reconstructed images (Table 1).
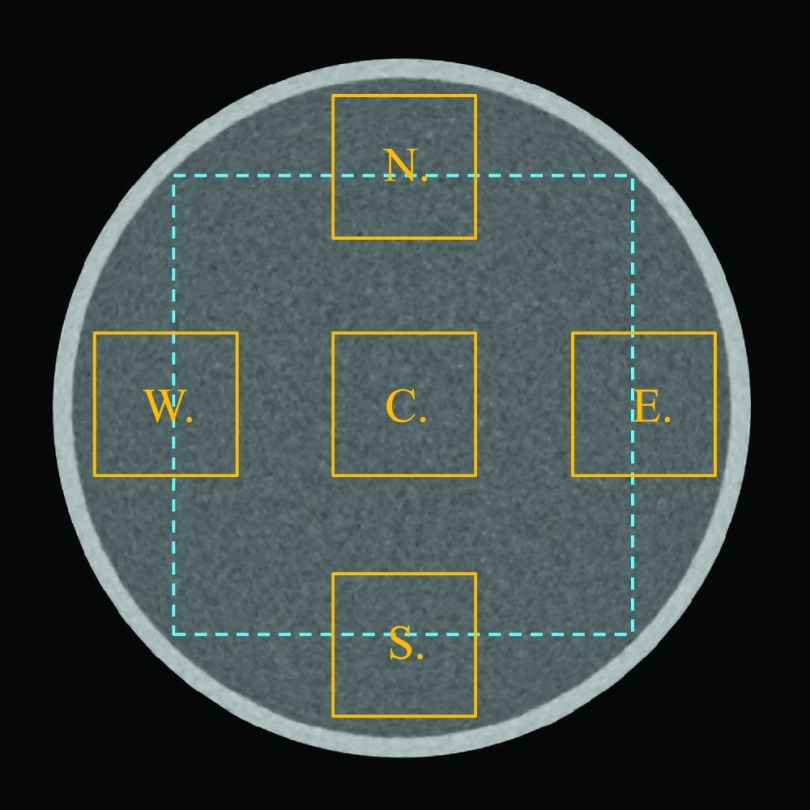
The purpose of performing the 3D NPS analysis is to investigate the impact of 3D image reconstruction on the noise magnitude and spatial correlation along both the axial and the z directions. A VOI encompassing most of the uniform region inside the scanned volume of each phantom was used to measure the 3D NPS. The physical dimensions of this VOI are 142 × 142 × 20 mm3 (water phantom), 112 × 112 × 20 mm3 (large pediatric phantom), and 90 × 90 × 20 mm3 (small pediatric phantom). The dashed square in Fig. 2 shows an axial cross-section of the VOI in the water phantom. The 3D NPS was calculated using38
| (1) |
where Δk and Nk denote the pixel size and the number of pixels of I along axis k, respectively. During the measurement, the discrete frequency sampling rate was 0.008 mm−1 along fx or fy and was 0.016 mm−1 along fz. The averaged image in Eq. 1 is defined as
| (2) |
Figure 2.
The solid squares illustrate five ROIs (each denoted by a letter) in an axial image that were used to measured the local 2D NPS. The size of each ROI is 44 × 44 mm2. The dashed square (142 × 142 mm2) illustrates the ROI used for measuring the global 2D NPS of the axial image.
By subtracting from I(x, y, z), the DC trend of each image pixel caused by the presence of water as well as other deterministic structural nonuniformity can be removed from the NPS calculations. Note that the noise power at the origin of the frequency coordinates, i.e., NPS(0, 0, 0), is not necessarily zero due to possible presence of noise aliasing in the image.46
The 2D NPS analysis focuses on characterizing the noise correlation and noise magnitude in the axial images. A ROI in the central axial slice of each phantom was used to perform the measurement. The physical dimensions of this ROI are 142 × 142 mm2 (water phantom), 112 × 112 mm2 (large pediatric phantom), and 90 × 90 mm2 (small pediatric phantom). The dashed square in Fig. 2 shows the ROI in the water phantom. The 2D NPS was calculated using the following formula:
| (3) |
Because of the radial symmetry of the CT data acquisition system and the linearity of the FBP algorithm, the 2D NPS of a FBP-reconstructed axial CT image is expected to be radially symmetric. For images reconstructed by Veo, the rotational invariance of the 2D NPS was reexamined during the study. Once the radial symmetry was confirmed, the 2D NPS was radially averaged and plotted as a function of the radial frequency (fxy) to demonstrate the frequency distribution of noise. The shape of NPS(fxy) was further quantified by two metrics: the first one (denoted as fpeak) is the frequency corresponding to the peak value of the NPS and the second one (denoted as fmean) is the mean frequency defined as
| (4) |
The frequency-independent 0D NPS is equal to the noise variance (σ2) and is given by integrating the nD NPS along the frequency axis as42
| (5) |
Note that the 0D NPS measures the noise variance of those VOIs/ROIs used to calculate the corresponding NPS and thus location-dependent. The 0D NPS was used to compare the noise magnitude between Veo and FBP and to quantify the dependence of noise magnitude on the radiation exposure level (quantified by mAs). It was also used to characterize the noise spatial uniformity, the method of which is described below.
Characterization of noise spatial uniformity
Using data acquired from the 50 repeated scans, the expected value of the noise standard deviation (σ) for each image pixel at each reconstruction method and each exposure level was be estimated as
| (6) |
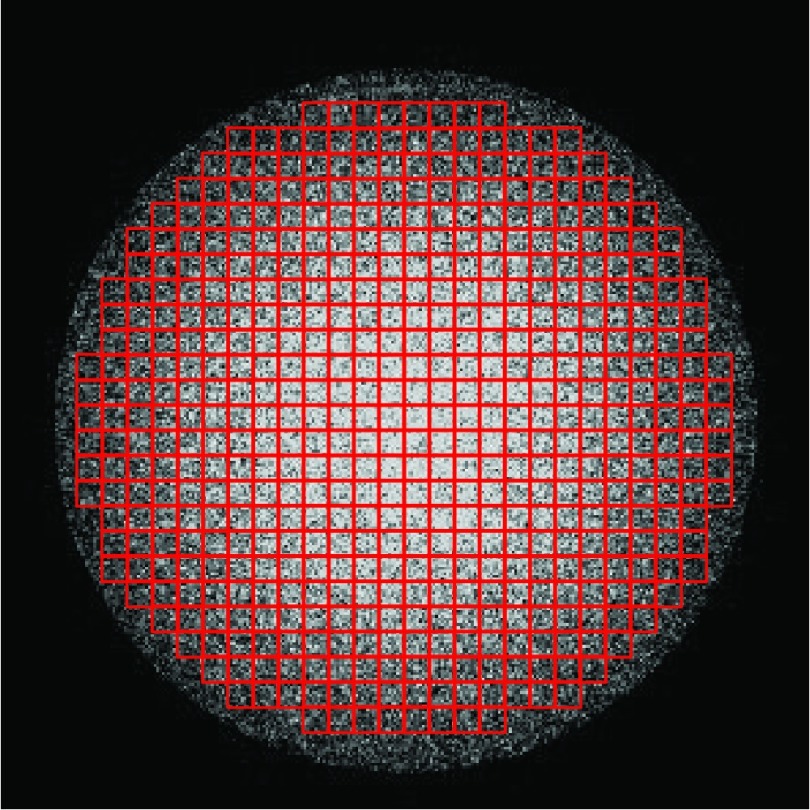
where has been defined in Eq. 1. To characterize the spatial uniformity of the noise standard deviation, the axial plane of the water phantom was divided into M = 518 small ROIs, each with a dimension of 7.8 × 7.8 mm2 (Fig. 3). Then the average noise standard deviation of all pixels in each ROI, , was measured before the noise spatial nonuniformity index (NUI) was calculated as
| (7) |
where was given by averaging across j. Namely,
| (8) |
Figure 3.
ROIs in the noise standard deviation map that were used to calculate the noise spatial nonuniformity index (NUI).
Noise standard deviation values of the central and peripheral regions of the axial slice of the water phantoms were also compared using , where and denote the mean noise standard deviation of the two ROIs defined in Fig. 2. Similarly, the noise standard deviation values in the central and peripheral regions inside the pediatric head phantoms were also compared for each reconstruction method.
The noise spatial uniformity in the axial plane is further characterized by the local 2D NPS measured in five representative ROIs illustrated in Fig. 2. The physical dimension of each ROI is 44 × 44 mm2, which corresponds to a matrix size of 140 × 140 (FBP) or 280 × 280 (Veo).
Dependence of noise performance on slice thickness
One option to reduce CT noise in the clinical practice is to increase the axial slice thickness. This can be achieved during the reconstruction by detector-row binning. Alternatively, a postreconstruction slice reformatting can be used to increase the nominal slice thickness. The current commercial version of MBIR (Veo) uses only the second approach. To study the dependence of the noise performance of Veo on slice thickness (Δz), the native (0.625 mm) axial slices were binned to generate images with Δz = 1.25, 2.5, and 5.0 mm. The NPS of the reformatted images was measured and compared with the NPS of the 0.625 mm images. The impact of slice thickness was examined on: (i) the magnitude of the noise; (ii) the dose dependence of the noise magnitude; and (iii) the shapes of the axial NPS quantified by peak frequency and mean frequency.
Characterization of noise properties of composite images
Under the assumption that CT noise is dominated by photon statistics rather than electronic noise, it is expected that the NPS of a FBP image acquired at a given dose D is the same as the NPS of an image synthesized from a linear combination of images acquired at dose Di provided that ∑iDi = D. This can be analytically proven due to the linear nature of the FBP algorithm. For example, the FBP images acquired at 100 and 200 mAs should be able to generate a composite image that has the same NPS as the 300 mAs image. The composite scheme is given by
| (9) |
Because these images were acquired at relatively high exposure levels, the assumption of negligible electronic noise is well justified. Therefore, the following equality can be proven based on the NPS ∝ D−1 relationship and the standard error propagation analysis:
| (10) |
This NPS composite law was validated using the experimental FBP data. Further, we applied the same composite scheme to the Veo images to study the influence of the nonlinear reconstruction method on the noise characteristics of images generated by dose partitioning.
RESULTS
Image comparison
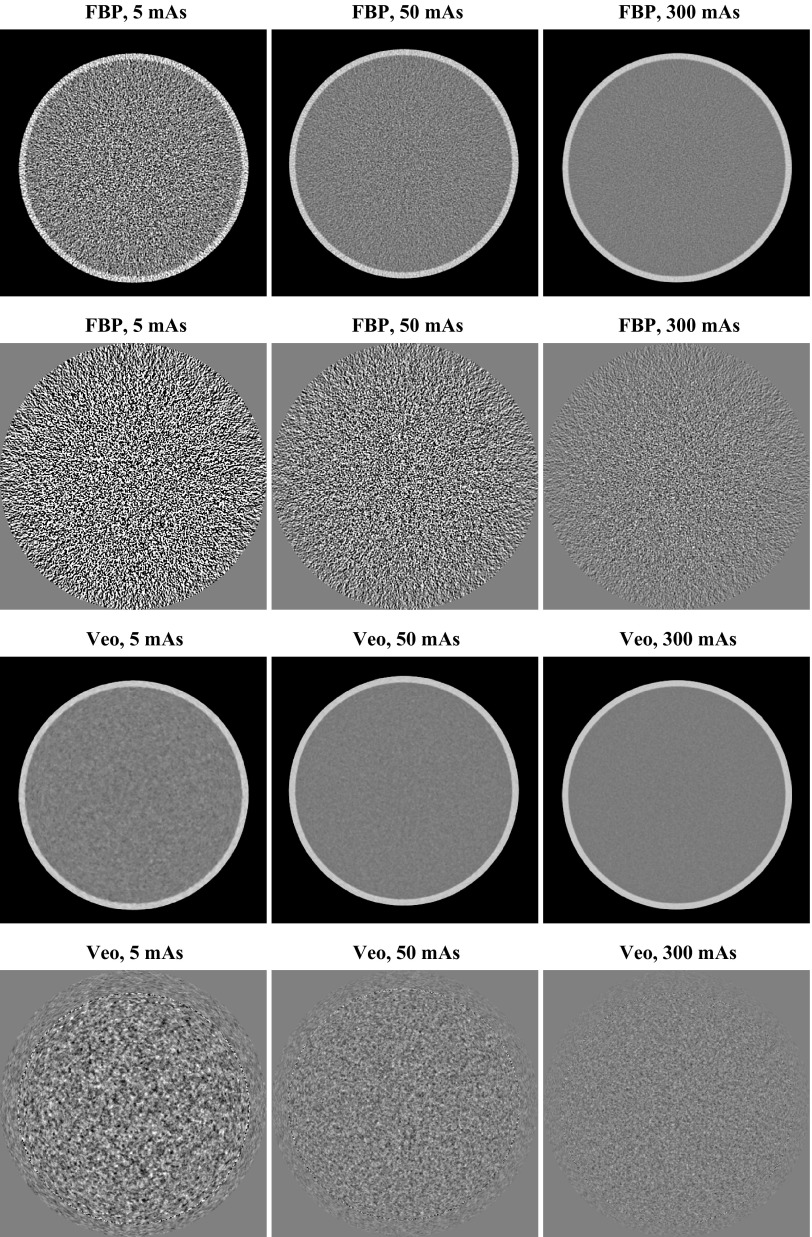
Figure 4 shows representative axial CT images of the water phantom reconstructed by FBP and Veo. The corresponding noise-only image obtained by subtracting two sequential scans is also presented in the same figure. A factor of was divided from the subtracted result to account for the doubling of the noise variance due to the subtraction operation. For both FBP and Veo, the magnitudes of image noise increase with lower radiation dose. However, the dose dependence of the noise magnitude is more pronounced in the FBP images: The FBP image acquired at 5 mAs is significantly noisier than the FBP image acquired at 300 mAs. In comparison, the Veo method successfully reduced noise in the CT images acquired at relatively low mAs level and made the noise magnitude relatively constant across different mAs levels. In addition to the difference in the noise magnitude behavior, the noise textures are different between FBP images and Veo images: for FBP, the noise textures across different dose levels are the same; for Veo, however, the noise texture had a relatively fine graininess at 300 mAs and a relatively coarse graininess at 5 mAs. The change in noise texture in Veo images was further quantified by the NPS results in Secs. 3B, 3C.
Figure 4.
Central axial CT images (first and third rows; display range: [−170 230] HU) and the corresponding noise-only images (second and fourth rows; display range: [−40 40] HU) of the water phantom. The noise-only images were obtained by subtracting two consecutive scans. A factor of has been divided to account for the doubling of noise variance after the subtraction.
Three-dimensional noise power spectrum comparison
The 3D NPSs of water phantom images acquired at a high exposure level (300 mAs) and a low exposure level (5 mAs) are shown in Figs. 56, respectively. To allow a fair comparison, the NPS of both FBP and Veo were displayed within the ±Nyquist frequency of FBP. Some common features between the 3D NPS of FBP and Veo can be observed: (i) Both NPSs were rotationally invariant in the axial plane; (ii) Both NPSs decreased monotonically with increasing fz; (iii) At any given fz, both NPSs demonstrated donut-shaped frequency distributions in the axial plane. A peak can be identified at some intermediate radial frequency for each NPS.
Figure 5.
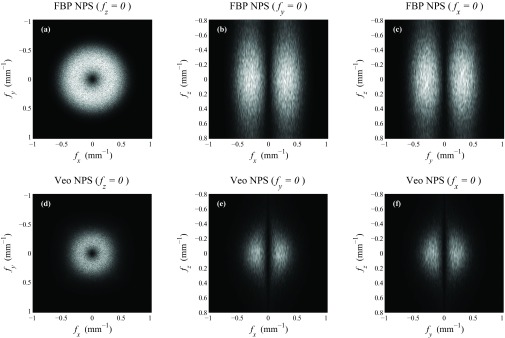
Representative cuts through the 3D NPS measured at 300 mAs. The display range was kept the same for all cases ([0 117] HU2 mm3).
Figure 6.
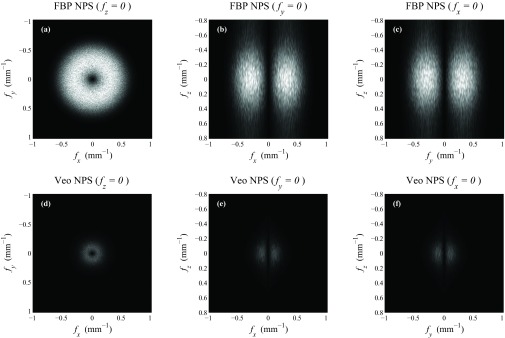
Representative cuts through the 3D NPS measured at 5 mAs. The display range was kept the same for all cases ([0 7000] HU2 mm3).
Despite these similarities, the 3D NPS of FBP and Veo also demonstrated the following differences: (i) The Veo NPS was of better spherical symmetry than the FBP NPS. (ii) The magnitude of the NPS along any direction at any frequency was reduced in Veo. This reduction was more aggressive at lower dose; (iii) The frequency value corresponding to the peak of the NPS in the axial plane was decreased in Veo; (iv) The Veo NPS was “redder” along fz due to the use of some 3D regularization along both axial and z direction. This effect is more apparent at lower dose. In comparison, the NPS of FBP demonstrated a pseudo-white noise distribution along fz due to the pseudo-2D nature of the algorithm.
Two-dimensional noise power spectrum comparison
Because of the radial symmetry of the NPS of FBP and Veo in the axial plane, information about their 2D axial NPS can be represented by the corresponding radial profile, NPS(fxy). Figure 7 shows NPS(fxy) of the water phantom measured at seven different mAs levels, from which the following characteristics were observed: (i) The NPS of Veo was smaller in magnitude than the NPS of FBP at each of the seven dose levels. (ii) Veo lead to “redder” NPS; the frequencies corresponding to the peaks of the NPS were smaller in Veo than in FBP, which means that the noise are of longer spatial correlation in Veo. This is consistent with the observations from Fig. 4. (iii) The shapes of the NPS was dose dependent in Veo; Lower doses lead to NPSs with lower mean and peak frequencies.
Figure 7.
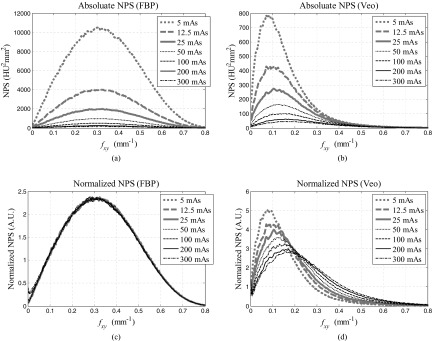
Radially averaged 2D axial NPS of the water phantom. (a)-(b) Absolute NPSs. (c)-(d) NPSs normalized by the area under the NPS curve. The peak and mean frequencies of these NPS plots are shown in Fig. 8.
The 2D NPS measurements were repeated with the pediatric head phantoms, and the shapes of their NPSs quantified by the peak frequency (fpeak) and mean frequency (fmean) were listed in Table 2. For FBP, both fpeak and fmean demonstrated negligible dependence on the phantom selection and on the dose level. The value of fpeak is about 0.32 mm−1 and the value of fmean is about 0.34 mm−1, which correspond to spatial dimensions of 1.6 and 1.5 mm, respectively. In comparison, fpeak and fmean of Veo showed strong dependence on dose and some dependence on the phantom selection. For example, fmean of the water phantom was 0.23 mm−1 (corresponding to a spatial dimension of 2.2 mm) at 100 mAs but decreased to 0.15 mm−1 (corresponding to a spatial dimension of 3.3 mm) at 5 mAs. At both of these two mAs levels, fmean of Veo increased with phantom size. The relative increment in fmean is about 30%–40% from the water phantom to the smaller pediatric head phantom.
Table 2.
List of frequencies that correspond to the peak and mean values of the 2D axial NPS.
| mAs |
|||||||||
|---|---|---|---|---|---|---|---|---|---|
| Frequency | Method | Phantoms | 5 | 12.5 | 25 | 50 | 100 | 200 | 300 |
| fpeak (mm−1) | Water | 0.320 | 0.318 | 0.316 | 0.318 | 0.317 | 0.315 | 0.317 | |
| FBP | Ped. large | 0.323 | 0.323 | 0.322 | 0.321 | 0.318 | |||
| Ped. small | 0.321 | 0.321 | 0.323 | 0.318 | 0.320 | ||||
| Water | 0.102 | 0.126 | 0.138 | 0.155 | 0.171 | 0.184 | 0.202 | ||
| Veo | Ped. large | 0.117 | 0.136 | 0.156 | 0.171 | 0.193 | |||
| Ped. small | 0.138 | 0.154 | 0.168 | 0.186 | 0.203 | ||||
| fmean (mm−1) | Water | 0.335 | 0.333 | 0.333 | 0.333 | 0.332 | 0.331 | 0.330 | |
| FBP | Ped. large | 0.336 | 0.336 | 0.335 | 0.335 | 0.335 | |||
| Ped. small | 0.337 | 0.337 | 0.336 | 0.336 | 0.336 | ||||
| Water | 0.150 | 0.173 | 0.190 | 0.208 | 0.227 | 0.245 | 0.260 | ||
| Veo | Ped. large | 0.171 | 0.196 | 0.216 | 0.237 | 0.258 | |||
| Ped. small | 0.202 | 0.226 | 0.247 | 0.266 | 0.290 | ||||
To further characterize the dependence of fpeak and fmean on dose, their values were plotted versus mAs in Fig. 8. For Veo, each of the plots is a straight line with a positive slope when a log-log scale is used, which indicates a power-law relationship. The results of the power-law fittings are shown in these two figures, and the correlation coefficients, R2, for all the power-law fittings were above 0.99, suggesting excellent correlation. The exponent of the power-law fitting is in the range of [0.12, 0.16] for both fpeak and fmean, and it showed weak dependence over the phantom selection.
Figure 8.
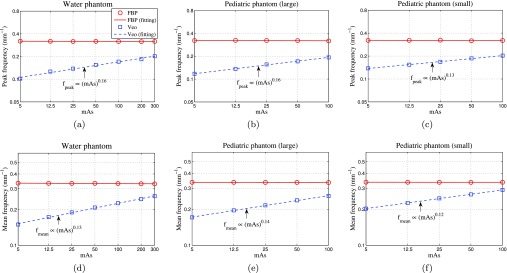
Peak frequencies (first row) and mean frequencies (second row) of the axial NPS. The plots are displayed using log-log scales. The legend in (a) applies to all.
Zero-dimensional noise power spectrum comparison
For linear CT systems, it is well understood that the 0D NPS (noise variance σ2) scales inversely with dose level when the quantum noise dominates. However, it remains unclear whether the same scaling law holds true for IR methods. In this study, noise standard deviations (σ) measured in all three phantoms were plotted as a function of mAs in Fig. 9. A power-law fitting σ = α · (mAs)−β was performed to each plot and the fitting results were tabulated in Table 3. As expected, σ scaled inversely with the square root of mAs for FBP images (β = 0.5). In stark contrast, the noise standard deviation in Veo images demonstrated a novel dose dependence: the exponent of the power-law fitting is in the range of [0.21, 0.25], which means that σ is less sensitive to dose level in Veo. For example, a 50% dose reduction will lead to only a 15%–19% increase in noise in Veo. In comparison, the same amount of dose reduction will lead to 40% increase in noise in FBP.
Figure 9.
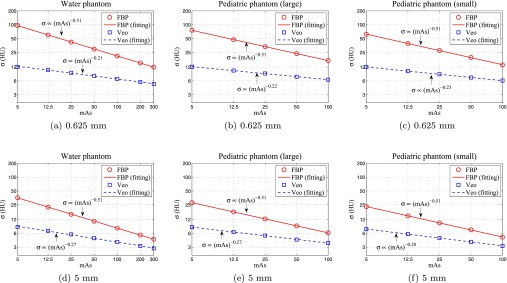
The dose dependence of noise standard deviation (σ) evaluated at two different slice thicknesses (0.625 and 5.0 mm). All curves are displayed using log-log scales.
Table 3.
Results of the power-law fitting σ = α · (mAs)−β between the noise standard deviation σ and the mAs value.
| Method | Phantom | Δz (mm) | β | α |
|---|---|---|---|---|
| 0.625 | 0.51 | 216.18 | ||
| Water | 1.25 | 0.51 | 157.44 | |
| 2.5 | 0.51 | 112.47 | ||
| 5.0 | 0.51 | 80.16 | ||
| 0.625 | 0.51 | 170.51 | ||
| FBP | Ped. large | 1.25 | 0.51 | 123.37 |
| 2.5 | 0.51 | 88.24 | ||
| 5.0 | 0.51 | 62.87 | ||
| 0.625 | 0.51 | 141.41 | ||
| Ped. small | 1.25 | 0.51 | 102.32 | |
| 2.5 | 0.51 | 73.20 | ||
| 5.0 | 0.51 | 52.08 | ||
| 0.625 | 0.21 | 17.61 | ||
| Water | 1.25 | 0.23 | 16.68 | |
| 2.5 | 0.25 | 15.38 | ||
| 5.0 | 0.27 | 13.07 | ||
| 0.625 | 0.22 | 17.40 | ||
| Veo | Ped. large | 1.25 | 0.23 | 16.47 |
| 2.5 | 0.25 | 14.94 | ||
| 5.0 | 0.27 | 12.54 | ||
| 0.625 | 0.24 | 19.07 | ||
| Ped. small | 1.25 | 0.25 | 16.09 | |
| 2.5 | 0.27 | 14.22 | ||
| 5.0 | 0.28 | 11.68 |
Dependence of noise performance on slice thickness
For both FBP and Veo, slice rebinning is expected to have no impact on the relative frequency distribution of the NPS in the axial plane since it only operates along the z direction. This was confirmed by the mean frequency and peak frequency data in Fig. 10a. However, some aspects of the noise performances of the two methods had different dependence on slice thickness: For FBP, the noise standard deviation in the axial FBP images is approximately proportional to [i.e., σ2 ∝ (Δz)−1] due to the pseudo-white noise distribution along fz. This relationship was confirmed by data in Fig. 10b, which shows that σ2(Δz) × Δz is independence of Δz. Further, this slice dependence is independent of dose due to the linearity of FBP, thus slice rebinning does not change the exponent of the σ-dose power law. This was confirmed by the data in Fig. 11b, which shows that σ2(Δz) × Δz × mAs is independence of mAs. For Veo, its noise magnitude has a much weaker dependence on slice thickness due to the reduction in high frequency noise along fz. The slice rebinning operation that acts like a low-pass filter along fz should have limited impact on noises that have already been low-pass filtered. This explains why the σ2 × Δz × mAs vs Δz plots of Veo demonstrated positive slopes in Fig. 11b. This effect is more pronounced at low dose level since the proportion of low-frequency noise increases with decreasing dose. This means the σ ∝ mAs−β power law is expected to have a larger β value for thicker slices. This was confirmed by our data in Table 3. Given the different exponents in noise amplitude vs slice thickness, one may expect the noise reduction benefit from the MBIR reconstruction diminishes at very thick slices.
Figure 10.
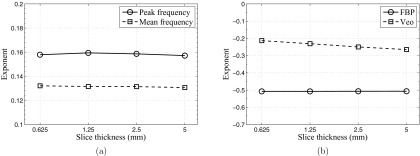
(a) Exponents of the fpeak-mAs power-law and the fmean-mAs power-law as a function of slice thickness (Veo data only). (b) Exponents of the σ-mAs power-law as a function of slice thickness for both FBP and Veo.
Figure 11.

Dependence of noise variance σ2 on slice thickness Δz. (a) σ2 versus Δz; (b) (σ2 mAs Δz) versus Δz. All plots are displayed using log-log scales. The legend in (b) also applies to (a).
Noise spatial uniformity comparison
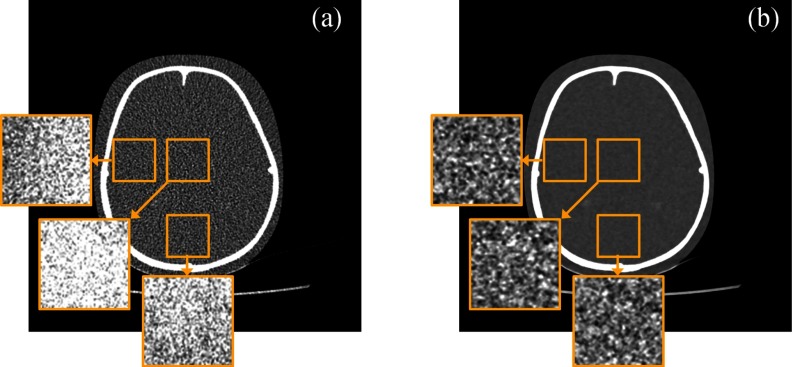
The NUI measured in FBP and Veo images were compared in Fig. 12a. At each dose level, Veo lead to at least 50% reduction in NUI. The improvement in noise spatial uniformity can also be observed in Fig. 12b, which shows the relative difference in σ between the central and peripheral regions of the water phantom. The FBP images were noisier in the central region of both the water phantom and the pediatric phantom [also shown in Fig. 13a]. Those inhomogeneous noise spatial distributions were caused by the relatively longer x-ray path lengths at the phantom centers and were homogenized by using the Veo method [Fig. 13b].
Figure 12.
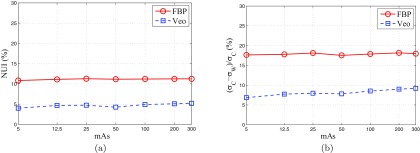
(a) Noise nonuniformity index (NUI) measured from the 518 ROIs in Fig. 3; (b) Relative difference in noise standard deviation between ROI W (peripheral) and ROI C (central) in Fig. 2.
Figure 13.
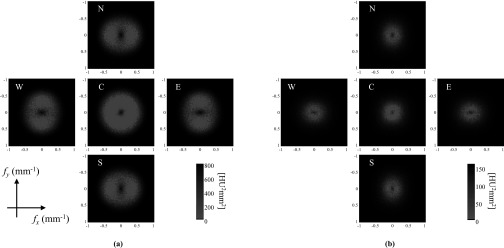
Noise standard deviation (σ) maps of three local regions in the central axial plane of the 10-years-old pediatric head phantom. The σ-maps were calculated from 50 repeated scans. (a) FBP reconstruction with its σ-maps displayed in the range of [−21 21] HU. (b) Veo reconstruction with its σ-maps displayed in the range of [−4 4] HU. The two CT images are displayed in the range of [−300 500] HU.
The improvement in noise spatial uniformity was further demonstrated by the local 2D NPS results in Fig. 14. For images reconstructed by FBP, the magnitude of the NPS of the central region was larger than the peripheral regions. In addition, the NPS demonstrated losses in radial symmetry at the peripheral regions, which was due to the divergent nature of the x-ray fan beam used during the CT data acquisition.47 Veo improved both the spatial homogeneity and the angular homogeneity of the NPS [Fig. 14b].
Figure 14.
Local axial 2D NPS of FBP and Veo measured at 50 mAs in the five local ROIs illustrated in Fig. 2. Note that the display window and level of (b) are 80% smaller than these in (a).
Breakdown of the NPS composite law
Using the weighting scheme in Eq. 9, the 100 and 200 mAs FBP images were combined to form a composite image that looked the same as the 300 mAs FBP image (see Fig. 15). The NPS results in Fig. 16a prove the quantitative equivalence of these two images. The mean frequency (fmean) is the same (0.33 mm−1) for the two images. For Veo, a difference can be found between the (100, 200) mAs composite image and the 300 mAs image; the composite image lead to a lower noise magnitude. The noise variance is 20.5 HU2 in the Veo composite image and is 26.2 HU2 in the Veo 300 mAs image. This means that by partitioning radiation dose into separate CT scans, CT images with a lower magnitude of noise may be achieved by Veo. Meanwhile, Fig. 16 clearly demonstrated that the image hybridization changes the image noise texture: The high frequency noise was reduced while the low frequency noise (noise below 0.1 mm−1) remained unchanged in the composite image. The mean frequency (fmean) is 0.24 mm−1 for the composite image and is 0.26 mm−1 for the 300 mAs image.
Figure 15.

A comparison of the 300 mAs image and the (100, 200) mAs composite images for FBP (a)-(b) and Veo (c)-(d). To help visualize the noise texture, the images were displayed over a relatively narrow W/L of [−40 40] HU.
Figure 16.
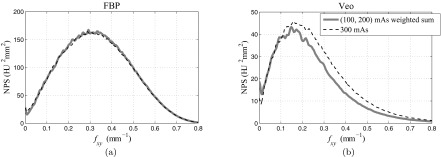
NPS of (100, 200 mAs) composite images and 300 mAs images reconstructed by FBP (a) and Veo (b). The legend applies to both (a) and (b).
DISCUSSION
Empirical explanation of experimental results
There are six major experimental findings in this work: (1) At each dose level and at each frequency, the magnitude of the NPS of MBIR was smaller than that of FBP. (2) While the shape of the NPS of FBP was dose-independent, the shape of the NPS of MBIR was strongly dose-dependent; lower dose lead to a “redder” NPS with a lower mean frequency value. (3) The noise standard deviation (σ) of MBIR and dose were found to be related through a power law of σ ∝ (dose)−β with the component β ≈ 0.25, which violated the classical σ ∝ (dose)−0.5 power law in FBP. (4) The effect of noise reduction by MBIR was most prominent for thin image slices. (5) MBIR lead to better noise spatial uniformity when compared with FBP. (6) A composite image generated from two MBIR images acquired at two different dose levels (D1 and D2) demonstrated lower noise than that of an image acquired at a dose level of D1+D2. The first two findings have been reported in an earlier work by Chen et al.,44 in which an ACR CT accreditation phantom (diameter = 20 cm) was scanned at six dose levels (CTDIvol ∈ [0.41, 8.2] mGy) to evaluate the dose dependence of the 2D axial NPS. Both the magnitude and the frequency distribution of our NPS results are consistent with this previous work.
Because of the nonlinearity of the MBIR method, there is no closed-form analytical formula to explain every experimental finding of the noise properties of MBIR, such as the exponents of the noise-mAs power law and NPS peak frequency-mAs power law; There is also no general theoretical foundation to support that every MBIR image will show the same exponents, because the regularization method used in the MBIR reconstruction framework is linked to the local contrast gradient20 and is clearly dependent on how the regularization parameters were selected in commercial products. It is very likely that a task-based approach will have to be used to predict these exponents, although it currently remains as an open question.
Nevertheless, the experimental findings presented in this paper still represent the general features of the MBIR method. An empirical interpretation of these general features is still feasible based on the basic principles and implementation methods of MBIR available in published literature:16, 17, 18, 19, 20, 21 First, the reduction in noise magnitude by MBIR should be attributed primarily to the use of a regularization term in the objective function to encourage smoothness in the image. Second, the reduction in peak frequency and mean frequency of the NPS is also likely to be a consequence of using this regularizer, which introduces additional spatial correlations between neighboring voxels. As the neighborhood of each voxel is defined in 3D and encompasses all of the 26 surrounding voxels, the NPS tends to have a redshift along both the axial and the z directions. This shift is increased for large phantoms, which suggests that the regularization may be more aggressive for noisier data. While the shift in NPS toward lower spatial frequencies may come at the expense of a sharpness loss for low contrast objects, it does not necessarily represent spatial resolution degradation for high contrast objects: the regularizer used in MBIR uses different parameters for homogeneous regions and edges based on the contrast gradient between neighboring pixels. This is different from linear CT reconstruction algorithms such as FBP, in which a change in the shape of the NPS usually represents a change of the MTF in the similar manner for the entire image. Third, the improvement in noise uniformity should be attributed primarily to the use of statistical weighting in the data fidelity term of the MBIR object function. This statistical weighting is built based on the Bayesian estimation framework and the probability distribution of the detector counts. It assigns a smaller weigh to the projection data with higher noise level and a relatively higher weight to the projection data with lower noise level so that the noise spatial distribution in the reconstructed image can reach a relative homogeneous distribution.
Implications for CT protocol optimization
For linear CT reconstruction algorithms such as FBP, most conclusions drawn from phantom-based measurements can be generalized to actual patient scans. For example, the spatial resolution characterized by a high contrast MTF phantom is representative of the spatial resolution of patient images acquired under the same system condition. One exception is the noise spatial uniformity, which strongly depends on the patient anatomy. MBIR is to the opposite: it can flatten the noise spatial distributions of even highly inhomogeneous objects, but many of the physical properties of the image are object-dependent. For example, the noise-mAs power-law relationship found in homogeneous regions may not hold for other regions dominated by inhomogeneous anatomical structure, and the shape of the NPS may vary with image objects and thus may not be quantitatively predicted. Nevertheless, our results demonstrate that it is still possible to generalize some of the experimental findings to a carefully selected range. For example, the exponents of the noise-mAs power-law relationship found in this work may apply to CT images of relatively isotropic and homologous body parts (e.g., the cranial cavity). Similarly, the exponents of the fpeak-mAs power-law relationship may stay at a relatively constant level for similar kinds of body parts. In future quality checks and CT scanning protocol development for MBIR, these findings could be utilized to improve efficiency and clinical performance.
Limitations
The current study has several limitations that the authors would like to acknowledge. The first limitation is related to the use of the frequency-domain NPS analysis, which is defined as the Fourier transform of autocovariance function of the CT image therefore implicitly require the autocovariance function to be stationary.48 For MBIR, there is no guarantee that this requirement can be fulfilled because of the nonlinearity nature of this iterative algorithm. This work has partially addressed this problem by restricting the NPS to local regions and by using repeated scans. Directly performing the image-domain autocovariance measurement to characterize the noise performance of MBIR can fundamentally address this limitation, but this approach was intentionally avoided in this study due to its extremely demanding requirement over the size of the noise ensemble to achieve any meaningful statistical power. For task-based detectability measurement, however, the image-domain model observer analysis has been shown to be more feasible due to the incorporation of the channel mechanism.45
The second limitation of the current study is its limited scope: it only studied the noise performance of MBIR and did not characterize its signal properties, such as the spatial resolution and CT number accuracy. The spatial resolution is of particular interest since it usually has a tradeoff with CT noise for FBP and since the object detectability is jointly determined by noise and spatial resolution. MBIR is likely to alter the conventional spatial resolution-noise tradeoff relationship introduce contrast-dependence to the spatial resolution.41 The mismatch of the image pixel size between FBP (0.49 mm) and MBIR (0.24 mm) further complicates the comparison of the two methods. In addition, the spatial resolution along the z direction (slice thickness sensitivity) may influence the noise performance but was not characterized in this study. The shape of the NPS plots along the fz direction suggests possible spatial resolution loss along the slice thickness direction for low contrast objects, although this is currently only a speculation. Therefore, we made no claim about the overall imaging performance of MBIR or how much dose this method can save. Instead, we focused on investigating the noise dependence on other physical factors (such as the exposure level) and the corresponding impact to CT protocol optimization.
The third limitation is related to the simplicity of the three phantoms used for noise measurement, which lack high frequency contains and are relatively homogeneous. As the regularization method used in MBIR depends on the local contrast gradient, it is likely that conclusions drawn from these phantoms are not directly applicable to objects dominated by high frequency features.
CONCLUSIONS
In conclusion, noise power spectrum has been assessed for a statistical MBIR method recently introduced to clinical CT systems. Due to the intrinsic nonlinearity of the method, many well-known CT noise properties have been modified. In particular, the tradeoff relationship between CT image noise and radiation dose is significantly modified by MBIR to establish a more gradual dependence of noise on radiation dose. In addition, the spatial frequencies corresponding to the peak value and the mean value of the NPS are shifted to lower values in low contrast regions of MBIR images. The unique noise characteristics of MBIR indicate that extra efforts should be made to establish new CT scanning protocols for MBIR to maximize the method's clinical benefits with the minimum cost of radiation dose.
ACKNOWLEDGMENTS
This work is partially supported by a NIH Grant (Grant No. R01CA169331). The authors would like to thank Dr. Michael Speidel for providing the pediatric phantoms and John Garrett, Stephen Brunner, and Adam Budde for their editorial assistances. Finally, the authors would like to thank the anonymous reviewers for their insightful comments to improve the quality of this paper.
References
- McCollough C. H., Chen G. H., Kalender W., Leng S., Samei E., Taguchi K., Wang G., Yu L., and Pettigrew R. I., “Achieving routine submillisievert CT scanning: Report from the summit on management of radiation dose in CT,” Radiology 264, 567–580 (2012). 10.1148/radiol.12112265 [DOI] [PMC free article] [PubMed] [Google Scholar]
- National Council on Radiation Protection and Measurements (NCRP), “Ionizing radiation exposure of the population of the United States,” Technical Report No. 160, 2009.
- Goske M. J. et al. , “The image gently campaign: Working together to change practice,” Am. J. Roentgenol. 190, 273–274 (2008). 10.2214/AJR.07.3526 [DOI] [PubMed] [Google Scholar]
- Slovis T. L., “Children, computed tomography radiation dose, and the as low as reasonably achievable (ALARA) concept,” Pediatrics 112, 971–972 (2003). 10.1542/peds.112.4.971 [DOI] [PubMed] [Google Scholar]
- Roessl E. and Proksa R., “K-edge imaging in x-ray computed tomography using multi-bin photon counting detectors,” Phys. Med. Biol. 52, 4679–4696 (2007). 10.1088/0031-9155/52/15/020 [DOI] [PubMed] [Google Scholar]
- Barber W. C., Nygard E., Iwanczyk J. S., Zhang M., Frey E. C., Tsui B. M. W., Wessel J. C., Malakhov N., Wawrzyniak G., Hartsough N. E., Gandhi T., and Taguchi K., “Characterization of a novel photon counting detector for clinical CT: Count rate, energy resolution, and noise performance,” Proc. SPIE 7258, 725824 (2009). 10.1117/12.813915 [DOI] [Google Scholar]
- Taguchi K., Zhang M., Frey E. C., Wang X., Iwanczyk J. S., Nygard E., Hartsough N. E., Tsui B. M. W., and Barber W. C., “Modeling the performance of a photon counting x-ray detector for CT: Energy response and pulse pileup effects,” Med. Phys. 38, 1089–1102 (2011). 10.1118/1.3539602 [DOI] [PMC free article] [PubMed] [Google Scholar]
- Duan X., Wang J., Leng S., Schmidt B., Allmendinger T., McCollough C., and Grant K., “Integration of a CT detector's photo-diode and analog-to-digital converter (ADC) into a single application-specific-integrated circuit: Impact on image noise and artifacts in a clinical CT system,” RSNA Annual Meeting, Section SSE21, Chicago, IL (2012) (abstract).
- Kalender W., Wolf H., Suess C., Gies M., Greess H., and Bautz W., “Dose reduction in CT by anatomically adapted tube current modulation: Principles and first results,” in Advances in CT IV, edited by Krestin G., and Glazer G. (Springer, Berlin/Heidelberg, 1998), pp. 27–34. [Google Scholar]
- Kalra M. K., Maher M. M., Toth T. L., Schmidt B., Westerman B. L., Morgan H. T., and Saini S., “Techniques and applications of automatic tube current modulation for CT,” Radiology 233, 649–657 (2004). 10.1148/radiol.2333031150 [DOI] [PubMed] [Google Scholar]
- Rizzo S., Kalra M., Schmidt B., Dalal T., Suess C., Flohr T., Blake M., and Saini S., “Comparison of angular and combined automatic tube current modulation techniques with constant tube current CT of the abdomen and pelvis,” Am. J. Roentgenol. 186, 673–679 (2006). 10.2214/AJR.04.1513 [DOI] [PubMed] [Google Scholar]
- Funama Y., Awai K., Nakayama Y., Kakei K., Nagasue N., Shimamura M., Sato N., Sultana S., Morishita S., and Yamashita Y., “Radiation dose reduction without degradation of low-contrast detectability at abdominal multisection CT with a low-tube voltage technique: Phantom study,” Radiology 237, 905–910 (2005). 10.1148/radiol.2373041643 [DOI] [PubMed] [Google Scholar]
- Schindera S. T., Nelson R. C., Mukundan S., Paulson E. K., Jaffe T. A., Miller C. M., DeLong D. M., Kawaji K., Yoshizumi T. T., and Samei E., “Hypervascular liver tumors: Low tube voltage, high tube current multi-detector row CT for enhanced detection: Phantom study,” Radiology 246, 125–132 (2008). 10.1148/radiol.2461070307 [DOI] [PubMed] [Google Scholar]
- Kalender W. A., Deak P., Kellermeier M., van Straten M., and Vollmar S. V., “Application- and patient size-dependent optimization of x-ray spectra for CT,” Med. Phys. 36, 993–1007 (2009). 10.1118/1.3075901 [DOI] [PubMed] [Google Scholar]
- Yu L., Bruesewitz M. R., Thomas K. B., Fletcher J. G., Kofler J. M., and McCollough C. H., “Optimal tube potential for radiation dose reduction in pediatric CT: Principles, clinical implementations, and pitfalls,” Radiographics 31, 835–848 (2011). 10.1148/rg.313105079 [DOI] [PubMed] [Google Scholar]
- Sauer K. and Bouman C., “A local update strategy for iterative reconstruction from projections,” IEEE Trans. Signal Process. 41, 534–548 (1993). 10.1109/78.193196 [DOI] [Google Scholar]
- Fessler J. and Hero A., “Penalized maximum-likelihood image reconstruction using space-alternating generalized EM algorithms,” IEEE Trans. Image Process. 4, 1417–1429 (1995). 10.1109/83.465106 [DOI] [PubMed] [Google Scholar]
- Lange K. and Fessler J., “Globally convergent algorithms for maximum a posteriori transmission tomography,” IEEE Trans. Image Process. 4, 1430–1438 (1995). 10.1109/83.465107 [DOI] [PubMed] [Google Scholar]
- Bouman C. and Sauer K., “A unified approach to statistical tomography using coordinate descent optimization,” IEEE Trans. Image Process. 5, 480–492 (1996). 10.1109/83.491321 [DOI] [PubMed] [Google Scholar]
- Thibault J.-B., Sauer K. D., Bouman C. A., and Hsieh J., “A three-dimensional statistical approach to improved image quality for multislice helical CT,” Med. Phys. 34, 4526–4544 (2007). 10.1118/1.2789499 [DOI] [PubMed] [Google Scholar]
- Yu Z., Thibault J.-B., Bouman C., Sauer K., and Hsieh J., “Fast model-based x-ray CT reconstruction using spatially nonhomogeneous ICD optimization,” IEEE Trans. Image Process. 20, 161–175 (2011). 10.1109/TIP.2010.2058811 [DOI] [PubMed] [Google Scholar]
- Sukovic P. and Clinthorne N., “Penalized weighted least-squares image reconstruction for dual energy x-ray transmission tomography,” IEEE Trans. Med. Imaging 19, 1075–1081 (2000). 10.1109/42.896783 [DOI] [PubMed] [Google Scholar]
- Rivière P. J. L., “Penalized-likelihood sinogram smoothing for low-dose CT,” Med. Phys. 32, 1676–1683 (2005). 10.1118/1.1915015 [DOI] [PubMed] [Google Scholar]
- Singh S., Kalra M. K., Hsieh J., Licato P. E., Do S., Pien H. H., and Blake M. A., “Abdominal CT: Comparison of adaptive statistical iterative and filtered back projection reconstruction techniques,” Radiology 257, 373–383 (2010). 10.1148/radiol.10092212 [DOI] [PubMed] [Google Scholar]
- Sagara Y., Hara A. K., Pavlicek W., Silva A. C., Paden R. G., and Wu Q., “Abdominal CT: Comparison of low-dose CT with adaptive statistical iterative reconstruction and routine-dose CT with filtered back projection in 53 patients,” Am. J. Roentgenol. 195, 713–719 (2010). 10.2214/AJR.09.2989 [DOI] [PubMed] [Google Scholar]
- Tipnis S., Ramachandra A., Huda W., Hardie A., Schoepf J., Costello P., Flohr T., and Sedlmair M., “Iterative reconstruction in image space (IRIS) and lesion detection in abdominal CT,” Proc. SPIE 7622, 76222K (2010). 10.1117/12.843787 [DOI] [Google Scholar]
- Funama Y., Taguchi K., Utsunomiya D., Oda S., Yanaga Y., Yamashita Y., and Awai K., “Combination of a low tube voltage technique with the hybrid iterative reconstruction (iDose) algorithm at coronary CT angiography,” J. Comput. Assist. Tomogr. 35, 480–485 (2011). 10.1097/RCT.0b013e31821fee94 [DOI] [PMC free article] [PubMed] [Google Scholar]
- Tang J., Thériault-Lauzier P., and Chen G.-H., “Dose reduction using prior image constrained compressed sensing (DR-PICCS),” Proc. SPIE 7961, 79612K (2011). 10.1117/12.878200 [DOI] [Google Scholar]
- Lubner M. G., Pickhardt P. J., Tang J., and Chen G.-H., “Reduced image noise at low-dose multidetector CT of the abdomen with prior image constrained compressed sensing algorithm,” Radiology 260, 248–256 (2011). 10.1148/radiol.11101380 [DOI] [PubMed] [Google Scholar]
- Thériault-Lauzier P. and Chen G.-H., “Characterization of statistical prior image constrained compressed sensing (PICCS): II. Application to dose reduction,” Med. Phys. 40, 021902 (14pp.) (2013). 10.1118/1.4773866 [DOI] [PMC free article] [PubMed] [Google Scholar]
- Pickhardt P. J., Lubner M. G., Kim D. H., Tang J., Ruma J. A., del Rio A. M., and Chen G.-H., “Abdominal CT with model-based iterative reconstruction (MBIR): Initial results of a prospective trial comparing ultralow-dose with standard-dose imaging,” Am. J. Roentgenol. 199, 1266–1274 (2012). 10.2214/AJR.12.9382 [DOI] [PMC free article] [PubMed] [Google Scholar]
- Yasaka K., Katsura M., Akahane M., Sato J., Matsuda I., and Ohtomo K., “Model-based iterative reconstruction for reduction of radiation dose in abdominopelvic CT: comparison to adaptive statistical iterative reconstruction,” SpringerPlus 2, 209 (9pp.) (2013). 10.1186/2193-1801-2-209 [DOI] [PMC free article] [PubMed] [Google Scholar]
- Smith E. A., Dillman J. R., Goodsitt M. M., Christodoulou E. G., Keshavarzi N., and Strouse P. J., “Model-based iterative reconstruction: Effect on patient radiation dose and image quality in pediatric body CT,” Radiology 270, 526–534 (2014). 10.1148/radiol.13130362 [DOI] [PMC free article] [PubMed] [Google Scholar]
- Chen B., Barnhart H., Richard S., Robins M., Colsher J., and Samei E., “Volumetric quantification of lung nodules in CT with iterative reconstruction (ASiR and MBIR),” Med. Phys. 40, 111902 (10pp.) (2013). 10.1118/1.4823463 [DOI] [PubMed] [Google Scholar]
- Riederer S. J., Pelc N. J., and Chesler D. A., “The noise power spectrum in computed x-ray tomograhy,” Phys. Med. Biol. 23, 446–454 (1978). 10.1088/0031-9155/23/3/008 [DOI] [PubMed] [Google Scholar]
- Hanson K., “Detectability in computed tomographic images,” Med. Phys. 6, 441–451 (1979). 10.1118/1.594534 [DOI] [PubMed] [Google Scholar]
- Boone J., “Determination of the presampled MTF in computed tomography,” Med. Phys. 28, 356–360 (2001). 10.1118/1.1350438 [DOI] [PubMed] [Google Scholar]
- Siewerdsen J. H., Cunningham I. A., and Jaffray D. A., “A framework for noise-power spectrum analysis of multidimensional images,” Med. Phys. 29, 2655–2671 (2002). 10.1118/1.1513158 [DOI] [PubMed] [Google Scholar]
- Boedeker K. L., Cooper V. N., and McNitt-Gray M. F., “Application of the noise power spectrum in modern diagnostic MDCT: Part I. measurement of noise power spectra and noise equivalent quanta,” Phys. Med. Biol. 52, 4027–4046 (2007). 10.1088/0031-9155/52/14/002 [DOI] [PubMed] [Google Scholar]
- Richard S., Li X., Yadava G., and Samei E., “Predictive models for observer performance in CT: Applications in protocol optimization,” Proc. SPIE 7961, 79610H (2011). 10.1117/12.877069 [DOI] [Google Scholar]
- Richard S., Husarik D. B., Yadava G., Murphy S. N., and Samei E., “Towards task-based assessment of CT performance: System and object MTF across different reconstruction algorithms,” Med. Phys. 39, 4115–4122 (2012). 10.1118/1.4725171 [DOI] [PubMed] [Google Scholar]
- Thériault-Lauzier P., Tang J., Speidel M. A., and Chen G.-H., “Noise spatial nonuniformity and the impact of statistical image reconstruction in CT myocardial perfusion imaging,” Med. Phys. 39, 4079–4092 (2012). 10.1118/1.4722983 [DOI] [PMC free article] [PubMed] [Google Scholar]
- Pal D., Kulkarni S., Yadava G., Thibault J.-B., Sauer K., and Hsieh J., “Analysis of noise power spectrum for linear and non-linear reconstruction algorithms for CT,” in 2011 IEEE Nuclear Science Symposium and Medical Imaging Conference (NSS/MIC) (IEEE, Valencia, Spain, 2011), pp. 4382–4385.
- Chen B., Richard S., and Samei E., “Relevance of MTF and NPS in quantitative CT: Towards developing a predictable model of quantitative performanace,” Proc. SPIE 8313, 83132O (2012). 10.1117/12.913219 [DOI] [Google Scholar]
- Yu L., Leng S., Chen L., Kofler J. M., Carter R. E., and McCollough C. H., “Prediction of human observer performance in a 2-alternative forced choice low-contrast detection task using channelized Hotelling observer: Impact of radiation dose and reconstruction algorithms,” Med. Phys. 40, 041908 (9pp.) (2013). 10.1118/1.4794498 [DOI] [PMC free article] [PubMed] [Google Scholar]
- Tward D. J. and Siewerdsen J. H., “Noise aliasing and the 3D NEQ of flat-panel cone-beam CT: Effect of 2D/3D apertures and sampling,” Med. Phys. 36, 3830–3843 (2009). 10.1118/1.3166933 [DOI] [PMC free article] [PubMed] [Google Scholar]
- Baek J. and Pelc N. J., “The noise power spectrum in CT with direct fan beam reconstruction,” Med. Phys. 37, 2074–2081 (2010). 10.1118/1.3378673 [DOI] [PMC free article] [PubMed] [Google Scholar]
- Handbook of Medical Imaging, Volume 1. Physics and Psychophysics, 1st ed., edited by Beutel J., Kundel H., and Van Metter R. (SPIE, Bellingham, WA, 2000). [Google Scholar]


