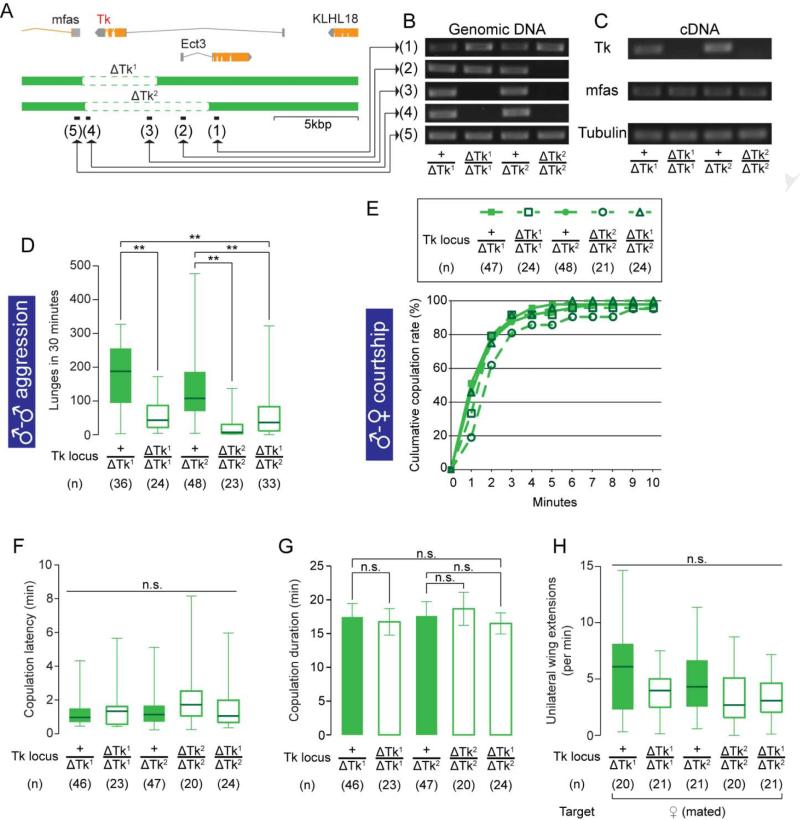
Figure 4. Null mutations on Tk specifically affect male-male aggression.
(A) Schematic view of the Tk gene locus and deletions by ΔTk1 and ΔTk2. Black bars (1)-(5) represent the regions targeted in the PCR analysis in (B).
(B) PCR analysis against regions (1)-(5) in (A) from genomic DNA samples of Tk deletion mutants.
(C) RT-PCR targeted to the Tk, mfas and Tubulin (α-Tubulin at 84B) (positive control) gene transcripts from cDNA samples of Tk deletion mutants.
(D-H) Number of lunges (D), cumulative copulation curve (E), copulation latency (F), copulation duration (G) and unilateral wing extension frequency (H) performed by Tk deletion mutants. For (D), (F) and (H), ** p < 0.01, n.s.: p > 0.05 (Kruskal-Wallis or Kruskal-Wallis and post-hoc Mann-Whitney U-tests). For (G), n.s.: p > 0.05 (one-way ANOVA and post-hoc Student's t-test).
Also see Supplemental Figure S4.

