

Abstract
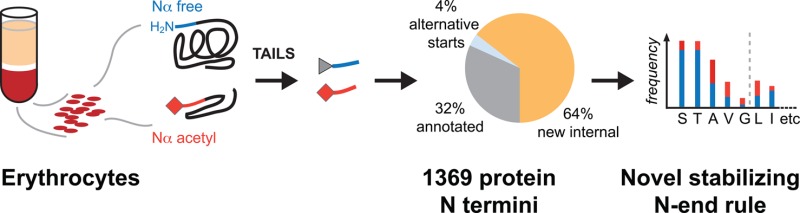
A goal of the Chromosome-centric Human Proteome Project is to identify all human protein species. With 3844 proteins annotated as “missing”, this is challenging. Moreover, proteolytic processing generates new protein species with characteristic neo-N termini that are frequently accompanied by altered half-lives, function, interactions, and location. Enucleated and largely void of internal membranes and organelles, erythrocytes are simple yet proteomically challenging cells due to the high hemoglobin content and wide dynamic range of protein concentrations that impedes protein identification. Using the N-terminomics procedure TAILS, we identified 1369 human erythrocyte natural and neo-N-termini and 1234 proteins. Multiple semitryptic N-terminal peptides exhibited improved mass spectrometric identification properties versus the intact tryptic peptide enabling identification of 281 novel erythrocyte proteins and six missing proteins identified for the first time in the human proteome. With an improved bioinformatics workflow, we developed a new classification system and the Terminus Cluster Score. Thereby we described a new stabilizing N-end rule for processed protein termini, which discriminates novel protein species from degradation remnants, and identified protein domain hot spots susceptible to cleavage. Strikingly, 68% of the N-termini were within genome-encoded protein sequences, revealing alternative translation initiation sites, pervasive endoproteolytic processing, and stabilization of protein fragments in vivo. The mass spectrometry proteomics data have been deposited to ProteomeXchange with the data set identifier <PXD000434>.
Keywords: Chromosome-centric Human Proteome Project (C-HPP), erythrocyte, missing proteins, N-end rule, post-translational modification, protein stability, protein termini, proteolytic processing, proteomics
1. Introduction
An important goal of the Chromosome-centric Human Proteome Project (C-HPP) is to experimentally detect all proteins translated from the human genome.1 As of the time of the 2013 Annual HUPO World Congress, 20 115 human proteins encoded by the human genome are predicted. However, one gene can give rise to multiple protein isoforms by alternative splicing and alternative sites of initiation of translation. Proteins can be further altered by different co- and post-translational protein modifications, often giving rise to multiple protein species. Even without considering these sundry forms, 3844 proteins have yet to be identified confidently despite analysis of thousands of data sets, and these have come to be designated as “missing” or inadequately documented proteins.2
The extent and rate of isoform expression, protein modification, or speciation depends on cell type, location, stimulus, and often human developmental stage. This can be exploited to identify missing proteins and new isoforms. Monitoring in vivo proteolytic cleavage of a protein can be exploited not only to observe speciation but also to obtain proof for the expression of missing proteins. Proteolysis alters the protein sequence and results in neo-N termini and hence novel semitryptic N-terminal peptides upon tryptic digestion in bottom-up proteomics. We therefore hypothesized that some of these N terminal peptides would exhibit beneficial m/z, ionization and fragmentation properties over their fully tryptic counterparts, rendering these peptides and cognate proteins more amenable to mass spectrometric identification. Similarly the use of an alternative digestive protease, such as GluC, can provide additional orthogonal evidence. Thus, we aim to analyze less commonly studied or accessible cells and tissues by high-throughput N terminomics using terminal amino isotopic labeling of substrates (TAILS)3 to identify rare cell-restricted or developmental-stage-restricted expression of proteins and their speciation. In addition, TAILS has the advantage of being able to capture all naturally blocked and unblocked N termini, which positive selection procedures for studying N termini cannot achieve.
Erythrocytes, the red blood cells, are the most abundant cells and only gas-transporting cells in vertebrates. They lose their nuclei and most internal membrane structures during maturation, resulting in much simplified and extremely deformable cells to deliver oxygen and remove CO2 deep in tissues. Mutations affecting erythrocyte protein function and abundance have been linked to serious disease such as sickle cell anemia,4 systemic lupus erythematosus,5 and hereditary spherocytosis.6 The lack of active gene expression renders erythrocytes inherently difficult to study by transcript-based gene expression analyses, and this renders proteomics the method of choice for determining protein presence, abundance, and function.
The erythrocyte proteome is thought to be less complex than that of a nucleated cell due to the lack of subcellular compartments and organelles. However, hemoglobin alone accounts for 97% of the erythrocyte dry mass, leading to an extraordinary wide dynamic range of protein abundance that is estimated to span eight orders of magnitude and thus is likely the largest in all human cells. Prefractionation at the protein level with 1D-7,8 or 2D-gel electrophoresis,9 depletion of high-abundance proteins,10 and equalization of protein amounts with hexapeptide libraries11 have been applied to overcome this technical challenge. However, antibody- or ligand-based depletion approaches affect each protein to a different degree and are prone to codepletion of low abundance proteins binding the target proteins. To date, the erythrocyte proteome encompasses more than 1500 soluble proteins and almost 1000 membrane proteins, suggesting the existence of many additional low-abundance proteins for maintaining cell function and cellular homeostasis.
1D gel-based studies of the erythrocyte proteome further reported a number of proteins diverging from their expected molecular weight, indicative of protein ubiquitination or proteolytic processing.7,8 Proteolytic processing is an irreversible post-translational modification that can dramatically alter protein interaction, location, and function.12 Hence it is important to determine the extent of proteolytic processing in fresh erythrocytes of healthy subjects and to resolve whether the observed protein species represent novel functional constituents of the erythrocyte proteome or merely accumulated degradation intermediates and nonfunctional remnants from cell and protein maturation and aging. The well-defined “N-end rule” of protein stability describes the link between identity of the genome-encoded N-terminal amino acid after cotranslational processing of the initiator methionine, N-terminal modification, and the turnover rate of a protein.13 According to the N-end rule, most proteins are translated with N-termini triggering degradation by the ubiquitin/proteasome system unless immediately masked by protein–protein interactions or proper folding. Because post-translational proteolytic processing exposes new protein N termini, neo-N termini, we asked the question if the mechanisms described by the “N-end rule” also play a role in the stability of intracellular proteins species formed by post-translational proteolysis.
To explore this question and to determine if such a rule enables classification of stable protein species and degradation intermediates, we designed a six-step workflow for sample fractionation, targeted enrichment of protein N termini by TAILS,3 and termini specific data analysis. Using the workflow, we mapped 1369 individual protein N termini in human erythrocytes from healthy donors on a proteome-wide scale. We identified 1234 proteins expanding the known erythrocyte proteome by 281 newly identified proteins including six missing proteins, which had previously not been detected in the human proteome. Surprisingly, 68% of the identified N termini mapped to positions within the annotated protein sequence, indicating alternative translation initiation sites (4%) and proteolytic processing (64%) and extensive post-translational Nα-acetylation. Here we defined a stabilizing N-end rule for N termini generated by post-translational proteolytic processing based on the frequency of observed N-terminal amino acid residues, their post-translational Nα-acetylation, and their classification according to the classic N-end rule. With this refined N-end rule, we identified novel truncated protein species, partially degraded protein remnants, and protein domains susceptible to proteolysis and postulated functional crosstalk between phosphorylation and limited proteolytic processing to regulate protein and cell function. Thus TAILS sets the foundation for extensive in-depth mapping of the human N terminome across cell lines, tissues, and disease conditions within the C-HPP.1
2. Materials and Methods
Organic solvents and HPLC-grade water were purchased from Fisher Scientific (Ottawa, ON, Canada). All other reagents were purchased from Sigma-Aldrich Canada (Oakville, ON, Canada) unless stated otherwise.
2.1. Isolation of Red Blood Cells
Human whole blood was obtained from healthy volunteer donors at the University of British Columbia Centre for Blood Research (UBC CBR) Blood Collection Suite according to institutional guidelines and in agreement with the Declaration of Helsinki. EDTA-containing tubes (BD Canada, Mississauga, ON) were used to collect 6 mL of whole blood from each donor. Erythrocytes were enriched using a refined Ficoll-Hypaque density gradient centrifugation strategy similar to that described.14 First, erythrocytes were collected by centrifugation at 500g, 10 min, 4 °C. Plasma and buffy coat layers were discarded and erythrocytes washed three times with cold PBS (137 mM NaCl, 10 mM Na2HPO4, 2 mM KH2PO4, 3 mM KCl, pH 7.4) diluted to 7 mL total volume and loaded on a single-step 3 mL Ficoll-Hypaque gradient (density 1.114, MP Biomedicals, Santa Ana, CA) 400g, 30 min, 4 °C. The bottom layer containing erythrocytes was collected and seven-fold diluted in phosphate-buffered saline (PBS). Cell counts for erythrocytes, platelets, and white blood cells and the concentration of free hemoglobin were determined using an ADVIA 120 hematology system (Siemens Healthcare Diagnostics, Oakville, ON, Canada). Erythrocytes were collected by centrifugation at 500g, 10 min, 4 °C and enrichment with Ficoll–Hypaque gradient repeated three times until cell counts for platelets and white blood cells were below 1 × 10⁹ cells/L and 0.1 × 10⁹ cells/L, respectively. Finally, erythrocytes were washed twice in 10 mL of PBS and collected by centrifugation.
2.2. Proteome Preparation
All further steps were performed on ice unless indicated otherwise. Purified erythrocytes were lysed in 7 mL of lysis buffer (10 mM Hepes, 10 mM EDTA, 1 mM PMSF, 5× HALT! Protease Inhibitor Cocktail (Thermo Fisher Pierce, Nepean, ON, Canada), pH 7.5) and separated into crude soluble and membrane protein fractions by centrifugation at 50 000g, 30 min, 4 °C. Membrane fractions were washed twice in cold lysis buffer, pelleted at 50 000g, and solubilized in 100 mM Hepes, 10 mM EDTA, 1% sodium deoxycholate, 1 mM EDTA, pH 7.5. Supernatants containing soluble proteins were centrifuged at 50 000g for 20 min to remove membrane carryover. For mass spectrometry analyses, some samples (10 mg) were depleted for hemoglobin using the HemoVoid kit (BiotechSupportGroup, Monmouth Junction, NJ) according to manufacturer instructions. Protein concentrations of membrane- and hemoglobin-depleted soluble fractions were estimated using the BCA assay (BioRad Laboratories, Mississauga, ON, Canada), and the concentration of hemoglobin was used as a proxy for the nondepleted soluble fraction.
2.3. Enrichment of N-Termini
Protein N termini were enriched from erythrocyte protein fractions essentially as described.15 Four biological replicates were analyzed for each protein fraction (soluble, hemoglobin-depleted soluble, membrane) typically starting with two aliquots of >2 mg protein pooled from two individual donors. Soluble proteins were denatured and reduced with 3 M guanidine-HCl and 5 mM DTT; membrane proteins we denatured by the addition of 5 mM DTT to the sodium deoxycholate-containing buffer and incubated for 30 min at 65 °C prior to cysteine side chain alkylation with 10 mM iodoacetamide for 45 min at room temperature in the dark. Surplus iodoacetamide was quenched by the addition of 10 mM DTT for 30 min. The pH was adjusted to 6.5 for modification of free amines at the whole protein level (i.e., before digestion with trypsin or GluC) by reductive dimethylation with 40 mM isotopically heavy formaldehyde (13CD2 in D2O, Cambridge Isotopes, Tewksbury, MA) and 20 mM sodium cyanoborohydride (ALD coupling solution, Sterogene, Carlsbad, CA). After reaction overnight at 37 °C, additional 20 mM heavy formaldehyde and 20 mM cyanoborohydride were added and incubated for another 2 to 3 h at 37 °C. The reaction was quenched using 100 mM Tris pH 6.8, 30 min at 37 °C and proteins purified by chloroform/methanol precipitation.
Soluble proteins were resolubilized in a small volume of 50 mM NaOH and directly neutralized with 100 mM Hepes, pH 7.5; membrane proteins were resolubilized in 100 mM Hepes, 1% sodium deoxycholate, pH 7.5. Protein concentrations were estimated again using the BCA assay (BioRad Laboratories), and one aliquot of each fraction was digested with proteomics-grade trypsin (Promega, Madison, WI) and the other with GluC (Worthington Biochemical Corporation, Lakewood, NJ) at a protein/enzyme ratio of 100:1 (w/w) and 50:1 (W/w) overnight at 37 °C. Digest efficiency was checked by SDS-PAGE, and a similar amount of enzyme was added for another 3 to 4 h if necessary. An aliquot of 50–100 μg of tryptic membrane and soluble protein digests was saved for separate proteome-level analysis (“preTAILS”) before adjusting the reaction mix to pH 6.5 and coupling internal and C-terminal peptides to a five-fold excess (w/w) HPG-ALD polymer (http://flintbox.com/public/project/1948/) by incubation with 20 mM sodium cyanoborohydride at 37 °C overnight. The reaction was quenched by the addition of 100 mM Tris pH 6.8, and peptides were desalted using solid phase extraction (C18plus cartridges, Waters, Mississauga, ON). Each TAILS and preTAILS sample was fractionated by off-line SCX chromatography (Polysulfethyl A, Poly LC, Columbia, MD) using an HPLC system (Agilent 1200, Agilent Technologies, Mississauga, ON, Canada). All peptides were desalted using C18 “omix” tips (Varian, Walnut Creek, CA) prior to MS analysis.
2.4. Mass Spectrometry
LC–MS/MS analysis was performed on an nano-LC system (Thermo Scientific, Mississauga, ON, Canada) coupled to a linear ion trap–orbitrap hybrid mass spectrometer (LTQ-Orbitrap XL, Thermo Scientific) using a nanospray ionization source including a fused silica trap column (length 2 cm, inner diameter 100 μm, packed with 5 μm diameter Aqua C-18 beads; Phenomenex, Torrance, CA), fused silica fritted analytical column (length 20 cm, inner diameter 50 μm, packed with 3 μm diameter Reprosil-Pur C-18-AQ beads; Dr. Maisch, Ammerbuch, Germany), and a silica gold-coated spray tip (20 μm inner diameter, 6 μm diameter opening, pulled on a P-2000 laser puller; Sutter Instruments, Novato, CA; coated on EM SCD005 Super Cool Sputtering Device; Leica Microsystems, Concord, ON, Canada). Buffer A consisted of 0.5% acetic acid, and buffer B consisted of 0.5% acetic acid and 80% acetonitrile. Gradients were run from 0 to 15% B over 15 min, then from 15 to 40% B in the next 65 min, then increased to 100% B over 10 min period and held at 100% B for 30 min. The LTQ-Orbitrap was set to acquire a full-range scan at 60 000 resolution from 350 to 1800 Th in the Orbitrap and to simultaneously fragment the top five peptide ions in each cycle in the LTQ (minimum intensity 200 counts). Parent ions were then excluded from MS/MS for the next 180 s. Singly charged ions were excluded from MS/MS. The Orbitrap was continuously recalibrated against protonated (Si(CH3)2O)6 at m/z = 445.120025 using the lock-mass function.16 Error of mass measurement was usually within 5 ppm. The mass spectrometry proteomics data have been deposited to the ProteomeXchange Consortium (http://proteomecentral.proteomexchange.org) via the PRIDE partner repository17 with the data set identifier <PXD000434>.
2.5. Mass Spectrometry Data Analysis
Acquired MS/MS raw data were converted to the mgf and mzXML format using MS-Convert.18 Spectra were matched to peptide sequences in the human UniProt protein database release 2013_04 (containing 179 766 sequences including common contaminants and reversed decoy sequences) using Mascot v2.3. (MatrixScience), X!Tandem,19 and MS-GF+.20,21 The following search criteria were used: expected cleavage pattern: semi-ArgC or semi-GluC allowing for three missed cleavages, 15 ppm precursor tolerance, 0.5 Da fragment ion tolerance, fixed Lys heavy dimethylation (+34.063117 Da), fixed Cys carbamidomethylation (+57.021464 Da), variable Met oxidation (+15.994915 Da), variable N terminal acetylation (+42.010565 Da), variable N-terminal heavy dimethylation (+34.063117 Da), variable conversion of N-terminal Glu > pyro-Glu (−18.010565 Da), and variable conversion of N-terminal Gln > pyro-Glu (−17.026549 Da).
All peptide identifications from individual searches with varying search parameters and different search engines were statistically evaluated and integrated using PeptideProphet and iProphet, as implemented in the Trans Proteomic Pipeline (TPP) v4.622 using a false discovery rate cutoff of 1% (Supplementary Table S4 in the Supporting Information). Peptides were grouped and assigned to proteins using the ProteinProphet module of the TPP (Supplementary Table S5 in the Supporting Information). Proteins were included in the analysis of the erythrocyte proteome if they were identified either (i) at an FDR of ≤0.7% on the protein level (ProteinProphet probability ≥0.9) or (ii) at an FDR of ≤1% on the peptide level (initial probability ≤0.88) supported by at least two independent spectra (Supplementary Table S2 in the Supporting Information). This second criterion was chosen to account for N-terminal enrichment by TAILS that reduces the number of identifiable peptides per protein species to one, leading to heavily penalized ProteinProphet probability scores. ProteinProphet was used to determine protein groups sharing the same set of peptides if peptides matched multiple protein sequences. For each protein group, one protein entry was selected as representative. For this selection priority was given for highest probability: canonical proteins over isoforms and curated SwissProt entries over Trembl entries. The N termini are defined according to their position within the sequence of this representative protein sequence and their terminal amino acid modification. Following this definition, the N-terminal peptides identified from trypsin and GluC digested samples are seamlessly mapped onto the same terminus. N-terminal peptides with identical sequence but different N-terminal modification are classified as independent N termini (Supplementary Table S3 in the Supporting Information). Classification of identified peptides as N termini required (i) a N terminus carrying a heavy dimethyl (indicative of a free N terminus in vivo as the labeling is performed at the protein level in TAILS and not at the peptide level as for shotgun analyses) or natural enzymatic modification (acetylation, N-terminal glutamate to pyro-glutamic acid conversion), (ii) a C-terminal residue matching the specificity of the employed digest enzyme (Arg in the case of trypsin which cuts with ArgC specificity due to lysine dimethylation; Asp or Glu in the case of GluC), and (iii) identification by at least two independent spectra. Peptides with N-terminal pyro-Glu derived from cyclization of Gln, a known side reaction under the employed conditions, and peptides with free N termini were used for protein identification only. Classification of protein identifications into known and “missing” proteins was based on neXtProt (www.nextprot.org) classes PE1 (known) and PE2-PE5 (missing),2 as determined from the respective files downloaded from neXtProt (ftp://ftp.nextprot.org/pub/current_release/ac_lists/) on 02.12.2013. To confirm the uniqueness and species specificity, peptide sequences representing “missing proteins” were further searched against the ‘nr’ database using the blastp algorithm.23
2.6. Bioinformatics, Statistical Analysis, and Terminome Mapping
Fisher’s exact test has been used for significance estimation. Gene Ontology enrichment was performed using the DAVID web service,24 and functional annotation of protein termini was determined using the TopFIND API.25
To determine regions in a protein that are susceptible to proteolysis, we developed the terminus cluster score (TCS), which was calculated as follows:
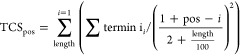 |
The TCS at any position (pos) of the genome-encoded protein sequence is defined as the summation of a contribution value (xi) for each position (i) in the genome encoded sequence. This value xi is formed by the number of termini observed at this position (terminii), divided by a decay factor d which reduces the contribution of the termini count to TCSpos with increasing distance (pos – i) from pos. The decay factor d is formed by the distance (1 + pos – i) divided by a protein length-depending dampening factor (2 + protein length/100) that reduces the decay factor for longer proteins, resulting in increased cluster potential.
To further identify the dominant termini suggesting stable protein species, we further developed the terminus prevalence score (TPS), which we defined as:
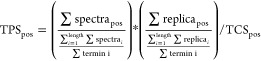 |
The TPS at any position (pos) of the genome encoded protein sequence is defined as the total number of spectra supporting a terminus (regardless of modification state) at this position (spectrapos), normalized to the average number of spectra assigned to each terminus, and multiplied by the normalized number of replica in which a terminus has been identified. Finally, the local cluster score (TCSpos) is taken into account to penalize termini within clusters.
3. Results and Discussion
3.1. Workflow for Mapping the Erythrocyte N-Terminome
Depth mapping of the human erythrocyte proteome for the C-HPP required a workflow that enables (i) the identification of proteins spanning a wide abundance range; (ii) the identification of protein speciation; and (iii) the identification of missing proteins. Given the evidence of the failure of thousands of data sets to uncover the 3844 missing proteins, we reasoned that new strategies were urgently required to identify the missing proteins. Hence, using N-terminomics by TAILS to analyze a cell rarely proteomically previously analyzed offers an orthogonal route to protein and protein isoform discovery. Targeted analysis of protein termini is also an alternative strategy for sample simplification26 and identification of low-abundance proteins.27 Steep reduction of the number of contributing peptides per protein species greatly reduces peptide coelution and masking, thus increasing sensitivity, dynamic range, and proteome coverage. This is most pertinent for erythrocytes where hemoglobin is such a dominant protein.
Protein termini and thereby proteolytic processing can be studied on a proteome-wide scale by several proteomic approaches such as COFRADIC and TAILS.28−30 TAILS efficiently enriches protein N-terminal peptides through polymer-based depletion of internal and C-terminal proteolytic peptides from proteome digests without being mass spectrometer time-intensive.3 Negative selection enriches both naturally modified and unmodified N termini in the same experiment, providing access to the complete N terminome, which positive-selection procedures cannot achieve, with simultaneous characterization of N-terminal modifications, for example, Nα-acetylation that further affect protein stability and function.12,13,31 TAILS can also retain quantitative information necessary for reliable statistical discrimination of significantly altered peptide abundances,32 reflecting biological processes in vivo and for biomarker identification.31
To leverage the potential of N-terminome mapping, we devised the following general six-step workflow to contribute rich termini data sets to the HPP (Figure 1A): (i) source material specific sampling and pretreatment; (ii) protein level prefractionation; (iii) labeling/blocking of primary amines followed by separate proteome digestions with multiple enzymes; (iv) N-terminal peptide enrichment by TAILS and peptide-level fractionation; (v) analysis by high resolution LC–MS/MS, followed by peptide identification employing rigorous statistical validation of individual peptide spectrum matches from multiple database search algorithms; and (vi) functional annotation and classification.
Figure 1.

Identification of proteins and their termini from erythrocytes. (A) Schematic workflow. Erythrocytes (RBC) were enriched from leukocytes (WBC) by repeated Ficoll density gradient centrifugations, lysed, and separated into membrane, soluble, and soluble hemoglobin-depleted protein fractions. Proteins were denatured and primary amines of proteins with free N-termini and Lys side chains blocked by dimethylation (light gray triangle), followed by digest with trypsin or GluC. Note that unlike shotgun proteomics workflows, TAILS requires labeling at the protein level before trypsin or GluC digestion to isolate and identify the N termini present in the sample. For protein identification, an aliquot of the tryptic digest was removed (preTAILS). N-terminal peptides were enriched using TAILS, including both in vitro dimethylated (gray triangle) and naturally blocked N-termini (black tilted square). Peptides from preTAILS and TAILS were fractionated off-line by SCX-chromatography, analyzed by LC–MS/MS, and identified using three different database search engines before statistical validation and protein identification using the Trans Proteomic Pipeline. (B) Enrichment of erythrocytes and depletion of white blood cells and platelets by repeated gradient (grad.) centrifugations. PLT, platelets; cell counts depicted for: cell pellet, packed cells after serum removal; grad. 1, after first Ficoll gradient; grad. 2, after second Ficoll gradient; final, erythrocyte preparations used to prepare proteome samples. (C) Proteins and (D) N termini identified in membrane (87 MS runs), soluble (147 MS runs), and hemoglobin-depleted (42 MS runs) protein fractions. (E) Proteins and (F) N termini identified in proteome analysis from tryptic digests (preTAILS), enriched N terminal peptides from tryptic digest (Trypsin TAILS) or GluC digest (GluC TAILS). Spectra of (G) trypsin and (H) GluC-digested samples matched to peptide sequences by semispecific database searches with Mascot, X!Tandem, and MS-GF+.
As in any study of cell-type-specific proteomes, we strove to obtain highly pure erythrocyte preparations because minor contaminations from leucocytes, reticulocytes or plasma could lead to the erroneous assignment of proteins from these sources as erythrocyte proteins. At the same time, identification of endogenous proteolytic protein processing necessitated prevention of postsampling proteolysis, which is best achieved by short sample handling times and cold temperatures. To satisfy both demands, we isolated crude erythrocytes directly after drawing whole blood from healthy volunteer donors in an adjacent in-house facility (Figure 1A). Packed erythrocytes were further purified by repeated centrifugation through a Ficoll–Hypaque cushion, reported to be the most effective of four different methods for depletion of leucocytes and reticulocytes from erythrocyte preparations,14 until cell counts for platelets were below detection limit (<1 platelet/nL) and cell counts for white blood cells were <13 per million erythrocytes (Figure 1B).
Purified erythrocytes were lysed in the presence of a panel of protease inhibitors and separated into crude membrane and soluble protein fractions. In some experiments, hemoglobin was depleted from a part of the soluble fraction using a commercial kit (Figure 1A). This crude protein-level prefractionation proved helpful in identifying additional proteins (Figure 1C) and N termini (Figure 1D). Similarly, analysis of the shotgun-like “preTAILS” fraction improved confidence and thus numbers of identified proteins by facilitating detection of multiple peptides for 45% of all identified proteins (Figure 1E). In addition to this shotgun-like preTAILS, 20% of the proteins were identified by at least two peptides using TAILS. Separate digestion with GluC and trypsin prior to N termini enrichment by TAILS results in the generation of distinct N terminal peptides from the same protein (Figure 1A). This increased confidence in N termini identification where both peptides were identified and enabled detection of N termini that resulted in peptides with physical properties that were not amenable to MS analysis in either one of the two conditions (Figure 1F). Note that the number of protein and peptide identifications does not represent a rigorous technical comparison of the efficiency of each step because varying numbers of LC–MS/MS runs were analyzed. Finally, the use of three different search engines for the semispecific database searches greatly increased the number of assigned spectra (Figure 1G,H), particularly for the GluC data sets that showed a strikingly poor overlap between the three search engines (Figure 1H). For both trypsin and GluC data sets the new search algorithm MS-GF+20,21 remarkably outperformed the older Mascot and X!Tandem algorithms, as also reported by others.33,34 The performance gain for GluC-digested proteomes can at least in part be explained by the fact that MS-GF+, in contrast with the older algorithms, has been trained using GluC-specific spectra (personal communication).
3.2. Erythrocyte Proteome
In total, we identified 1234 proteins and isoforms, including both cytosolic and membrane proteins at a protein level FDR of ≤0.7% or at a peptide level FDR ≤ 1% with two independent supporting spectra. To further assess the purity of our erythrocyte preparations and exclude potential contaminations, we interrogated our data set for the presence of well-established cluster of differentiation (CD) marker proteins that discriminate between differentiated blood cells.35 We found 13 of the 30 CD markers known to be present on erythrocytes (Table 1, Supplementary Table S1 in the Supporting Information) and only 1 out of 149 CD markers that are not present in erythrocytes. In addition, reticulocyte-specific proteins may originate as low-abundance relics of the gradual maturation of reticulocytes to erythrocytes. Although we could not store erythrocytes for 72 h to ensure reticulocyte maturation,7 as this would also lead to storage-induced protein processing,36 we did not identify the reticulocyte-specific proteins CD71 (transferrin receptor),37 integrin α4β1,38 and the ferritin receptor39 (Table 1). Hence we concluded that our preparation was essentially free from nonerythrocyte contaminants, including reticulocytes, to designate the identified proteins as erythrocyte constituents.
Table 1. Purity of Erythrocyte Preparation.
| cluster of differentiation | erythrocyte | reticulocyte | protein name | UniProt ac | number peptides identified | number spectra identified |
|---|---|---|---|---|---|---|
| CD233 | + | – | band-3 anion transport protein | P02730 | 245 | 2751 |
| CD236R | + | – | glycophorin-C | P04921 | 16 | 132 |
| CD235a | + | – | glycophorin-A | P02724 | 20 | 94 |
| CD238 | + | – | kell blood group glycoprotein | P23276 | 16 | 72 |
| CD239 | + | – | basal cell adhesion molecule | P50895 | 10 | 27 |
| CD95 | + | – | fatty acid synthase | P49327 | 6 | 19 |
| CD47 | + | – | leukocyte surface antigen CD47 | Q08722t | 2 | 10 |
| CD147 | + | – | basigin | P35613 | 1 | 10 |
| CD242 | + | – | intercellular adhesion molecule 4 | Q14773 | 2 | 10 |
| CD108 | + | – | semaphorin-7A | O75326-2 | 3 | 8 |
| CD241 | + | – | ammonium transporter Rh type A | Q02094 | 2 | 8 |
| CD58 | + | – | lymphocyte function-associated antigen 3 | P19256 | 2 | 5 |
| CD99 | + | – | CD99 antigen | P14209 | 2 | 4 |
| CD107b | – | – | lysosome-associated membrane glycoprotein 2 | P13473 | 1 | 2 |
| CD71 | – | + | transferrin receptor 1 and 2 | P02786; Q9UP52 | 0 | 0 |
| CD49D | – | + | integrin alpha-4 | P13612 | 0 | 0 |
| – | + | scavenger receptor class A, member 5; ferritin receptor | Q6ZMJ2 | 0 | 0 |
Comparison of our erythrocyte protein data set to the published proteomes of two nucleated human cell lines, U2OS40 and HeLa,41 reflected the specialized proteome of erythrocytes (Figure 2A). In line with the major function of erythrocytes, we found among the 142 proteins uniquely observed in the erythrocyte proteome significant enrichment of key proteins involved in gas and ion transport and exchange, hemoglobin binding, and cytoskeleton binding (Figure 2B). Functional terms enriched among proteins common to both erythrocytes and proteomes of nucleated cells included the components of the antioxidant and ubiquitin/proteasome systems, proteases, signaling components, and proteins associated with remodeling of the cytoskeleton (Figure 2C). Furthermore, we observed many of the proteins engaged in energy pathways (glycolysis, Supplementary Figure S1 in the Supporting Information), remodeling of the actin cytoskeleton (Supplementary Figure S2 in the Supporting Information), and protein homeostasis (ubiquitin system, Supplementary Figure S3 and proteasome complex, Supplementary Figure S4 in the Supporting Information).
Figure 2.

Erythrocyte proteome. (A) Comparison of the erythrocyte proteome with the proteomes of two nucleated cell lines, U2OS40 and HELA41 Gene Ontology enrichment (pval <0.05) of molecular function terms associated with (B) proteins unique to erythrocytes and (C) proteins common to erythrocytes and nucleated cells. (D) Overlap between our data set and all known erythrocyte proteins.42 (E) Method by which the 281 proteins uniquely identified in this study were identified. (F) Chromosome distribution of the genes encoding for the identified protein displayed as percent of total number of proteins encoded on a given chromosome. Dark blue: at least one N terminus identified; light blue: only protein identified; red: observed “missing” proteins. Labels: Absolute number of proteins with N terminus identification/protein only identification/observed “missing” proteins. (G) Number of copies for select proteins in erythrocytes.43
The erythrocyte proteins identified in this study include the majority of the 592 proteins reported in the early landmark paper by Pasini et al.7 and showed significant overlap with the largest data set to date, the 1578 cytosolic proteins identified by Roux-Dalvaix et al.,11 using the ProteoMiner technology (Supplementary Figure S5 in the Supporting Information). In comparison with all known erythrocyte proteins, very recently compiled by Goodman et al.,42 281 proteins identified in our data set have not been previously observed (Figure 2D, Supplementary Table S9 in the Supporting Information). The majority of these were found by TAILS (Figure 2E), suggesting that they represent low-abundance proteins that benefited from N-terminal enrichment for sample simplification or by identification of semitryptic peptides exhibiting favorable mass spectrometric detection properties such as removal of long or hydrophobic or highly negatively charged sequences from their parent peptide, which was otherwise difficult to detect by traditional tryptic peptide analysis, thereby enabling their identification for the first time.
Similar to plasma, the concentration of erythrocyte proteins varies greatly. For cytosolic proteins, cell copy numbers range from 300 million molecules of hemoglobin to 30 000 molecules of adducin A and B, with many lower abundant proteins to be expected. For erythrocyte membrane proteins, the range spreads from band-3 anion-transporting protein (band 3) at 1.2 million copies/cell to the complement receptor type 1 (CR1) at 20 to 1500 copies.43 Using our workflow, we identified proteins representative of the entire known concentration range, from highly abundant hemoglobin to low abundant adducin A and B and CR1 (Figure 2F), hence covering a range of at least five orders of magnitude.
To support the C-HPP we mapped the identified proteins to their encoding chromosomes and observed a relatively even representation of 4–9% of all encoded proteins (Figure 2G). Interestingly, we obtained evidence for six of the missing proteins (Table 2, Supplementary Table S8 in the Supporting Information, representative spectra are shown in Supplementary Figure S6–S11 in the Supporting Information) that had previously escaped mass spectrometric detection (neXtProt evidence level PE2). Two of these were encoded on chromosome 2 and one each on chromosomes 3, 9, 19, and 21. Five of these proteins, the cancer/testis antigen 75 (CT75, Q6PK30, 2q36.1), the uncharacterized protein C9orf84 (CI084, Q5VXU9,9q31,3), protein FAM43A (FA43A, Q8N2R8, 3q29), the PR domain zinc finger protein 15 (PRD15, P57071, 21q22.3), and the leucine-rich repeat transmembrane protein 1 (LRRT1, Q86UE6, 2p12), were found due to our workflow and database search strategy. These proteins were identified by peptides representing N- or C-termini of proteolytically processed protein species, which therefore matched the specificity of the protease used for proteome digest, that is, trypsin or GluC, only on one side. We specifically enriched and searched such “semi-specific” peptides that would be missed in conventional “specific” database searches. The identification of FAM43A and LRRT1 furthermore benefitted from the use of GluC as an alternative digestive protease because those termini were not found in tryptic digests. Notably, LRRT1 was identified by 58 high-confidence PSMs across all four biological replicates (Supplementary Table S8 in the Supporting Information). Identification of the sixth of the missing proteins, intercellular adhesion molecule 4 (ICAM4, Q14773, 19p13.2), was enabled by cell-type-specific analysis of erythrocytes. This, combined with the increased sensitivity and coverage of the erythrocyte proteome achieved through improved mass spectrometry instrumentation and database search algorithms, is the most likely explanation why this protein could be identified with two peptides in this study while it has been missed in previous proteomic analyses of erythrocytes. ICAM4 is involved in attachment of erythrocytes to the endothelium and has been implicated in sickle cell disease.44 Observation of two peptides now enables monitoring and detailed mechanistic studies of ICAM4 using targeted proteomic approaches. Together, these results validate our strategy of applying N terminomics on specific cells that are not often analyzed by proteomics for the detection of missing proteins within the C-HPP.
Table 2. Mass Spectrometric Identification of Proteins Classified with nextProt Evidence Level PE2 (Transcript Only).
| protein AC | protein name | nextProt evidence level | chromosome | chromosome band | found in | enzyme | suggested reason why previously not identified |
|---|---|---|---|---|---|---|---|
| Q14773 | intercellular adhesion molecule 4 | transcript | 19 | p13.2 | preTAILS | trypsin | cell type/tissue-specific expression |
| Q5VXU9 | uncharacterized protein C9orf84 | transcript | 9 | q31.3 | TAILS | trypsin | semispecific peptide representing C-terminal processing |
| Q8N2R8 | protein FAM43A | transcript | 3 | q29 | TAILS | GluC | semispecific N terminal peptide, use of GluC for digestion |
| Q6PK30 | cancer/testis antigen 75 | transcript | 2 | q36.1 | TAILS | trypsin | semispecific N terminal peptide |
| P57071 | PR domain zinc finger protein 15 | transcript | 21 | q22.3 | TAILS | preTAILS | trypsin | semispecific N terminal peptide |
| Q86UE6 | leucine-rich repeat transmembrane neuronal protein 1 | transcript | 2 | p12 | TAILS | preTAILS | GluC | semispecific N terminal peptide, use of GluC for digestion |
3.3. Erythrocyte N Terminome
The main focus of this study was the identification and characterization of protein N-termini in human erythrocytes. We identified 1369 N-termini at <1% FDR, of which 45% had a free α-amine at their N-terminus (identified as N-terminal heavy dimethylated peptides, see Figure 1), 53% were acetylated, and 2% had an N-terminal pyroGlu derived by conversion of Glu (Figure 3A). Notably, only 32% of the observed N termini could be explained by known, annotated protein starts (Figure 3B). These included termini starting with intact or removed initiator-Met (hereafter designated as original N termini) or at sites consistent with maturation by signal peptide or propeptide removal (Figure 3C). An additional 4% (51 N termini) started at or directly after a genome encoded internal Met and had the sequence properties favoring initiator Met retention or removal (Supplementary Figure S12 in the Supporting Information),45,46 respectively, indicating alternative translation initiation sites.47 84% (43 N termini) of those alternative translation initiation sites were acetylated with similar sequence determinants and in similar proportion as N termini starting at positions 1 and 2 of the genome encoded protein sequence, indicating cotranslational acetylation (not shown).
Figure 3.

Modification and functional classification of all identified protein termini. (A) Distribution of protein termini identified with naturally free amino group (free N term), N-terminal acetylation (acetylated), or pyro-Glu (pyroE) formation. (B) Protein termini with annotated functions, termini identified as likely alternative translation initiation sites (alt. start), and termini with unannotated function. (C) Functional classification of annotated protein termini. Alt NME, alternative start with initiating Met excised; alt. Met, alternative start at initiating Met; NME, N-terminal Met excision; Met, start at initiating Met; SP, signal peptide removed; Pro, propeptide removed. (D) N-terminal modification of unannotated protein termini. (E) N-terminal modification of protein termini with processed (left) and intact (right) initiating Met.
Only 3% of the annotated protein termini were derived from maturation by signal peptide removal, reflecting the lack of internal membrane structures in which some proteins with a signal peptide are inserted, and 1% were at known pro-peptide maturation sites. Consistent with previous studies,45,47 the majority (68%) of the original N termini started at position 2, indicating N terminal Met excision, and 29% had an intact initiating Met. The sequence determinants for this common cotranslational Met processing were consistent with the literature,45−47 with Met retained when followed by charged amino acids and removed when followed by small, uncharged residues (Supplementary Figure S1 in the Supporting Information). Furthermore, ∼90% of the original N termini, with both intact or processed initiating Met, were acetylated (Figure 3E).
Remarkably, the majority (64%) of all identified N termini mapped to positions within the genome encoded protein sequences (hereafter designated as internal N termini), indicating endoproteolytic processing (Figure 3B). This compares to the observation of 44% internal N termini in our previous N terminome analysis of healthy murine skin.47 We postulate that the increased percentage of such sites in erythrocytes versus skin reflects restrained turnover pathways for erythrocyte proteins that have evolved to compensate for the lack of de novo protein synthesis in these cells over their lifetime of ∼120 days. Surprisingly, 35% of these previously unknown, processed protein N termini in erythrocytes were post-translational acetylated (Figure 3D). This prompted us to further analyze stability determinants for processed proteins in erythrocytes.
3.4. Stable and Unstable N Termini of Erythrocyte Proteins and the N-End Rule
The N-terminal amino acid and its modification are known to have a major impact on protein stability and half life.13 According to the N-end rule, N-terminal amino acids can be grouped as primary, secondary, and tertiary destabilizing residues. Primary destabilizing residues are recognized by components of the ubiquitin system (N-recognins) and targeted for degradation by the proteasome. They are further subdivided into types 1–3 based on the dominant N-recognin responsible for their targeting.48 Secondary destabilizing residues require either acetylation or arginylation, which is the conjugation of arginine, a primary destabilizing residue, to the N terminal Asp or Glu prior to recognition by the ubiquitin system. Tertiary destabilizing residues additionally have to be deamidated (Asn, Gln) or oxidized (Cys) prior to arginylation.
Most proteins are translated with N-terminal degradation signals, but these are immediately masked by folding or protein–protein interactions.13 As a result, correctly folded or chaperoned proteins are stabilized even with a destabilizing signal, whereas misfolded or misassembled proteins display the N terminus. Upon recognition of the destabilizing residue or acetylation, such misfolded or misassembled proteins are specifically recognized and quickly degraded. In other words, destabilizing residues may in fact form stable protein N termini if the protein is correctly and stably folded or the additional steps required to target proteins with secondary or tertiary destabilizing residues for degradation are withheld or delayed. We speculate that this occurs in erythrocytes, where unusual measures have evolved to achieve better stability of less than perfect proteins in the absence of de novo synthesis.
The likelihood of observing specific N-terminal peptides by mass spectrometry depends to a large degree on their concentration and hence on the abundance and half-life of the corresponding protein species in the cell. For example, as previously discussed, a protein with a destabilizing N-terminal residue or acetylation might be detectable if it is correctly folded and so not recognized by the N-recognins. However, if the protein chain is not correctly folded, it may still be detected because of a high original concentration of protein. In general, the N-end rule held true in erythrocytes for the proteins present with their original N terminus (not shown).
3.5. N Termini of Post-Translational Cleaved Protein Species Follow the N-End Rule
Proteolytically processed cytoplasmic proteins are also exposed to the same quality-control machinery as full-length proteins. Indeed, rapid clearance of cleaved protein species carrying destabilizing N-terminal residues has been shown to counteract apoptosis49 and limit accumulation of protein fragments prone to aggregation during neurodegeneration.50 In view of the remarkable large percentage of proteins with internal N termini (64%), we postulated that the N-end rule could assist in distinguishing internal protein termini, representing stable processed protein species with novel functions12 from those of short-lived degradation and unstable intermediates. To do so, we first determined the relative occurrence of each amino acid as the terminal residue of internal protein N termini (Figure 4A). As expected, types 1 and 2 primary destabilizing residues were generally underrepresented compared with the natural amino acid abundance (Figure 4A). However, Ala, Ser, and Thr, defined as type-3 primary destabilizing residues in mammals,48 were markedly overrepresented. Nonetheless, type-3 primary destabilizing residues convey short protein half-life times in reticulocyte lysates but not in yeast.48 To account for this paradox, the authors proposed a cell type and condition-specific activity of type 3-specific N-recognins of unknown molecular identity to enable bulk degradation of otherwise long-lived proteins in specific processes such as enucleation and loss of internal compartments during reticulocyte to erythrocyte maturation. Consistent with this hypothesis, our results suggest that type-3-specific N-recognins are inactivated or lost in mature erythrocytes, rendering Ala, Ser, and Thr once again nondestabilizing unless further modified.
Figure 4.

Internal protein N terminal residues and their modification determine protein stability. (A) Occurrence and identity of internal protein N terminal amino acid (i.e., starting at positions >2 in their protein sequence) compared with natural amino acid abundance and acetylation state. Blue, free N-terminus; red, acetylated N-terminus; gray, natural abundance. * pval <0.05; ** pval <0.01. (B) Fold change of N-terminal acetylation for each amino acid of all internal N-termini relative to average post-translational acetylation, shown in vertical bars labeled primary and secondary. * pval <0.05; ** pval <0.01. (C) Proposed terminus stability classification categories based on the N-end rule and N-terminal acetylation status. (D) Gene Ontology term enrichment (pval <0.05) of proteins with N termini falling into the stability classes defined in panel C. Yellow, free destabilizing; orange, acetylation destabilized; light blue, free nondestabilizing; dark blue, acetylation stabilized.
3.6. N-Terminal Acetylation and Stability of Post-Translational Cleaved Protein Species
In yeast, secondary destabilizing residues (including Ala, Ser, Thr) become quite destabilizing upon Nα-acetylation,51 whereas other residues such as primary destabilizing Ile become stabilizing.52 In erythrocytes, we observed significantly higher relative levels of Nα-acetylation among primary destabilizing residues, in particular, Leu, Ile, and Phe (Figure 4B). In contrast, secondary destabilizing residues were generally less frequently Nα-acetylated than the average. In particular, Ser and Thr showed an extremely small acetylated fraction, whereas Nα-acetylation of Ala and Val was moderately increased.
On the basis of these observations, we grouped the observed internal N termini into four categories defined by their N-end rule classification and their Nα-acetylation state (Figure 4C): (i) free destabilizing termini, including unmodified types 1 and 2 primary destabilizing residues; (ii) free nondestabilizing termini, comprising type-3 primary destabilizing residues and unmodified secondary and tertiary destabilizing residues (i.e., lacking the destabilizing acetylation and arginylation); (iii) acetylation-destabilized termini, including acetylated secondary destabilizing residues, as recognized before in yeast;51 and (iv) a new category of acetylation-stabilized termini, including Asp and Glu and acetylated primary destabilizing residues and tertiary destabilizing residues for which acetylation prevents their destabilizing deamidation or arginylation or both.
Considering the efficiency of the ubiquitin/proteasome system, one would expect all protein species with exposed destabilizing N-terminal residues to be short-lived, rapidly cleared from the system, and thus essentially nondetectable. While destabilizing original termini can be efficiently masked by chaperones during translation, there is no such protective mechanism during post-translational proteolysis, leaving the majority of internal termini exposed. In line with this expectation, we found a significant overrepresentation of free nondestabilizing and acetylation-stabilized internal termini (Figure 4A,C). However, a considerable fraction of the observed internal N termini were classified as free destabilizing or acetylation-destabilized. This prompted us to perform a GO term enrichment analysis for the four stability classes. Proteins with free destabilizing (yellow) and acetylation-destabilized (red) termini were overrepresented among the spectrin-associated cytoskeleton and hemoglobin complexes and were frequently involved in antioxidant activity and protein oligomerization (Figure 4D). These GO classifications included the most abundant erythrocyte proteins such as hemoglobin, band-3 protein, and spectrin. Hence, the observation of high amounts of unstable termini may be explained by the fact that degradation intermediates of such high abundance proteins can accumulate to higher steady-state levels than stable low-abundance proteins. In contrast, proteins with free nondestabilizing termini (light blue) were found to be involved in lower abundance cell–cell signaling and regulatory and proteolytic pathways. Interestingly, proteins with acetylation-stabilized (dark blue) termini were strongly overrepresented in glycolysis and heme-binding processes. This indicates the in vivo relevance of a protective role of Nα-acetylation against Nα-glycation, a frequent side reaction in erythrocytes.53
3.7. Discrimination of Putative Stable Protein Species and Degradation Intermediates
We frequently observed multiple N termini per protein, especially for highly abundant proteins such as hemoglobin (Figure 5A). Biologically, it is very important to discriminate between protein species that represent stable, physiologically relevant protein species and those from degradation intermediates. To do so, we developed two empirical scoring systems and correlated the identified N termini with information on known termini, proteolytic processing and protein features in TopFIND25 The Termini Cluster Score (TCS, green curve) is a measure for clustering of individual termini and thus indicates sequence regions that are particularly susceptible to proteolysis. The Termini Prevalence Score (TPS, black curve) integrates the overall number of N termini observed for each protein with the observation frequency for each N terminus (number of biological replicates and proportion of supporting spectra) and local TCS, thus indicating dominant termini. These scores are then related to the stability class previously defined to indicate termini representing good candidates for stable, functional protein species.
Figure 5.
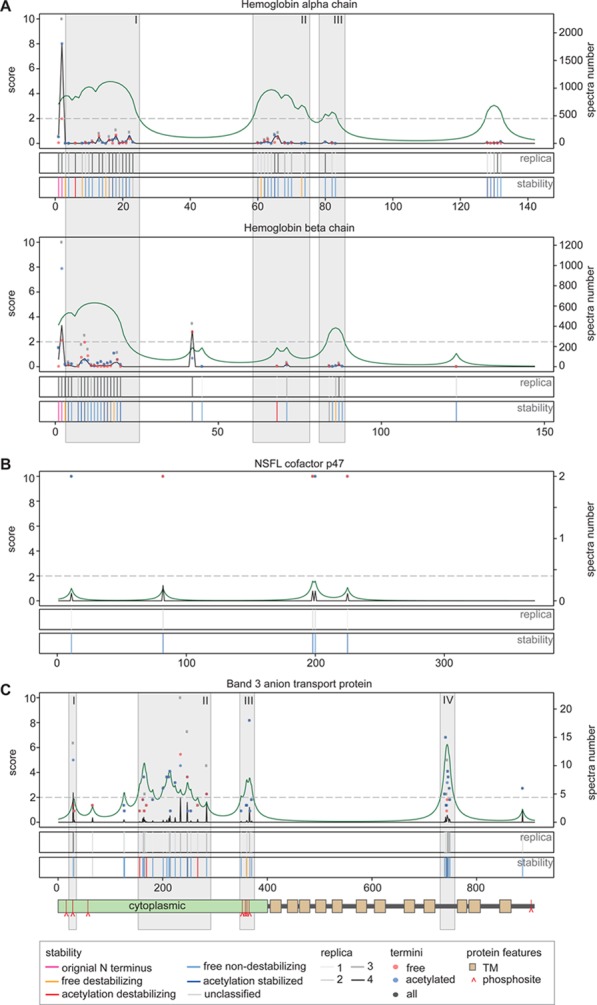
Discrimination of degradation intermediates from functional protein species. The positions of identified N-termini are indicated relative to the annotated protein sequence (x axis). For each example, the top panels display the number of free (blue dots), acetylated (red dots), and total (gray dots) spectra (right y axis) measured at each position. The terminus prevalence score (TPS, black curve, left y axis) is a measure for the estimated relevance. The terminus cluster score (TCS, green curve, left y axis) is a measure for the potential of a protein species to start within a given sequence span. TPS and TCS are considered relevant above a threshold of two (dashed gray horizontal line). The first of the lower two plots represents the number of biological replica in which a terminus has been identified (light gray to dark gray). The lowest plot displays the terminus stability classification we introduced in Figure 4A) N-termini of hemoglobin chains alpha and beta. In both chains, the predominant species start with their original Met-processed N termini, as indicated by high TPS scores. Four clusters with a TCS >2 are identified in the hemoglobin alpha chain of which three (gray boxes: I, II, III) are also found in hemoglobin beta chain (albeit II with a subthreshold score). (B) Degradation remnants of the nuclear protein NSFL cofactor p47 identified by few termini, each with a low TPS, scattered across the genome-encoded sequence with overall low TCS scores. (C) Degradation remnants and band-3 species with altered functions. All identified N-termini are located in cytoplasmic domains or loops. Four distinct regions (I–IV) are identified by high TPS or TCS scores. (I) A single, reproducibly identified stable N-terminus at position 29. (II) Region in the cytoplasmic domain susceptible to proteolysis. (III) Cluster of multiple free N-termini correlating with a cluster of phosphorylation sites in the cytoplasmic domain. (IV) Dense cluster of predominantly nondestabilizing free termini falling into a potentially cytoplasmic loop within the transmembrane region of band 3. Lower panel: protein feature representation: green box: cytoplasmic domain; brown box: transmembrane domain; red ^: phosphorylation site.
We applied this scoring scheme to all identified proteins (Supplementary Figure S13 in the Supporting Information). For example, high TCS scores at position 2 of both hemoglobin alpha and beta indicate that the likely the dominant protein species contains the original, Met-processed termini (Figure 5A). TPS scoring further identified four termini clusters in hemoglobin alpha chain, three of which (I, II, III) were also observed in hemoglobin beta chain. The conservation of the general cluster pattern across both proteins clearly highlighted regions susceptible to truncation. However, all clusters contained a mix of termini from all four stability classes (free destabilizing, acetylation-stabilized, free nondestabilizing, acetylation-destabilized). Therefore, we conclude that these four clusters likely reflect accumulating fragments, either formed by reactive oxygen species (ROS)-induced chain breakage or nontargeted proteolysis, including sequential removal of single amino acids by aminopeptidase activity after a primary cleavage event, a process also known as ragging.
Nuclear and mitochondrial proteins observed in previous erythrocyte proteome studies, often with unexpected apparent molecular weights,7 were suggested to represent nonfunctional remnants of erythrocyte maturation. We also found a few of these proteins, including nuclear NSFL cofactor p47 features (Figure 5B). However, we identified only very few termini displaying stabilizing N terminal residues, featuring low TPS and TCS scores, that were scattered randomly along the genome encoded sequence of NSFL cofactor p47. This suggests that these species are indeed highly variable transient degradation intermediates with increased stability but no particular biological significance, possibly from relatively young erythrocytes.
3.8. Identification of Functional Protein Species
Consistent with previous observations of proteolytic processing,7,9,54 we identified many different N termini mapping to various positions in the most abundant membrane protein, the band-3 anion transporter (Figure 5C). Band-3 protein additionally fulfills a multitude of functions as a scaffolding protein for organization of the cytoskeleton, components of the glycolytic pathway, hemoglobin,and other cytosolic proteins54 that may be affected by proteolysis. For instance, we observed a species starting at position 29 (Figure 5C,I) that resembles a mutant of band 3 lacking the first 11 amino acids, which prevents binding of aldolase but not other glycolytic enzymes.55 This species also lacks the Tyr8 and Tyr21 phosphorylation sites, whose phosphorylation is required for recruitment of Lyn kinase and subsequent phosphorylation at Tyr359 and Tyr904, likely affecting additional interactions.56 We further observed a large cluster of N termini in the cytoplasmic domain (II) that might represent fragments resulting from oxidative damages to band-protein during aging. The more stable among these fragments most likely retain their transporter function but lose the ability to interact with many of their intracellular interaction partners like band 4.2 and ankyrin.43,57 A second cluster of N termini (III) overlaps with a cluster of known phosphorylation sites, including Tyr359. This correlation might be indicative of a crosstalk between phosphorylation and proteolytic processing.58 This is supported by the observations that phosphorylated band-3 species accumulate in older erythrocytes59 and that the cytoplasmic domain is released into the cytoplasm during prolonged storage.60 Furthermore, evidence of processing of band 3 by calpains, which are nonlysosomal intracellular proteases, was found together with calpains 1 and 5 and their inhibitor calpastatin (Table 3). Band-3 cleavage is known to eliminate the interactions with cytoplasmic and cytoskeletal proteins and promote band-3 clustering.54 Lastly, a third cluster (IV) is located in a cytoplasmic loop of the transmembrane region, indicating high susceptibility to proteolysis. The identification of mostly free nondestabilizing termini within this cluster suggests that these fragments are stable and might therefore still be part of the original complex assembly and thus retain some biological relevant function.
Table 3. Proteases and Protease Inhibitors Identified in Erythrocytes.
| Proteases | |||
|---|---|---|---|
| protein name | UniProt AC | MEROPS ID | comment |
| abhydrolase domain-containing protein 16A | O95870 | S09.065 | |
| acylamino-acid-releasing enzyme | P13798 | S09.004 | |
| aminopeptidase B | Q9H4A4 | M01.014 | |
| aspartyl aminopeptidase | Q9ULA0 | M18.002 | |
| ataxin-3 | P54252 | C86.001 | |
| bleomycin hydrolase | Q13867 | C01.084 | |
| calpain-1 catalytic subunit | P07384 | C02.001 | |
| calpain-5 | O15484 | C02.011 | |
| caspase-3 | P42574 | C14.003 | inactive proform |
| caspase-6 | P55212 | C14.005 | |
| COP9 signalosome complex subunit 5 | Q92905 | M67.002 | |
| cysteine protease ATG4B | Q9Y4P1 | C54.003 | |
| cytosol aminopeptidase | P28838 | M17.001 | |
| cytosolic nonspecific dipeptidase | Q96KP4 | M20.005 | |
| dipeptidyl peptidase 3 | Q9NY33 | M49.001 | |
| dipeptidyl peptidase 9 | Q86TI2 | S09.019 | |
| endoplasmic reticulum aminopeptidase 1 | Q9NZ08 | M01.018 | |
| insulin-degrading enzyme | P14735 | M16.002 | |
| kell blood group glycoprotein | P23276 | M13.090 | |
| leukotriene A-4 hydrolase | P09960 | M01.004 | |
| Lys-63-specific deubiquitinase BRCC36 | P46736-2 | M67.004 | |
| nardilysin | O43847 | M16.005 | |
| probable aminopeptidase NPEPL1 | Q8NDH3 | M17.006 | |
| probable ubiquitin carboxyl-terminal hydrolase FAF-X | Q93008 | C19.017 | |
| prolyl endopeptidase | P48147 | S09.001 | |
| proteasome subunit beta type-5 | P28074 | T01.012 | |
| proteasome subunit beta type-6 | P28072 | T01.010 | |
| proteasome subunit beta type-7 | Q99436 | T01.011 | |
| proteasome subunit beta type-9 | P28065 | T01.013 | |
| protein DJ-1 | Q99497 | C56.002 | |
| secernin-1 | Q12765 | C69.003 | |
| secernin-2 | Q96FV2 | C69.004 | |
| secernin-3 | Q0VDG4 | C69.005 | |
| signal peptidase complex catalytic subunit SEC11A | P67812 | S26.009 | |
| STAM-binding protein | O95630 | M67.006 | |
| thimet oligopeptidase | P52888 | M03.001 | |
| tripeptidyl-peptidase 2 | P29144 | S08.090 | |
| ubiquitin carboxyl-terminal hydrolase 7 | Q93009 | C19.016 | |
| ubiquitin carboxyl-terminal hydrolase 5 | P45974-2 | C19.001 | |
| ubiquitin carboxyl-terminal hydrolase 5 | P45974 | C19.001 | |
| ubiquitin carboxyl-terminal hydrolase 11 | P51784 | C19.014 | |
| ubiquitin carboxyl-terminal hydrolase 14 | P54578 | C19.015 | |
| ubiquitin carboxyl-terminal hydrolase 15 | Q9Y4E8 | C19.022 | |
| ubiquitin carboxyl-terminal hydrolase 19 | O94966 | C19.024 | |
| ubiquitin carboxyl-terminal hydrolase isozyme L3 | P15374 | C12.003 | |
| ubiquitin carboxyl-terminal hydrolase isozyme L5 | Q9Y5K5 | C12.005 | |
| ubiquitin thioesterase OTU1 | Q5VVQ6 | C88.002 | |
| ubiquitin thioesterase OTUB1 | Q96FW1 | C65.001 | |
| ubiquitin-associated domain-containing protein 1 | Q9BSL1 | C19.M01 | |
| Xaa-Pro aminopeptidase 1 | Q9NQW7 | M24.009 | |
| Xaa-Pro dipeptidase | P12955 | M24.007 | |
| Protease Inhibitors | |||
|---|---|---|---|
| protein name | Uniprot AC | MEROPS ID | comment |
| calpastatin | P20810 | I27.001 | |
| cystatin-A | P01040 | I25.001 | |
| cystatin-B | P04080 | I25.003 | |
| histidine-rich glycoprotein | P04196 | I25.022 | |
| latexin | Q9BS40 | I47.001 | |
| leukocyte elastase inhibitor | P30740 | I04.006 | |
| phosphatidylethanolamine-binding protein 1 | P30086 | I51.002 | |
| serpin B9 | P50453 | I04.014 | |
Functional clues can also be derived from comparison of protein termini across a protein family and mapping to known protein structures. For instance, we identified the original N termini of four 14-3-3 proteins, known to regulate many intracellular processes often through phosphorylation-dependent interactions with hundreds of proteins.61 Most known functions of 14-3-3 proteins depend on the formation of homo- or heterodimers, which allows these proteins to act as scaffold proteins mediating interactions between binding partners. However, we consistently observed additional mostly nondestabilizing N termini mapping to positions 24 to 30 for the three proteins 14-3-3 beta/alpha, 14-3-3 theta, and 14-3-3 zeta/delta (Figure 6A, cluster I). Mapping of the processed termini on the 3D structure of 14-3-3 beta/alpha62 shows that these cleavages remove the first or second α helix, disrupting the dimerization interface (Figure 6B). Hence, we postulate that the observed post-translational proteolytic modification of several 14-3-3 isoforms generates dimerization-incapable monomers, similar in size and structure to a monomeric splice variant of 14-3-3 zeta lacking its first 22 residues.63 This is further supported by accumulating evidence that dimerization is not necessary for all 14-3-3 protein functions, although specific functions and interactions of monomeric species remain to be elucidated.61
Figure 6.
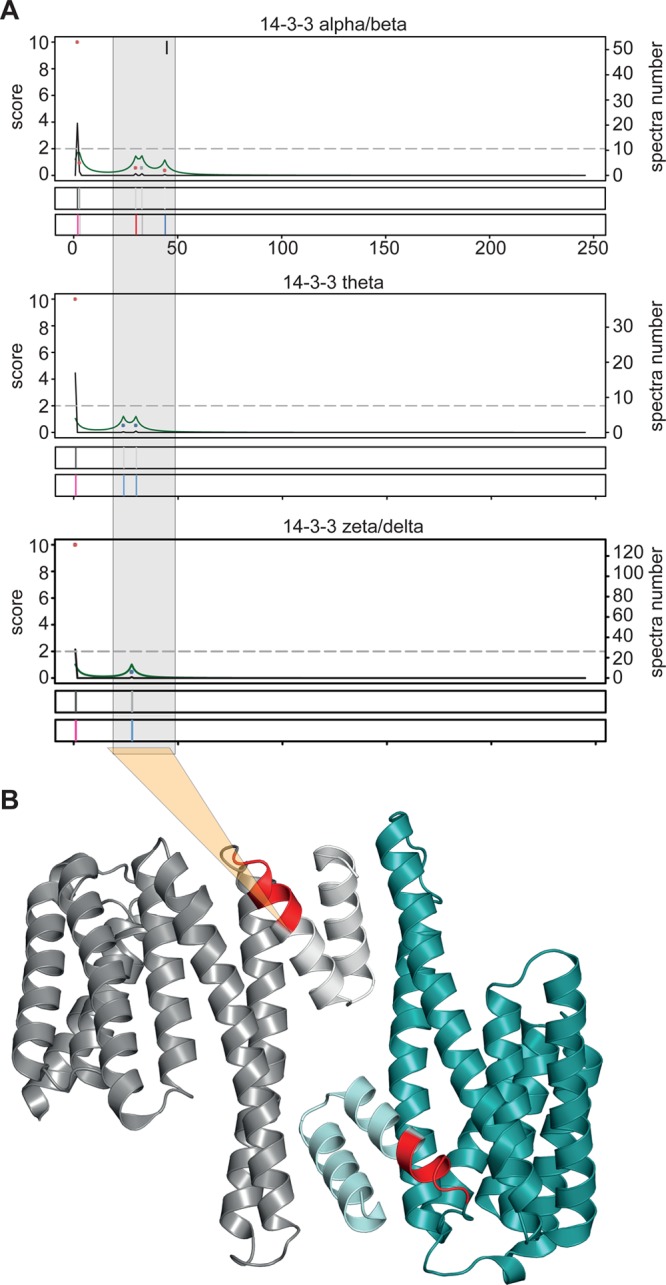
Functional protein species inferred from isoform comparison and crystal structure mapping. (A) Integrated terminus analysis of the 14-3-3-protein family. Family members 14-3-3 alpha/beta, theta, and zeta/delta all have a predominant species starting with original N termini (I). A second cluster of mostly stable N termini between positions 24–44 is conserved across all three proteins. (B) Crystal structure of 14-3-3 alpha/beta homodimer with terminus cluster II highlighted in red. Protein species starting with a terminus of this cluster lack the two N-terminal helices forming the interaction interface.
4. Conclusions
We provide an updated human erythrocyte proteome and the first proteome-wide study of protein termini and proteolytic processing in human erythrocytes that shows a remarkable 64% of termini lying internal to the annotated original terminus. Our analyses lead us to suggest that erythrocytes maintain functional fragments of critical proteins through acetylation-mediated stabilization of primary destabilizing terminal residues and retention of partially functional membrane protein fragments, in addition to inactivation of type-3-specific N-recognins. We postulate a functional link between cumulative phosphorylation and increased proteolysis of band 3 and show an example for conserved processing across three members of 14-3-3 protein family, leading to the generation of distinct monomeric protein species with altered functions. Finally, we provide high-confidence mass spectrometric evidence for six proteins that had previously only been detected as transcripts.
Mature erythrocytes are specialized, enucleated cells that remain active for ∼120 days before being cleared from circulation. To achieve their astonishing long life span despite losing their capacity for protein synthesis, erythrocytes mitigate the formation of ROS and risk of oxidative damages that is inherently linked to oxygen transport and maintain proteins in a functional state. Thus erythrocytes represent one extreme of a range of cells differing in cellular anabolic and catabolic activities. Studying erythrocytes has therefore facilitated recognition of protein-stability properties that are less developed or masked in other cells where ongoing synthesis can cloud interpretation of protein stability and half life. Thus, determination of erythrocyte proteome N termini and their modification state using a streamlined proteomic workflow enabled us to gain insights into protein quality control strategies employed by erythrocytes that are likely generally applicable to other cells.
Our N-terminomics analysis of erythrocyte proteins led to the recognition of stable protein species from which we derived new rules for protein stabilization. We propose a modified N-end rule for protein termini generated by proteolytic processing in the cytoplasm that we term “the stabilizing N-end rule”. This rule classifies protein termini based on the experimentally observed frequency of N-terminal amino acid residue and their post-translational Nα-acetylation status. The stabilizing N-end rule classification, in combination with a newly developed TCS and TPS scoring system for protein termini, enabled in-depth interpretation of the terminome. We distinguished between N termini likely to represent processed functional protein species and those resulting from degradation intermediates. This approach has broad applicability to future terminomics analyses and functional interpretation of proteomics data sets, such as those for the HPP.
This study also establishes a general workflow suitable for the in-depth determination of the position and nature of human protein N termini in different tissues and disease states, as envisioned as part of the C-HPP. The identification of six missing proteins confirmed the utility of our strategy of proteome simplification by N-terminal enrichment of a highly specialized cell type proteome coupled to analysis of in vivo protease generated new semitryptic peptides that exhibit altered mass spectrometric properties. Combining these three characteristics with the use of alternative digestion proteases for bottom-up proteomics is a powerful orthogonal approach for identification of potentially rare or low-copy-number proteins in the human proteome that have been missed in thousands of previous data sets. In addition, TAILS also provides direct in vivo evidence for distinct protein species differing from the canonical genome encoded form that can present critically alter function, localization, or interactions. The newly described scoring and classification system is, in principle, of universal nature and will greatly assist in shedding light on cell type and disease-specific activity of the N-end rule pathway, conservation of protein species, and critical core proteins and protein domains that require stabilization under specific physiological conditions.
Acknowledgments
We thank Brankica Culibrk and Iren Constantinescu (UBC CBR Research Blood Collection Suite) for phlebotomy services, Nikolay Stoynov (UBC Centre for High-Throughput Biology) for mass spectrometry data acquisition, Dr. Peter Schubert (UBC CBR) for helpful discussion, Dr. Ulrich Eckhard UBC CBR) for assistance in preparing Figure 6B, and our blood donors for their voluntary participation in this study. This work was supported by Canadian Institutes of Health Research grants (C.M.O.), the Michael Smith Foundation for Health Research (MSFHR, to P.F.L., P.F.H.), the Breast Cancer Society of Canada (P.F.L.), a UBC Center for Blood Research summer studentship (to K.N.), and Infrastructure Grants from the Canada Fund for Innovation and the MSFHR (UBC CBR). C.M.O. is a Canada Research Chair in Metalloproteinase Proteomics and Systems Biology. The funding agencies had no influence in the design, execution, and publication of this study.
Supporting Information Available
Supplementary Figure S1. Proteins of the glycolysis pathway identified in human erythrocytes. Supplementary Figure S2. Erythrocyte proteins involved in regulation of the action cytoskeleton. Supplementary Figure S3. Erythrocyte proteins involved ubiquitin-mediated proteolysis. Supplementary Figure S4. Proteasome components identified in human erythrocytes. Supplementary Figure S5. Comparison between erythrocyte proteome studies. Supplementary Figure S6. Evidence for missing protein cancer/testis antigen 75. Supplementary Figure S7. Evidence for missing protein intercellular adhesion molecule 4. Supplementary Figure S8. Evidence for missing protein leucine-rich repeat transmembrane neuronal protein 1. Supplementary Figure S9. Evidence for missing protein PR domain zinc finger protein 15. Supplementary Figure S10. Evidence for missing protein FAM43A. Supplementary Figure S11. Evidence for missing protein ‘uncharacterized protein C9orf84’. Supplementary Figure S12. Sequence determinants of cotranslational Met processing and N-terminal acetylation in human erythrocytes. Supplementary Figure S13. Positional annotation and scoring of all identified erythrocyte N termini in relation to their protein sequences. Supplementary Table S1. Identified CD markers. Supplementary Table S2. List of 1234 identified proteins. Supplementary Table S3. List of 1369 identified N termini. Supplementary Table S4. Peptide spectrum matches derived by three search engines and subsequent analysis by iProphet. Supplementary Table S5. Results of protein identification by proteinProphet. Supplementary Table S6. N termini of proteins encoded by chromosome 6. Supplementary Table S7. N termini of proteins encoded by chromosome 21. Supplementary Table S8. Evidence for missing proteins previously only identified at transcript level. Supplementary Table S9. List of 281 proteins not previously identified in erythrocyte proteome studies. This material is available free of charge via the Internet at http://pubs.acs.org.
Author Contributions
∥ P.F.L. and P.F.H. contributed equally.
The authors declare no competing financial interest.
Supplementary Material
References
- Paik Y.-K.; Jeong S.-K.; Omenn G. S.; Uhlen M.; Hanash S.; Cho S. Y.; Lee H.-J.; Na K.; Choi E.-Y.; Yan F.; Zhang F.; Zhang Y.; Snyder M.; Cheng Y.; Chen R.; Marko-Varga G.; Deutsch E. W.; Kim H.; Kwon J.-Y.; Aebersold R.; Bairoch A.; Taylor A. D.; Kim K. Y.; Lee E.-Y.; Hochstrasser D.; Legrain P.; Hancock W. S. The Chromosome-Centric Human Proteome Project for cataloging proteins encoded in the genome. Nat. Biotechnol. 2012, 30, 221–223. [DOI] [PubMed] [Google Scholar]
- Lane L.; Bairoch A.; Beavis R. C.; Deutsch E. W.; Gaudet P.; Lundberg E.; Omenn G. S. Metrics for the Human Proteome Project 2013–2014 and Strategies for Finding Missing Proteins. J. Proteome Res. 2014, 13, 15–20. [DOI] [PMC free article] [PubMed] [Google Scholar]
- Kleifeld O.; Doucet A.; Auf dem Keller U.; Prudova A.; Schilling O.; Kainthan R. K.; Starr A. E.; Foster L. J.; Kizhakkedathu J. N.; Overall C. M. Isotopic labeling of terminal amines in complex samples identifies protein N-termini and protease cleavage products. Nat. Biotechnol. 2010, 28, 281–288. [DOI] [PubMed] [Google Scholar]
- Frenette P. S.; Atweh G. F. Sickle cell disease: old discoveries, new concepts, and future promise. J. Clin. Invest. 2007, 117, 850–858. [DOI] [PMC free article] [PubMed] [Google Scholar]
- Wilson J. G.; Wong W. W.; Murphy E. E. 3.; Schur P. H.; Fearon D. T. Deficiency of the C3b/C4b receptor (CR1) of erythrocytes in systemic lupus erythematosus: analysis of the stability of the defect and of a restriction fragment length polymorphism of the CR1 gene. J. Immunol. 1987, 138, 2708–2710. [PubMed] [Google Scholar]
- Perrotta S.; Gallagher P. G.; Mohandas N. Hereditary spherocytosis. Lancet 2008, 372, 1411–1426. [DOI] [PubMed] [Google Scholar]
- Pasini E. M. In-depth analysis of the membrane and cytosolic proteome of red blood cells. Blood 2006, 108, 791–801. [DOI] [PubMed] [Google Scholar]
- Pesciotta E. N.; Sriswasdi S.; Tang H.-Y.; Mason P. J.; Bessler M.; Speicher D. W. A label-free proteome analysis strategy for identifying quantitative changes in erythrocyte membranes induced by red cell disorders. J. Proteomics 2012, 76, 194–202. [DOI] [PMC free article] [PubMed] [Google Scholar]
- van Gestel R. A.; van Solinge W. W.; van der Toorn H. W. P.; Rijksen G.; Heck A. J. R.; van Wijk R.; Slijper M. Quantitative erythrocyte membrane proteome analysis with Blue-native/SDS PAGE. J. Proteomics 2010, 73, 456–465. [DOI] [PubMed] [Google Scholar]
- Ringrose J. H.; van Solinge W. W.; Mohammed S.; O’Flaherty M. C.; van Wijk R.; Heck A. J. R.; Slijper M. Highly efficient depletion strategy for the two most abundant erythrocyte soluble proteins improves proteome coverage dramatically. J. Proteome Res. 2008, 7, 3060–3063. [DOI] [PubMed] [Google Scholar]
- Roux-Dalvai F.; Gonzalez de Peredo A.; Simó C.; Guerrier L.; Bouyssié D.; Zanella A.; Citterio A.; Burlet-Schiltz O.; Boschetti E.; Righetti P. G.; Monsarrat B. Extensive analysis of the cytoplasmic proteome of human erythrocytes using the peptide ligand library technology and advanced mass spectrometry. Mol. Cell. Proteomics 2008, 7, 2254–2269. [DOI] [PubMed] [Google Scholar]
- Lange P. F.; Overall C. M. Protein TAILS: when termini tell tales of proteolysis and function. Curr. Opin. Chem. Biol. 2013, 17, 73–82. [DOI] [PubMed] [Google Scholar]
- Varshavsky A. The N-end rule pathway and regulation by proteolysis. Protein Sci. 2011, 20, 1298–1345. [DOI] [PMC free article] [PubMed] [Google Scholar]
- Goodman S. R.; Hughes K. M. H.; Kakhniashvili D. G.; Neelam S. The Isolation of Reticulocyte-Free Human Red Blood Cells. Exp. Biol. Med. 2007, 232, 1470–1476. [DOI] [PubMed] [Google Scholar]
- Kleifeld O.; Doucet A.; Prudova A.; Keller U. A. D.; Gioia M.; Kizhakkedathu J. N.; Overall C. M. Identifying and quantifying proteolytic events and the natural N terminome by terminal amine isotopic labeling of substrates. Nat. Protoc. 2011, 6, 1578–1611. [DOI] [PubMed] [Google Scholar]
- Olsen J. V.; de Godoy L. M. F.; Li G.; Macek B.; Mortensen P.; Pesch R.; Makarov A.; Lange O.; Horning S.; Mann M. Parts per million mass accuracy on an Orbitrap mass spectrometer via lock mass injection into a C-trap. Mol. Cell. Proteomics 2005, 4, 2010–2021. [DOI] [PubMed] [Google Scholar]
- Vizcaino J. A.; Cote R. G.; Csordas A.; Dianes J. A.; Fabregat A.; Foster J. M.; Griss J.; Alpi E.; Birim M.; Contell J.; O’Kelly G.; Schoenegger A.; Ovelleiro D.; Perez-Riverol Y.; Reisinger F.; Rios D.; Wang R.; Hermjakob H. The Proteomics Identifications (PRIDE) database and associated tools: status in 2013. Nucleic Acids Res. 2012, 41, D1063–D1069. [DOI] [PMC free article] [PubMed] [Google Scholar]
- Chambers M. C.; Maclean B.; Burke R.; Amode D.; Ruderman D. L.; Neumann S.; Gatto L.; Fischer B.; Pratt B.; Egertson J.; Hoff K.; Kessner D.; Tasman N.; Shulman N.; Frewen B.; Baker T. A.; Brusniak M.-Y.; Paulse C.; Creasy D.; Flashner L.; Kani K.; Moulding C.; Seymour S. L.; Nuwaysir L. M.; Lefebvre B.; Kuhlmann F.; Roark J.; Rainer P.; Detlev S.; Hemenway T.; Huhmer A.; Langridge J.; Connolly B.; Chadick T.; Holly K.; Eckels J.; Deutsch E. W.; Moritz R. L.; Katz J. E.; Agus D. B.; MacCoss M.; Tabb D. L.; Mallick P. A cross-platform toolkit for mass spectrometry and proteomics. Nat. Biotechnol. 2012, 30, 918–920. [DOI] [PMC free article] [PubMed] [Google Scholar]
- Craig R.; Beavis R. C. TANDEM: matching proteins with tandem mass spectra. Bioinformatics 2004, 20, 1466–1467. [DOI] [PubMed] [Google Scholar]
- Kim S.; Pevzner P. A. MS-GF+: Universal Database Search Tool for Mass Spectrometry. 8th Annual US HUPO Conference (US-HUPO), San Francisco, CA, March 2012. http://proteomics.ucsd.edu/Software/MSGFPlus.
- Kim S.; Mischerikow N.; Bandeira N.; Navarro J. D.; Wich L.; Mohammed S.; Heck A. J.; Pevzner P. A. The generating function of CID, ETD, and CID/ETD pairs of tandem mass spectra: applications to database search. Mol. Cell Proteomics 2010, 9, 2840–2852. [DOI] [PMC free article] [PubMed] [Google Scholar]
- Keller A.; Shteynberg D. Software pipeline and data analysis for MS/MS proteomics: the trans-proteomic pipeline. Methods Mol. Biol. 2011, 694, 169–189. [DOI] [PubMed] [Google Scholar]
- Johnson M.; Zaretskaya I.; Raytselis Y.; Merezhuk Y.; McGinnis S.; Madden T. L. NCBI BLAST: a better web interface. Nucleic Acids Res. 2008, 36, W5–9. [DOI] [PMC free article] [PubMed] [Google Scholar]
- Huang D. W.; Sherman B. T.; Lempicki R. A. Systematic and integrative analysis of large gene lists using DAVID bioinformatics resources. Nat. Protoc. 2009, 4, 44–57. [DOI] [PubMed] [Google Scholar]
- Lange P. F.; Huesgen P. F.; Overall C. M. TopFIND 2.0--linking protein termini with proteolytic processing and modifications altering protein function. Nucleic Acids Res. 2012, 40, D351–D361. [DOI] [PMC free article] [PubMed] [Google Scholar]
- McDonald L.; Robertson D. H. L.; Hurst J. L.; Beynon R. J. Positional proteomics: selective recovery and analysis of N-terminal proteolytic peptides. Nat. Methods 2005, 2, 955–957. [DOI] [PubMed] [Google Scholar]
- Gevaert K.; Van Damme P.; Ghesquière B.; Impens F.; Martens L.; Helsens K.; Vandekerckhove J. A la carte proteomics with an emphasis on gel-free techniques. Proteomics 2007, 7, 2698–2718. [DOI] [PubMed] [Google Scholar]
- Rogers L. D.; Overall C. M. Proteolytic Post-translational Modification of Proteins: Proteomic Tools and Methodology. Mol. Cell. Proteomics 2013, 12, 3532–3542. [DOI] [PMC free article] [PubMed] [Google Scholar]
- Plasman K.; Van Damme P.; Gevaert K. Contemporary positional proteomics strategies to study protein processing. Cell 2013, 17, 66–72. [DOI] [PubMed] [Google Scholar]
- Huesgen P. F.; Overall C. M. N- and C-terminal degradomics: new approaches to reveal biological roles for plant proteases from substrate identification. Physiol Plant 2012, 145, 5–17. [DOI] [PubMed] [Google Scholar]
- Huesgen P. F.; Lange P. F.; Overall C. M. Ensembles of protein termini and specific proteolytic signatures as candidate biomarkers of disease. Prot. Clin. Appl. 2014, 10.1002/prca.201300104A. [DOI] [PubMed] [Google Scholar]
- Auf dem Keller U.; Prudova A.; Gioia M.; Butler G. S.; Overall C. M. A statistics-based platform for quantitative N-terminome analysis and identification of protease cleavage products. Mol. Cell. Proteomics 2010, 9, 912–927. [DOI] [PMC free article] [PubMed] [Google Scholar]
- Risk B. A.; Edwards N. J.; Giddings M. C. A peptide-spectrum scoring system based on ion alignment, intensity, and pair probabilities. J. Proteome Res. 2013, 12, 4240–4247. [DOI] [PMC free article] [PubMed] [Google Scholar]
- Granholm V.; Kim S.; Navarro J. C. F.; Sjölund E.; Smith R. D.; Käll L.. Fast and Accurate Database Searches with MS-GF+Percolator. J. Proteome Res. 2013. [DOI] [PMC free article] [PubMed] [Google Scholar]
- Zola H.; Swart B.; Banham A.; Barry S.; Beare A.; Bensussan A.; Boumsell L.; D Buckley C.; Bühring H.-J.; Clark G.; Engel P.; Fox D.; Jin B.-Q.; Macardle P. J.; Malavasi F.; Mason D.; Stockinger H.; Yang X. CD molecules 2006 — Human cell differentiation molecules. J. Immunol. Methods 2007, 319, 1–5. [DOI] [PubMed] [Google Scholar]
- Bosman G. J. C. G. M.; Lasonder E.; Groenen-Döpp Y. A. M.; Willekens F. L. A.; Werre J. M.; Novotný V. M. J. Comparative proteomics of erythrocyte aging in vivo and in vitro. J. Proteomics 2010, 73, 396–402. [DOI] [PubMed] [Google Scholar]
- Marsee D. K.; Pinkus G. S.; Yu H. CD71 (Transferrin Receptor): An Effective Marker for Erythroid Precursors in Bone Marrow Biopsy Specimens. Am. J. Clin. Pathol. 2010, 134, 429–435. [DOI] [PubMed] [Google Scholar]
- Rieu S.; Géminard C.; Rabesandratana H.; Sainte-Marie J.; Vidal M. Exosomes released during reticulocyte maturation bind to fibronectin via integrin α4β1. Eur. J. Biochem. 2001, 267, 583–590. [DOI] [PubMed] [Google Scholar]
- Pollack S.; Campana T. Immature red cells have ferritin receptors. Biochem. Biophys. Res. Commun. 1981, 100, 1667–1672. [DOI] [PubMed] [Google Scholar]
- Beck M.; Schmidt A.; Malmstroem J.; Claassen M.; Ori A.; Szymborska A.; Herzog F.; Rinner O.; Ellenberg J.; Aebersold R. The quantitative proteome of a human cell line. Mol. Syst. Biol. 2011, 7, 549. [DOI] [PMC free article] [PubMed] [Google Scholar]
- Nagaraj N.; Wisniewski J. R.; Geiger T.; Cox J.; Kircher M.; Kelso J.; bo S. P. A. A.; Mann M. Deep proteome and transcriptome mapping of a human cancer cell line. Mol. Syst. Biol. 2011, 7, 548. [DOI] [PMC free article] [PubMed] [Google Scholar]
- Goodman S. R.; Daescu O.; Kakhniashvili D. G.; Zivanic M. The proteomics and interactomics of human erythrocytes. Exp. Biol. Med. 2013, 238, 509–518. [DOI] [PubMed] [Google Scholar]
- Burton N. M.; Bruce L. J. Modelling the structure of the red cell membrane. Biochem. Cell Biol. 2011, 89, 200–215. [DOI] [PubMed] [Google Scholar]
- Zennadi R.; Whalen E. J.; Soderblom E. J.; Alexander S. C.; Thompson J. W.; Dubois L. G.; Moseley M. A.; Telen M. J. Erythrocyte plasma membrane-bound ERK1/2 activation promotes ICAM-4-mediated sickle red cell adhesion to endothelium. Blood 2012, 119, 1217–1227. [DOI] [PMC free article] [PubMed] [Google Scholar]
- Lange P. F.; Overall C. M. TopFIND, a knowledgebase linking protein termini with function. Nat. Methods 2011, 8, 703–704. [DOI] [PubMed] [Google Scholar]
- Frottin F.; Martinez A.; Peynot P.; Mitra S.; Holz R. C.; Giglione C.; Meinnel T. The proteomics of N-terminal methionine cleavage. Mol. Cell. Proteomics 2006, 5, 2336–2349. [DOI] [PubMed] [Google Scholar]
- Auf dem Keller U.; Prudova A.; Eckhard U.; Fingleton B.; Overall C. M. Systems-level analysis of proteolytic events in increased vascular permeability and complement activation in skin inflammation. Sci. Signaling 2013, 6, rs2. [DOI] [PMC free article] [PubMed] [Google Scholar]
- Gonda D. K.; Bachmair A.; Wünning I.; Tobias J. W.; Lane W. S.; Varshavsky A. Universality and structure of the N-end rule. J. Biol. Chem. 1989, 264, 16700–16712. [PubMed] [Google Scholar]
- Piatkov K. I.; Brower C. S.; Varshavsky A. The N-end rule pathway counteracts cell death by destroying proapoptotic protein fragments. Proc. Natl. Acad. Sci. 2012, 109, E1839–47. [DOI] [PMC free article] [PubMed] [Google Scholar]
- Brower C. S.; Piatkov K. I.; Varshavsky A. Neurodegeneration-Associated Protein Fragments as Short-Lived Substrates of the N-End Rule Pathway. Mol. Cell 2013, 50, 161–171. [DOI] [PMC free article] [PubMed] [Google Scholar]
- Hwang C. S.; Shemorry A.; Varshavsky A. N-Terminal Acetylation of Cellular Proteins Creates Specific Degradation Signals. Science 2010, 327, 973–977. [DOI] [PMC free article] [PubMed] [Google Scholar]
- Breslow E.; Daniel R.; Ohba R.; Tate S. Inhibition of ubiquitin-dependent proteolysis by non-ubiquitinatable proteins. J. Biol. Chem. 1986, 261, 6530–6535. [PubMed] [Google Scholar]
- Bunn H. F.; Gabbay K. H.; Gallop P. M. The glycosylation of hemoglobin: relevance to diabetes mellitus. Science 1978, 200, 21–27. [DOI] [PubMed] [Google Scholar]
- Lion N.; Crettaz D.; Rubin O.; Tissot J.-D. Stored red blood cells: A changing universe waiting for its map(s). J. Proteomics 2010, 73, 374–385. [DOI] [PubMed] [Google Scholar]
- Perrotta S. The N-terminal 11 amino acids of human erythrocyte band 3 are critical for aldolase binding and protein phosphorylation: implications for band 3 function. Blood 2005, 106, 4359–4366. [DOI] [PubMed] [Google Scholar]
- Brunati A. M.; Bordin L.; Clari G.; James P.; Quadroni M.; Baritono E.; Pinna L. A.; Donella-Deana A. Sequential phosphorylation of protein band 3 by Syk and Lyn tyrosine kinases in intact human erythrocytes: identification of primary and secondary phosphorylation sites. Blood 2000, 96, 1550–1557. [PubMed] [Google Scholar]
- Mandal D. Caspase 3-mediated Proteolysis of the N-terminal Cytoplasmic Domain of the Human Erythroid Anion Exchanger 1 (Band 3). J. Biol. Chem. 2003, 278, 52551–52558. [DOI] [PubMed] [Google Scholar]
- Dix M. M.; Simon G. M.; Wang C.; Okerberg E.; Patricelli M. P.; Cravatt B. F. Functional Interplay between Caspase Cleavage and Phosphorylation Sculpts the Apoptotic Proteome. Cell 2012, 150, 426–440. [DOI] [PMC free article] [PubMed] [Google Scholar]
- Ciana A.; Minetti G.; Balduini C. Phosphotyrosine phosphatases acting on band 3 in human erythrocytes of different age: PTP1B processing during cell ageing. Bioelectrochemistry 2004, 62, 169–173. [DOI] [PubMed] [Google Scholar]
- Kriebardis A. G.; Antonelou M. H.; Stamoulis K. E.; Economou-Petersen E.; Margaritis L. H.; Papassideri I. S. Storage-dependent remodeling of the red blood cell membrane is associated with increased immunoglobulin-G binding, lipid raft rearrangement, and caspase activation. Transfusion 2007, 47, 1212–1220. [DOI] [PubMed] [Google Scholar]
- Sluchanko N. N.; Gusev N. B. Oligomeric structure of 14-3-3 protein: What do we know about monomers?. FEBS Lett. 2012, 586, 4249–4256. [DOI] [PubMed] [Google Scholar]
- Yang X.; Lee W. H.; Sobott F.; Papagrigoriou E.; Robinson C. V.; Grossmann J. G.; Sundstrom M.; Doyle D. A.; Elkins J. M. Structural basis for protein-protein interactions in the 14-3-3 protein family. Proc. Natl. Acad. Sci. 2006, 103, 17237–17242. [DOI] [PMC free article] [PubMed] [Google Scholar]
- Han D.; Ye G.; Liu T.; Chen C.; Yang X.; Wan B.; Pan Y.; Yu L. Functional identification of a novel 14-3-3 epsilon splicing variant suggests dimerization is not necessary for 14-3-3 epsilon to inhibit UV-induced apoptosis. Biochem. Biophys. Res. Commun. 2010, 396, 401–406. [DOI] [PubMed] [Google Scholar]
Associated Data
This section collects any data citations, data availability statements, or supplementary materials included in this article.