

Abstract
Two genome duplications early in the vertebrate lineage expanded gene families including GluN2 subunits of the NMDA receptor. Diversification between the four mammalian GluN2 proteins occurred primarily at their intracellular C-terminal domains (CTDs). To identify shared ancestral functions and diversified subunit-specific functions, we exchanged the exons encoding the GluN2A (also known as Grin2a) and GluN2B (also known as Grin2b) CTDs in two knock-in mice and analyzed the mice’s biochemistry, synaptic physiology, and multiple learned and innate behaviors. The eight behaviors were genetically separated into four groups, including one group comprising three types of learning linked to conserved GluN2A/B regions. In contrast, the remaining five behaviors exhibited subunit-specific regulation. GluN2A/B CTD diversification conferred differential binding to cytoplasmic MAGUK proteins and differential forms of long-term potentiation. These data indicate that vertebrate behavior and synaptic signaling acquired increased complexity from the duplication and diversification of ancestral GluN2 genes.
Introduction
Understanding the mechanisms underlying the many forms of vertebrate behavior is a central objective of neuroscience and, although studied extensively at the cellular and circuit level1–2, very little is known about the underlying molecular evolutionary events. How did genome evolution give rise to the many forms of learning, emotional behavior, or motor functions and generate the subtlety of synaptic regulation that is manifest in the mammalian brain? Although basic adaptive behaviors and underlying physiological mechanisms are conserved between invertebrates and vertebrates3–5, it is generally accepted that vertebrates have evolved greater behavioral repertoires and more complex nervous systems6–8. Prior to the origins of mammals, two whole genome duplication events occurred in the vertebrate lineage (550 million years ago) resulting in four paralogs of each gene, many of which have been retained to the present day9–10. Genome duplication provided substantial opportunities for early vertebrate evolution, as redundant copies of existing genes are a substrate from which novel gene functions can evolve by mutation11. The possibility that these genomic mechanisms have helped to shape the vertebrate behavioral repertoire has been inferred12–14 but functional evidence of gene evolution in vertebrate behavior is sparse.
The striking evolutionary history of the ionotropic N-methyl-D-aspartate receptor (NMDAR)15,16 and its role in behavioral adaptations to environmental change including learning17 and anxiety18 make this receptor an ideal model for examining the importance of genome and protein evolution in shaping vertebrate behavior and plasticity. NMDARs are heterotetramers composed of GluN1 and regulatory GluN2 subunits organized into three regions: an N-terminal extracellular ligand-binding domain, a transmembrane spanning region forming the pore, and a large cytoplasmic CTD that binds intracellular proteins19. Two rounds of gene duplication in a vertebrate common ancestor produced four GluN2 paralogs (GluN2A–D), which have diverged during early vertebrate evolution primarily at their CTDs15 (Fig. 1a). The first round of duplication gave rise to two GluN2 genes (the GluN2A/B and GluN2C/D ancestors) and the second duplication gave rise to the 4 extant paralogs (Fig. 1a). We focused our investigation on GluN2A and GluN2B genes as they share a common ancestry, are highly expressed in the adult forebrain20, and underlie diverse behavioral functions in mammals21–33.
Figure 1.

Design and generation of mouse models a phylogeny illustrating the invertebrate GluN2 and four vertebrate GluN2 paralogs (GluN2A, GluN2B, GluN2C and GluN2D). (a) Two pairs of vertebrate GluN2 genes can be identified, reflecting their evolutionary origins in the two rounds of whole genome duplication (1R, 2R) at the base of the chordate lineage ~550 million years ago (Mya). Yellow box highlights the four vertebrate GluN2 proteins. (b) Schematic depicting the homology (common origin) of the GluN2A and GluN2B subunit. The ancestral subunit to GluN2A and GluN2B was duplicated during the 2R event, creating two GluN2 paralogs that diversified into GluN2A and GluN2B. The cytoplasmic CTDs are the most divergent regions of the GluN2A and GluN2B proteins (Supplementary Fig. 1). CTD regions unique to GluN2A and GluN2B are colored blue and green, respectively. CTD regions that are homologous (common) between GluN2A and GluN2B are colored red (29% of the GluN2A/B CTD amino acid sequences). For brevity, divergent regions of the GluN2A/B extracellular and transmembrane regions are not marked. The engineered GluN2A2B(CTR) and GluN2B2A(CTR) chimeric subunits are depicted beside the respective endogenous murine GluN2 subunits. (c) The GluN2A2B(CTR) allele encodes a chimeric GluN2A subunit consisting of GluN2A extracellular and transmembrane regions and the GluN2B CTD. The terminal GluN2A exon that encodes the CTD was replaced with the paralogous sequence from GluN2B (target 1). The FRT-flanked Neo selection cassette was placed in the GluN2A 3′ UTR and was removed by crossing GluN2A2B(CTR)/+ mice with CAG-FLP recombinase transgenic mice (target 2). (d) The GluN2B2A(CTR) allele encodes a chimeric GluN2B subunit consisting of a GluN2B extracellular and transmembrane regions and the GluN2A CTD. The terminal GluN2B exon that encodes the CTD was replaced with the paralogous sequence from GluN2A (target 1). The loxP-flanked Neo selection cassette was placed in the GluN2B 3′ UTR and was removed by crossing GluN2B2A(CTR)/+ mice with CMV-Cre recombinase transgenic mice (target 2). (e) Western blots of whole forebrain extracted protein, probing for the GluN2A N-terminal domain and CTD, and the GluN2B CTD. No change in apparent protein levels was seen for the GluN2A N-terminal domain in GluN2A2B(CTR)/2B(CTR) mice. No GluN2A CTD signal was detected in GluN2A2B(CTR)/2B(CTR) brain. Probing for the GluN2B CTD revealed an apparent increase in signal in GluN2A2B(CTR)/2B(CTR) mice and a trend toward increased GluN2B CTD signal (normalized to GluN2A N-terminal domain signal) (t4 = 2.9, P > 0.05). (f) Western blots of whole forebrain extracted protein, probing for the GluN2B N-terminal domain and CTD, and the GluN2A CTD. No change in protein levels was seen for the GluN2B N-terminal domain in GluN2B2A(CTR)/2A(CTR) protein extract. No GluN2B CTD signal was detected in GluN2B2A(CTR)/2A(CTR) brain extract. Probing for the GluN2A CTD revealed a significant increase in signal for the GluN2A CTD (normalized to GluN2B N-terminal domain signal) in GluN2B2A(CTR)/2A(CTR) protein extract (t4 = 6.2, P < 0.01).
Results
The extent of the GluN2A/B CTD divergence is illustrated by the alignment of the CTDs of GluN2A and GluN2B subunits, which reveals multiple regions of conservation and divergence in mice (Supplementary Fig. 1), with 60% and 89% amino acid sequence identity at the extracellular and transmembrane domains, respectively, but only 29% identify at their CTDs15. This suggests that, in addition to any conserved (ancestral) functions, each subunit could have substantially diversified subunit-specific functions.
In vitro studies have identified common and unique protein interaction motifs and phosphorylation sites in mammalian GluN2A and GluN2B CTDs34, but cannot attribute distinct in vivo functions to them. GluN2A and GluN2B knockout mice or mutant mice that express subunits lacking the CTDs can be used to identify in vivo functions for both subunits, but cannot be used to distinguish common functions mediated by amino acid sequences conserved between GluN2A and GluN2B from unique functions mediated by amino acid sequences specific to either GluN2A or GluN2B. Moreover, whole gene mutations cannot distinguish functional divergence arising from evolution in the protein sequence from divergence arising in non-coding regulatory sequences.
Swapping the CTD of GluN2A and GluN2B in the mouse genome
Previously, we hypothesized that GluN2A/B CTD protein diversification shaped the regulation of NMDAR-dependent vertebrate behaviors through the evolution of specific GluN2A and GluN2B protein functions15,16. Testing the GluN2 CTD diversification hypothesis requires subtle genome engineering, such as that pioneered in the study of homeobox gene evolution35, in which the protein coding region of interest from one gene is removed and replaced by that of its paralog, without affecting the regulatory regions or other protein coding regions of the gene (Fig. 1b). We adopted this strategy and, using homologous recombination in embryonic stem cells, deleted the single exon in GluN2A that encodes its CTD, replacing it with the corresponding CTD-encoding exon of GluN2B. We performed the same exon exchange on the GluN2B gene, replacing its CTD-encoding exon with that of GluN2A. We refer to these mutant alleles as the GluN2A2B(CTR) and GluN2B2A(CTR) alleles (CTR indicates C-terminal domain replacement; Fig. 1c, d). In both cases, the endogenous regulatory elements, and N-terminal and transmembrane domain coding sequences were undisturbed. These mutant mice were then analyzed in a range of behavioral, electrophysiological and biochemical assays involving NMDAR, and comparisons of their phenotypes (and those of the CTD deletion mice GluN2AΔC and GluN2BΔC) allowed us to identify functions that arise from protein evolution in the CTD. Although standard knockout and knock-in CTD deletion mice have been used to show that the GluN2 CTD is important23,36, it is not known whether its functions result from protein sequence that is conserved between paralogs (ancestral to the gene duplication) or protein sequence that is unique to each subunit (diversified after duplication). Our knock-in domain swap strategy circumvents this limitation, effectively removing the unique amino acid sequence from each subunit, but leaving the conserved sequence intact.
Initial breeding experiments revealed the power of this approach. GluN2B−/− and GluN2BΔC/ΔC mutations are lethal at postnatal day 1 (refs. 23,36,37), whereas GluN2A−/− and GluN2AΔC/ΔC are viable21,23, indicated that the GluN2B CTD is crucial for viability. We found that substitution of the GluN2B CTD with the GluN2A CTD in GluN2B2A(CTR)/2A(CTR) mutants resulted in viable adult mice, suggesting that GluN2B’s role in viability is mediated by the ancestral amino acid sequences common to GluN2A and GluN2B. Similarly, GluN2B−/− and GluN2BΔC/ΔC mutants have abnormal whisker pattern development in the brainstem36–37, whereas the barrel field in the somatosensory cortex of GluN2B2A(CTR)/2A(CTR) mutants showed no obvious anatomical abnormalities (P. Kind, personal communication).
This domain swap strategy can be extended to any phenotype (single or multiple) controlled by the NMDAR and, given that we examined both the GluN2A and GluN2B genes, we were able to determine whether a particular phenotype is regulated by the same CTD when inserted into both or only one of the two GluN2 loci. For example, it could be that, for a given behavioral phenotype, the two CTDs are completely interchangeable in the GluN2A locus, but not in the GluN2B locus, indicating that CTD divergence during vertebrate evolution affected that behavior through the emergence of new functions at the GluN2B, but not the GluN2A, locus. The GluN2A2B(CTR) and GluN2B2A(CTR) mice are particularly useful when compared with the GluN2AΔC and GluN2BΔC CTD deletion mutants23, as it is possible to discriminate between loss-of-function and potential gain-of-function phenotypes resulting from the GluN2A2B(CTR) and GluN2B2A(CTR) mutants (see Supplementary Fig. 2).
Before characterizing the behavioral roles of GluN2A and GluN2B, we asked whether the levels of protein expression and synaptic physiology were affected in the GluN2A2B(CTR) and GluN2B2A(CTR) mice. Immunoblots of total lysates of forebrains probed with antibodies to the N terminus revealed that GluN2A levels were the same in wild-type and GluN2A2B(CTR) mice (Fig. 1e) and GluN2B levels were the same in wild-type and GluN2B2A(CTR) mice (Fig. 1f). In CA3-CA1 synapses of acutely prepared hippocampal slices, NMDAR:AMPA receptor ratios and NMDAR excitatory postsynaptic current (EPSC) decay times were unaltered between wild-type and mutant mice (Fig. 2). Synaptic transmission (Supplementary Fig. 3) and paired-pulse facilitation (Supplementary Fig. 4) were also normal in all of the mutant lines. These results indicate that there was no overt difference in the levels of expression of the chimeric receptors or in basal synaptic transmission, and suggest that the divergence in CTDs has not affected the ability of GluN2A and GluN2B to localize at synapses or mediate basic electrophysiological properties.
Figure 2.

NMDAR channel physiology. NMDAR-mediated EPSCs were measured in GluN2A2B(CTR)/2B(CTR), GluN2B2A(CTR)/2A(CTR) and GluN2B+/ΔC mice, and in associated wild-type controls. Bar charts show NMDAR/AMPA receptor (AMPAR) ratios for evoked EPSCs recorded at postsynaptic holding potentials of −80 mV or +40 mV and the time constants of the decay of EPSCs evoked at +40 mV. Traces show examples of evoked EPSCs at both holding potentials. GluN2AΔC/ΔC data were published previously42. (a) Results from GluN2A2B(CTR)/2B(CTR) cells (n = 12, N = 3) compared with GluN2A+/+ cells (n = 13, N = 3). (b) Results from GluN2B2A(CTR)/2A(CTR) cells (n = 24, N = 5) compared with GluN2B+/+ cells (n = 28, N = 5). (c) Results from GluN2B+/ΔC cells (n = 21, N = 4) compared with GluN2B+/+ cells (n = 17, N = 5). n represents the number of slices that we used and N represents the number of mice. Error bars represent s.e.m.
Genetic dissection of multiple behaviors
GluN2A and GluN2B are both necessary for normal performance in a wide range of behavioral procedures spanning cognitive, emotional and motor function21–33. However, the specific roles of subunit-specific CTDs in these behaviors remain unknown. We used several behavioral tests encompassing multiple forms of learning, emotional and motor behaviors to examine the GluN2A2B(CTR) and GluN2B2A(CTR) mutant phenotypes. Specifically, we employed a visual discrimination task, using the touchscreen operant conditioning system38, to probe perceptual and reversal learning39 (Fig. 3a–d, Supplementary Fig. 5 and Supplementary Tables 1 and 2), contextual fear conditioning to test a form of associative learning that is dependent on the hippocampus (Fig. 3e–h), the accelerating rotarod task to test motor coordination and learning (Fig. 3i–l), the elevated plus maze task to test anxiety (time spent in open arms; Fig. 4a–d and Supplementary Table 3), and the open field task to test motor activity (total distance traveled; Fig. 4e–h and Supplementary Table 4) and impulsivity (latency to first enter the inner zone; Fig. 4i–l and Supplementary Table 4). These behavioral assays measure eight key phenotypes, all of which require functionally intact versions of each of the GluN2A and GluN2B subunits, as we observed using GluN2AΔC and GluN2BΔC mice (Figs. 3 and 4 and Supplementary Tables 3 and 4) or in studies28,31–33 that used other mutant mouse models. We rely on published studies of GluN2B conditional homozygous knockout mutants to establish that GluN2B is necessary for a behavior when we do not see a phenotype for that behavior with GluN2B heterozygous null mutants.
Figure 3.

Learning behavior. (a–d) Perceptual learning and reversal learning in GluN2A2B(CTR)/2B(CTR) and GluN2B2A(CTR)/2A(CTR) mice, as measured by performance in visual discrimination and subsequent reversal learning (percentage correct trials across 15 bins of 30 reversal trials) in a touchscreen operant conditioning task. **P < 0.01. (a) The total number of trials required to reach acquisition criterion was the same for GluN2A2B(CTR)/2B(CTR) mice (n = 9) and GluN2A+/+ controls (n = 11) (t18 = −1.75, p = 0.1). (b) We saw no significant interaction of bin and genotype (F1,13.9 = 153.3, P = 0.1) and no significant main effect (F1,18 = 0.2, p > 0.8) between GluN2A2B(CTR)/2B(CTR) mice and controls. (c) GluN2B2A(CTR)/2A(CTR) mice (n = 8) required significantly more trials to reach criterion than GluN2B+/+ controls (n = 10) (t16 = −3.12, P < 0.01). (d) We saw no significant interaction of bin and genotype (F1,8,2 = 0.68, P > 0.4) and no significant main effect (F1,13 = 1.69, P > 0.2) between GluN2B2A(CTR)/2A(CTR) mice and controls. (e–h) Associative learning in GluN2A2B(CTR)/2B(CTR), GluN2B2A(CTR)/2A(CTR), GluN2AΔC/ΔC and GluN2B+/ΔC mice, as measured by performance in a contextual fear conditioning task. Left, freezing over a 150-s period before unconditioned stimulus presentation (shock) on training day, and for 180 s on testing 24 h after training. Right, freezing over 300 s of testing. There were no significant effects in baseline freezing on training days for any mutant (data not shown). *P < 0.05. (e) GluN2A2B(CTR)/2B(CTR) mice (n = 21) showed equivalent freezing to GluN2A+/+ controls (n = 22) (t41 = 0.43, P = 0.1). (f) GluN2B2A(CTR)/2A(CTR) mice (n = 21) showed equivalent freezing to GluN2B+/+ controls (n = 19) (t38 = 1.7, P > 0.1). (g) GluN2AΔC/ΔC mice (n = 11) showed significantly less freezing than GluN2A+/+ controls (n = 19) (t28 = 2.2, P < 0.05). (h) GluN2BΔC/+ mice (n = 15) showed equivalent freezing to GluN2B+/+ controls (n = 10) (t23 = 0.14, P > 0.8). (i–l) Motor learning and coordination of GluN2A2B(CTR)/2B(CTR), GluN2B2A(CTR)/2A(CTR), GluN2AΔC/ΔC and GluN2B+/ΔC mice, as measured by performance in the accelerated rotarod. Performance was measured as average latency to fall (s) over eight morning trials (1–8) and eight afternoon trials (9–16). Motor learning deficits were determined by significant interactions of trial and genotype for each session. (i) We found no difference in motor coordination between GluN2A2B(CTR)/2B(CTR) mice (n = 20) and GluN2A+/+ controls (n = 21) (F1,39 = 0.01, P > 0.9), but did find a significant interaction of trial and genotype for the first session (trials 1–8) (F7,273 = 2.1, P < 0.05)—although this was due to enhanced performance on initial trials—but not in the second session (trials 9–16) (F5.4,208.7 = 1.5, P > 0.1). (j) GluN2B2A(CTR)/2A(CTR) mice (n = 21) showed impaired motor coordination relative to GluN2B+/+ controls (n = 19) (F1,38 = 5.1, P < 0.05), but an equivalent rate of improvement across both the first (F4.5,171.5 = 0.65, P > 0.6) and second (F7,266 = 0.4, P > 0.9) sessions. (k) GluN2AΔC/ΔC mice (n = 11) showed impaired motor coordination relative to GluN2A+/+ controls (n = 19) (F1,28 = 20.1, P < 0.0001) and showed reduced motor learning for the first session (F7,196 = 2.1, P < 0.05), but not for the second session (F4.6,130 = 0.7, P > 0.5). (l) GluN2B+/ΔC mice (n = 15) showed impaired motor coordination relative to GluN2B+/+ controls (n = 10) (F1,23 = 6.8, P < 0.02) and a nonsignificant trend toward impaired motor learning over both the first (F7,161 = 1.5, P > 0.1) and second (F3.5,80.2 = 1.6, P > 0.1) sessions. All data are mean±s.e.m.
Figure 4.

Emotion/motivation and motor behavior. (a) GluN2A2B(CTR)/2B(CTR) mice (n = 21) showed normal anxiety behavior relative to GluN2A+/+ controls (n = 22) (t41 = −1.49, P > 0.1). (b) GluN2B2A(CTR)/2A(CTR) mice (n = 21) showed significantly less anxiety than GluN2B+/+ controls (n = 19) (U = 70.5, P < 0.001). (c) GluN2AΔC/ΔC mice (n = 11) showed significantly less anxiety than GluN2A+/+ controls (n = 19) (U = 44.5, P = 0.01). (d) GluN2B+/ΔC mice (n = 15) showed normal anxiety relative to GluN2B+/+ controls (n = 10) (t23 = 0.5, P > 0.6). (e–h) Motor activity measured as total distance travelled (cm) in the open field over a 5-min period. (e) GluN2A2B(CTR)/2B(CTR) mice (n = 13) showed significantly more motor activity than GluN2A+/+ controls (n = 14) (t25 = −2.5, P < 0.05). (f) GluN2B2A(CTR)/2A(CTR) mice (n = 21) showed normal motor activity relative to GluN2B+/+ controls (n = 19) (t29.9 = 0.18, P > 0.8). (g) GluN2AΔC/ΔC mice (n = 11) showed significantly more motor activity than GluN2A+/+ controls (n = 19) (t28 = −3, P < 0.01). (h) GluN2B+/ÄC mice (n = 15) showed significantly more motor activity than GluN2B+/+ controls (n = 10) (t23 = −3.5, P < 0.005). (i–l) Impulsivity measured as latency to first enter the inner zone of the open field (s). (i) GluN2A2B(CTR)/2B(CTR) mice (n = 13) showed significantly more impulsivity than GluN2A+/+ controls (n = 14) (U = 41, P < 0.05). (j) GluN2B2A(CTR)/2A(CTR) mice (n = 21) showed significantly more impulsivity than GluN2B+/+ controls (n = 19) (U = 95, P < 0.005). (k) GluN2AÄC/ÄC mice (n = 11) showed significantly more impulsivity than GluN2A+/+ controls (n = 19) (t28 = 2.4, P < 0.05). (l) GluN2B+/ÄC mice (n = 15) showed normal impulsivity relative to GluN2B+/+ controls (n = 10) (t23 = 1.4, P > 0.1). *P < 0.05. All data are mean±s.e.m.
We grouped our results into three broad a priori categories: learning, emotion and motivation, and motor functions (Fig. 5). Phenotypes were observed for each of the behaviors, suggesting that the GluN2A/B CTDs are involved in all of them. As observed in the GluN2AΔC and GluN2BΔC deletion mutants, both the GluN2A and GluN2B subunits contribute to each of these behaviors, but, for the reasons noted above, this does not allow one to conclude that the contribution that they each make is a result of their unique CTD protein sequence. This issue was resolved by the GluN2A2B(CTR) and GluN2B2A(CTR) mutants. Six of the eight deletion phenotypes were substituted by the CTD from GluN2B (Fig. 5). This indicates that, for these six phenotypes, the functional contribution made by the GluN2A CTD results from protein sequence that is also present in the CTD of GluN2B. The failure of this experiment to substitute the other two phenotypes (impulsivity and locomotor activity) shows a functional dissociation of the CTDs, accounted for by divergence in protein sequence. This evidence of conservation and divergence of CTD function is even more notable when one examines the GluN2B gene. Of the eight tested behaviors, four showed marked phenotypes in the GluN2B2A(CTR) mice and four phenotypes were substituted. These data provide evidence for both divergence and conservation of behavioral roles of the CTD of GluN2A and GluN2B.
Figure 5.
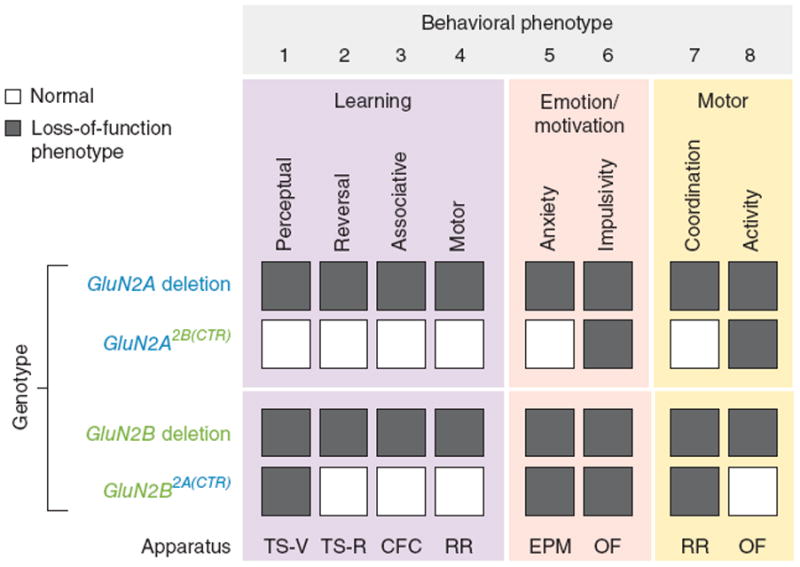
Summary of behavioral phenotypes caused by GluN2 CTD deletion and swap mutations. Summary of behavioral phenotypes resulting from GluN2 CTD deletion and swap mutations. Shown are GluN2 mutant phenotypes in eight behavioral measures deduced from six experimental procedures. The NMDAR-dependent behavioral repertoire investigated was grouped into three boxes encompassing learning behavior (purple), emotion and motivation (beige), and motor behavior (orange). Four forms of learning behavior were assayed: perceptual, reversal, associative and motor. Anxiety and impulsivity measures were used to study emotional and motivational function. Motor coordination and motor activity were used to study basic motor function. The behavioral assays that we employed included touchscreen-based visual discrimination (TS-V), touchscreen-based reversal learning (TS-R), contextual fear conditioning (CFC), accelerating rotarod (RR), elevated plus maze (EPM) and open field (OF). Shaded boxes denote loss-of-function mutant phenotypes for a given measure and white boxes denote normal behavior in mutants. All eight behavioral phenotypes that we considered required both GluN2A and GluN2B. Genetic disruption of either GluN2A or GluN2B resulted in impairments in all eight of the behavioral measures. The GluN2A2B(CTR)/2B(CTR) mice showed loss-of-function phenotypes only for impulsivity and activity. The GluN2B2A(CTR)/2A(CTR) mice showed loss-of-function phenotypes for perceptual learning, anxiety, impulsivity and motor coordination.
Because we have measured eight behavioral phenotypes with these mutant mice, we can group the data and learn about the geneticunderpinnings of each behavior and how they may relate to each other. We defined four possible categories of behavioral phenotype: two-way substitution behaviors (those in which one CTD can replace the other in both genes; that is, A can substitute for B and vice versa), two classes of one-way substitution behaviors (those in which the CTD of one gene can replace the CTD of the other gene, but not vice versa; that is, A can replace B but B cannot replace A, or B can replace A but A cannot replace B) and no-way substitution behaviors (those in which the other CTD cannot replace the function for either subunit). Individual behaviors fell into each of these four categories (Fig. 6). The two-way substitution category (representing those behaviors that are necessarily regulated by ancestral sequences that are conserved in both CTDs) included three of the eight behaviors: reversal learning, associative learning and motor learning. The other five behaviors were subject to regulation resulting from divergence between the two CTDs during early vertebrate evolution. Locomotor activity was the only behavior that fell into the A to B substitution group, and therefore requires CTD regions unique to GluN2A. Three behaviors fell into the B to A substitution group: perceptual learning, anxiety and motor coordination, therefore requiring CTD regions unique to GluN2B. Impulsivity was the only behavior that we studied that was subject to the most divergent regulation, requiring CTD regions unique to both GluN2A and GluN2B. It is worth noting that impulsivity did not fall into the same cluster as reversal learning, indicating a dissociation that is consistent with the view that reversal learning impairments can reflect compulsive, rather than impulsive, behavior40. These data indicate that the GluN2A and GluN2B CTDs are multifunctional domains regulating multiple behavioral functions, some of which are conserved and others of which are divergent between these two vertebrate paralogs.
Figure 6.
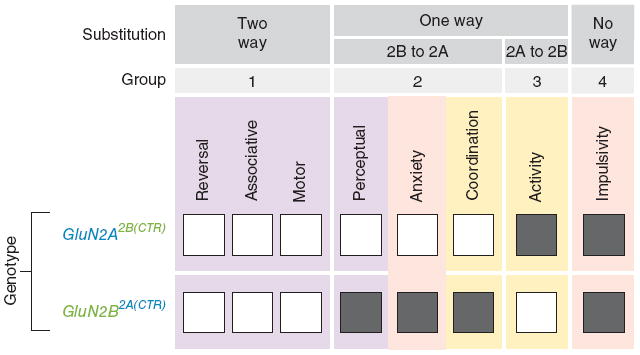
Evolutionary grouping of behavioral phenotypes. We grouped mutant phenotypes found in GluN2A2B(CTR)/2B(CTR) and GluN2B2A(CTR)/2A(CTR) mice according to the observed substitution grouping. If a behavioral phenotype was normal in both GluN2A2B(CTR)/2B(CTR) and GluN2B2A(CTR)/2A(CTR) mice, then it required only ancestral (conserved) regions of GluN2A/B CTDs and was classified as a two-way substitution (group 1). If a behavioral phenotype was altered in only one of the two chimeric mutants, then it was classified as a one-way substitution. 2B to 2A one-way substitutions are phenotypes that required CTD regions unique to GluN2B, but not GluN2A (group 2). 2A to 2B one-way substitutions are phenotypes that required CTD regions unique to GluN2A, but not GluN2B (group 3). If a behavioral phenotype was altered in both the GluN2A2B(CTR)/2B(CTR) and GluN2B2A(CTR)/2A(CTR) mice, then it required CTD regions unique to both GluN2A and GluN2B and was classified as a no-way substitution (group 4).
Differential regulation of synaptic signaling
Our behavioral data revealed that different forms of learning, all of which were NMDAR dependent, could be regulated by genetically separable functions of the CTDs of GluN2A and GluN2B. To explore the possibility that the CTDs also contribute to the regulation of different forms of synaptic plasticity, we tested long-term potentiation (LTP) in the acute hippocampal slice preparation. Consistent with previous findings23,41,42, the CTD of GluN2A was required for generation of LTP in GluN2AΔC/ΔC mice (Fig. 7a). We also found that the CTD of GluN2B was important for LTP, as potentiation was reduced in slices from heterozygous GluN2BΔC deletion mutant mice (Fig. 7b). In contrast, using the same stimulation protocol, we found that LTP was normal in GluN2A2B(CTR)/2B(CTR) mice (Fig. 7c) and enhanced in GluN2B2A(CTR)/2A(CTR) mice (Fig. 7d). This prompted us to use another stimulation protocol (theta pulse stimulation, TPS). Again, LTP was normal in GluN2A2B(CTR)/2B(CTR) mice (Fig. 7e), but was reduced in GluN2B2A(CTR)/2A(CTR) mice (Fig. 7f). These results indicate that the CTD of GluN2B has diversified from the GluN2A CTD to provide selective functions for detecting and discriminating the patterns of neuronal activity that induce different forms of LTP. In addition, CA3-CA1 long-term depression was unaffected in both GluN2A2B(CTR)/2B(CTR) and GluN2B2A(CTR)/2A(CTR) mice (data not shown).
Figure 7.

Synaptic plasticity. Example fEPSPs recorded during baseline and 65 minutes after LTP induction in wild type (top) and mutant mice (bottom) are shown to the right in a–d. Calibration bars are 3 msec and 1 mV. Test, test pathway; con, control pathway. (a) Theta-burst induced LTP was significantly impaired (F(1,30) = 33.14, P < 0.0001) in GluN2AΔC/ΔC mice (129.9 ± 3.4%; n = 18, N = 5) compared to GluN2A+/+ mice (167.0 ± 4.5%; n = 25, N = 8). (b) Heterozygous truncation of the GluN2B CTR led to a significant decrease in theta-burst induced LTP (F(1,37) = 26.66, P < 0.0001) in GluN2B+/ΔC mice (148.9 ± 4.5%; n = 32, N = 10) compared to GluN2B+/+ mice (183.6 ± 5.6%; n = 21, N = 6). (c) Theta-burst induced LTP was intact in mice where the endogenous CTD of GluN2A protein was replaced with the CTD from GluN2B (F(1,39) = 1.60, P > 0.2). (d) Replacement of the endogenous CTD of GluN2B protein with the CTD from GluN2A led to a small but significant up-regulation of theta-burst induced LTP (F(1,39) = 6.67, P = 0.01) in GluN2B2A(CTR)/2A(CTR) (183.8 ± 4%; n = 34, N = 10) compared to GluN2B+/+ mice (169.6 ± 4.3%; n = 24, N = 9). (e) Theta pulse stimulation (TPS, 5 Hz/30 sec)-induced LTP was normal in GluN2A2B(CTR)/2B(CTR) mice t(9) = 0.041, P > 0.9). 45 minutes post-TPS fEPSPs were potentiated to (182 ± 6.4%; n = 12, N = 6) of baseline in slices from GluN2A2B(CTR)/2B(CTR) mice compared (182 ± 16%; n = 9, N = 5) of baseline in slices from GluN2A+/+ mice. (f) TPS-induced LTP was reduced in GluN2B2A(CTR)/2A(CTR) mutants t(12) = 6.76, P < 0.001. fEPSPs were potentiated to (135 ± 3.9%; n = 17, N = 7) of baseline in slices from GluN2B2A(CTR)/2A(CTR) mice compared to (172 ± 3.9%; n = 13, N = 7) of baseline in slices from GluN2B+/+ mice. Calibration bars in e and f represent 4 msec and 2 mV. (g) Normal levels of the MAGUK proteins were found in the input GluN2A2B(CTR)/2B(CTR) mice (PSD-95: t4 = 1.04; P > 0.3; PSD-93: t4 = 0.21; P > 0.8). Significant increases in PSD-95 (t3 = 13.1; P < 0.001) and PSD-93 (t4 = 4.1; P < 0.05) association were pulled down with the GluN2A2B(CTR) chimeric receptors. No significant difference in GluN2B protein was observed in the GluN2A2B(CTR)/2B(CTR) pull-downs (t4 = −0.3; P = 0.8). (h) Normal levels of the MAGUK proteins were found in the input of GluN2B2A(CTR)/2A(CTR) mice (PSD-95: t4 = −0.83, P > 0.4; PSD-93: t4 = −0.02, P > 0.9). Significantly reduced quantities of each of the two NMDAR-binding MAGUKs were pulled down with the GluN2B2A(CTR) chimeric receptor (PSD-95: t4 = −6.7, P < 0.01; PSD-93: t4 = −3.26, P < 0.05). No significant difference in GluN2B protein was observed in the GluN2B2A(CTR)/2A(CTR) pull-downs (t4 = −0.05, P > 0.9). n represents the number of slices that we used and N represents the number of mice.
Differential functions of the CTDs may reflect their differential association with intracellular signaling proteins. Of particular interest are the MAGUK (membrane-associated guanylate kinase) family proteins, which are important for the assembly of signaling complexes with NMDAR43 and modulate many forms of synaptic plasticity44,45. In vitro experiments have shown that GluN2A and GluN2B both interact with PSD-95 via their conserved terminal residues (-ESDV)46, but the relative interactions between GluN2A, GluN2B and MAGUK in vivo remain unclear. We immunoprecipitated NMDAR complexes from GluN2A2B(CTR)/2B(CTR) and GluN2B2A(CTR)/2A(CTR) mouse forebrains, and examined the association of PSD-95 and PSD-93 by western blotting (Fig. 7). The composition of the complexes was markedly altered in the mutant mice: the amount of co-immunoprecipitated PSD-95 and PSD-93 was increased in GluN2A2B(CTR)/2B(CTR) mice and decreased in GluN2B2A(CTR)/2A(CTR) mice. This indicates that the CTD of GluN2B preferentially interacts with these MAGUK proteins in the mouse brain, which suggests that GluN2 subunit-specific protein complexes may exist.
Discussion
Using an approach designed to experimentally test the role of gene evolution in shaping vertebrate behavior, we analyzed vertebrate GluN2A and GluN2B CTD function in vivo. We found that evolution in the sequence of a single exon encoding the cytoplasmic domain of a neurotransmitter receptor has contributed to the regulation of vertebrate behavior and synaptic signaling. We used an extensive battery of behavioral tests, together with two GluN2A alleles and two GluN2B alleles, to identify for the first time, to the best of our knowledge, unique behavioral and plasticity functions of the GluN2A and GluN2B subunits and to separate the pleiotropic roles of the CTDs of these subunits. Our strategy also allowed us to identify four groups of behaviors, each with distinct regulation arising from gene evolution (Supplementary Fig. 6). The GluN2A and GluN2B CTDs were able to substitute for each other in the regulation of reversal learning, associative learning and motor learning, indicating that their roles in these forms of learning have been conserved from before the genome duplication event that occurred ~550 million years ago. In contrast, we identified unique functions of the GluN2A CTD (regulation of locomotor activity and impulsivity) and the GluN2B CTD (regulation of perceptual learning, anxiety, impulsivity and motor coordination), which must have arisen as a result of protein diversification after the duplication event.
Our analysis of multiple behaviors revealed that the overall vertebrate repertoire was shaped partly as a result of the duplication and diversification of a single protein domain. This suggests that the adaptive value of gene evolution in behavior lies in the changes to the overall repertoire and not in any single phenotype. Notably, the only behavior that was regulated by diversification in both GluN2A and GluN2B was impulsivity. Moreover, anxiety and motor activity required a unique amino acid sequence from either the GluN2A or GluN2B CTD. This leads us to infer that the protein sequences controlling emotional and motivational behavior were less constrained by natural selection than those sequences that regulate learning behaviors, as three of the four learning behaviors that we studied did not require an amino acid sequence unique to either GluN2A or GluN2B. Thus, greater regulation of emotional and motivational behavior may have conferred an adaptive advantage on early vertebrates. Further research will be required to test whether the behavioral phenotypes differentially regulated by the GluN2A and GluN2B CTDs co-evolved as a group of linked behavioral functions or arose and evolved independently.
The learning, emotional and motor behaviors that we studied are fundamental animal behaviors that can be observed in simple forms even in invertebrate species. Our genetic dissection approach revealed that, during vertebrate evolution, these behaviors acquired distinct forms of regulation, with the overall result of increasing the complexity of vertebrate behavior. In principle, this complexity may have allowed vertebrates to adapt to a more complex range of environments and contingencies.
Our results are consistent with and extend the conclusions of a companion study in which mutations in the family of MAGUK proteins were studied in mice and humans47. The results of both studies show that differential regulation of simple and complex behaviors arose in two families of postsynaptic signaling proteins that were expanded by genome duplication and paralog diversification. Moreover, the GluN2 proteins directly interact with the MAGUK proteins, and we found that there was specificity between the pairs of GluN2 and MAGUK interactions in vivo, establishing the fact that paralog diversification led to differential organization and diversity of postsynaptic signaling complexes. Given that human genetic variants of GluN2A and GluN2B have recently been associated with mental retardation, epilepsy and autism48–50, the specific GluN2A/B protein functions that we identified should be useful for investigating the etiology of these diseases.
METHODS
Sequence analysis
Dotplots were generated using the Dotmatcher program in the EMBOSS package51. Sequence alignments were generated using ClustalW52.
Gene targeting
The exonic sequence coding for the C-terminal domains (CTDs) of the GluN2A and GlunN2B subunits were swapped into the reciprocal genomic loci, in separate knockin mouse lines, without altering the genomic structure of either the GluN2A or GluN2B genes. This was enabled by the fact that almost the entirety of the GluN2A and GluN2B cytoplasmic domains are encoded by the terminal exons of the GluN2A and GluN2B genes, respectively. The initial amino acid sequence encoded by the GluN2A and GluN2B terminal exons are identical (starting with the exonic DNA sequence coding for the “GIYSCI…” amino acid motif see Fig. 1), facilitating the engineering of functional chimeric proteins.
GluN2A-2B(CTR)
The GluN2A-2B(CTR) 5′ homology arm was retrieved by gap repair from a BAC containing the mouse GluN2A gene (bMQ-173G2, acquired from the Wellcome Trust Sanger Institute Core Facilities). The 5′ and 3′ mini homology arms (mini-HA’s), each 0.5 Kb were amplified by PCR from the BAC using primers GCGGCCGCATTTCTGTGTGACATTGTGG and GGAAATTCATGCAGGCTTGAGTTTAAACGCCAGCTGAGTCTCAATCAA for the 5′ min-HA, and TTGATTGAGACTCAGCTGGCGTTTAAACTCAAGCCTGCATGAATTTCC and GGTACCTCGTGGGGTGAACAGAACATTTG for the 3′ mini-HA. The two mini homology arms were then joined by PCR assembly using primers GCGGCCGCATTTCTGTGTGACATTGTGG and GGTACCTCGTGGGGTGAACAGAACATTTG and used in a retrieval plasmid to recombine the desired homology arms from Redα, redβ and redγ containing EL350 cells transformed with the BAC. The 3′ homology arm was amplified by PCR from mouse 129/OlaHsd genomic DNA using primers TTAATTAAGCATGCGATCTTCCATCAGTGTTTATC and CTCGAGGTCCCTTTCTCCAAGAACC. The GluN2B C-terminal exon was amplified by PCR from 129/OlaHsd mouse genomic DNA using primers GTATACACGGAGTAGCTATAGAGGAGCG and GTTTAAACTCAGACATCAGACTCAATACTAGAAA, and inserted into AscI and PacI engineered to lie between the homology arms and the 3′ exon. The positive selection marker used was a neomycin phosphotransferase gene (Neo) driven by a compound phosphoglycerate kinase (PGK) and EM7 promoter, flanked by FRT sites.
GluN2B-2A(CTR)
The GluN2B-2A(CTR) homology arms were constructed from a mouse genomic DNA library (acquired from Rolf Sprengel and Peter Seeburg, Heidelberg). The GluN2A C-terminal exon was amplified by PCR from 129/OlaHsd mouse genomic DNA using primers GCCTAGCAGCTGCATCCATGGAGTGCACATTG and GCGATTGCTAGCTCAGACATCAGACTCAATAC and inserted into PvuII and NheI sites engineered to lie between the homology arms and the 3′ exon. The positive selection marker used was a neomycin phosphotransferase gene (Neo) driven by a compound phosphoglycerate kinase (PGK) and EM7 promoter, flanked by loxP sites.
Embryonic Stem Cell Targeting
The targeting vectors were used to target the GluN2A or GluN2B loci in 129/OlaHsd mouse embryonic stem (ES) cells, originating from the 129P2 mouse strain using standard methods. ES cell colonies were screened by long-range PCR. GluN2A2B(CTR) targeted colonies were screened using primers AGAATTCCTGCAGCCCGGGGGATC and TTCGTCTGAAGCAGCCCCAAGATC, which anneal to the Neo cassette and a region of the 3′UTR that lies beyond the 3′ terminus of the GluN2B-2A(CTR) targeting vector. Potential GluN2B2A(CTR) targeted colonies were screened using primers ACGAGATCAGCAGCCTCTGTTCCAC and GAGGCGGGGCGACCAGGAAGGC, which anneal to the Neo cassette and a region of the 3′UTR that lies beyond the 3′ terminus of the GluN2A-2B(CTR) targeting vector. Blastocyst injection of targeted clones was performed as described in53. F1 progeny were back-crossed onto C57Bl/6J mice to establish working colonies.
Genotyping
GluN2 CTD deletion mutants were genotyped as previously described23. The GluN2A2B(CTR) allele was genotyped using primers TTGAGATATGGAAACAAATGTTCTG and CTTCTTTTCTTCAATGTGCACTCC, which anneal to the GluN2A intron 11–12, and GluN2B exon 12, respectively. The GluN2A+ allele was genotyped using primers CCACACGTACGGGGATGACCA and TGG TGGATTGATCTTCATGGAATTTGG, which anneal to exon 12 of GluN2A, and the GluN2A 3′ UTR, respectively. The GluN2B2A(CTR) allele was genotyped using primers CCACACGTACGGGGATGACCA and CTCCTCTCCAGCCTCCCACACT, which anneal to exon 12 of GluN2A, and the GluN2B 3′ UTR, respectively. The GluN2B+ allele was genotyped using primers TCAGTGCTTGCTTCACGGCAGC and CTCCTCTCCAGCCTCCCACACT, which anneal to exon 12 of GluN2B, and the GluN2B 3′ UTR, respectively. For both GluN2 CTD swap mutations, homozygotes were identified based on the presence of the mutant allele and the absence of the wild type allele.
Western blotting and immunoprecipitation
Standard procedures were used for protein extraction, SDS-PAGE, and Western blotting54. The following primary antibodies were used for western blotting: GluN2A (N-terminus) Serotec AHP1880 (1:1,000), GluN2B (N-terminus) Invitrogen 71-8600 (1:500), GluN2A (C-terminus) BD Biosciences 612286 (1:1,000), GluN2B (C-terminus) BD Biosciences 610416 (1:1,000), PSD-95 BD Biosciences 610495 (1:1,000), PSD-93 Neuromab 73-057 (1:5,000). Immobilon Western HRP Substrate (Millipore) was used to activate chemiluminescence. Membranes were exposed using a Kodak image station 4000M with Kodak Molecular Imaging Software. Images were processed using Kodak Molecular Imaging Software Version 4.0. ROIs (regions of interest) were manually selected. For each gel, data points for wild type and mutant samples were paired by spatial arrangement on a gel and compared in a pairwise fashion to minimize the impact of subtle background artifacts on image analysis. The log10 transformation of mean intensity values was calculated. The t-statistic and the P-value were calculated for the log10 ratios across all wild type-mutant pairs. In the case of immunoprecipitation experiments, all probed proteins were normalized to quantities of the precipitated proteins. A P-value significance cut-off of 0.05 was used. Co-immunoprecipitation experiments were carried out using magnetic Dynabeads® Protein G (Invitrogen). Antibody capture was done using 1–5 μg of the precipitating antibody with 500ug protein extract in 500 μl. 50 μl Dynabeads were used per –immunoprecipitation according to manufacturer’s instructions.
Electrophysiology
Whole cell and extracellular recordings were performed as described elsewhere42 and done in accordance with the UCLA Institutional Animal Care and Use Committee and the United Kingdom Home Office guidelines.
At the start of each theta-pulse LTP experiment the amplitude of the maximal fEPSP that could be evoked in each slices was first determined and the intensity of presynaptic fiber stimulation was adjusted to evoke fEPSPs with amplitude approximately 50% of the maximal fEPSP amplitude. Theta pulse stimulation (TPS) induced LTP was examined using trains of single pulses of presynaptic fiber stimulation delivered at 5 Hz. The average fEPSP slope measured between 40 and 45 minutes post-TPS or post-LFS (in the case of LTD) was used for statistical comparisons (two tailed t-tests, n = number of animals in each group).
Slice preparation procedures for MEA experiments have been previously described55. To assess changes in basal synaptic transmission, input-output relationships were initially compared by mixed model repeated-measures ANOVA and Bonferroni post hoc test implemented in Prism 5 (GraphPad Software, Inc., San Diego, CA) using individual slice data as independent observations. Since several slices were routinely recorded from every mouse, fEPSPmax, PPF and LTP values between wild type and mutant mice were then compared using two-way nested ANOVA design with genotype (group) and mice (sub-group) as fixed effects. Fisher’s F-statistic was calculated as Mean of SquaresGenotype/Mean of SquaresResidual and genotype effect was considered significant if two conditions were met: a) corresponding probability for the group F-Statistic was below 0.05 and b) sub-group effects were non-significant. Graph plots, normalization and unpaired Student’s t-test analysis were performed using OriginPro 7.5 (OriginLab, Northampton, MA, U.S.A.). Throughout the text, data are presented as mean ± standard error of the mean, with n and N indicating number of slices and mice respectively.
Behavioral experiments
Behavioral experiments were conducted in accordance with United Kingdom Home Office guidelines. For each experiment, two separate cohorts containing both wild type and mutant mice of both sexes were used. Separate cohorts of male mice were used for all touchscreen operant conditioning experiment. The experimenter was blind to genotype for all behavioral experiments.
Open field exploration
Mice were run individually in the open field for 5 min and recorded with digital video cameras (Tracksys, Nottingham U.K.). The apparatus consisted of a white Perspex arena with matt finish, 75 cm square, with 42 cm high walls (Tracksys, Nottingham U.K.). Each mouse was placed at a corner of the open field and allowed to explore the arena for the duration of the trial.
Elevated plus maze
Mice were run concurrently in pairs (the second mouse initiating 20 – 30 s after the first) on two separate elevated plus mazes with IR lighting underneath (Tracksys, Nottingham U.K.) for 5 min in the dark, while being digitally video recorded by Mediacruise (2.24.000) software, and data collected by Ethovision software (Noldus, NL).
Rotarod
Mice were run concurrently in individually contained rotorod apparatuses (EZ-ROD with the spindle bar set to 35 cm high [outer dimensions: 17 ″ (L) × 5.5″ (W) × 20.0 ″(H)] (Accusan Instruments, Columbus, OH). All mice were run through 2 sessions, the first in the morning and the second in the afternoon of the same day, with 3 hours minimum between the two sessions. Each session consisted of 8 consecutive trials. Inter-trial interval was kept at a maximum of 30 s. Each trial began with the rotarod rotating at 10 rpm and accelerating through the trial to a maximum speed of 48 rpm at 300 s.
Contextual fear conditioning
On day of training, individual mice were run in parallel, in one of four fear conditioning boxes. An unconditioned stimulus (electrical shock) was paired with two conditioned stimuli: firstly the context of the training box, and secondly an auditory cue. A tone was used as the auditory cue and was calibrated to be between 83 and 86 dB, and was a 300 Hz continuous tone. The tone was played three times, for 30 s each time, starting at 120 s, 220 s and 320 s into the trial. For the last 2 s of each tone, a 0.45 mA shock was applied to the electrified grid floor (Start times 148, 248 and 348 s). The total duration of the training trial is 420 s. One day post-training (approximately 20–22 hours later), each mouse was individually returned to the training box for 180s. The freezing behavior of the mouse was recorded using Acctimetrics Software systems: FreezeFrame Control and Data Acquisition, and FreezeView Data Analysis software (Coulbourn Instruments).
Touchscreen-based operant system
Experiments were conducted according to28. The apparatus consisted of an infrared touchscreen (Craft Data Ltd., Bucks, U.K.) and a standard modular testing chamber housed within a sound-attenuating box. Nose-pokes to the stimuli were detected by the touchscreen and recorded by the MouseCat software. Mice were food deprived and maintained at 85% of their free-feeding body weight at all times
Visual discrimination
Following all stages pre-training28, each mouse was presented with two novel visual stimuli in the two windows of the screen (Supplementary Figure 5). A response to one of the two stimuli (the S+) resulted in a single food pellet reward, and a response at the other stimulus (the S−) resulted in a 5 s (house) lights out punishment (as for touching the blank screen during the third pre-training phase). The stimuli remained on the screen until a response was made. The ‘fan’ symbol was designated as S+, and the ‘marbles’ symbol as S−. Left–right presentation of the S+ was pseudo-randomized. There were 30 trials given per session and a 5 s ITI. Each session had a maximum time of 1 hour. On reaching a criterion of 80 % correct trials (excluding correction trials) on two consecutive sessions, a given mouse immediately progressed to reversal learning on the following day.
Reversal learning
For reversal learning, the reinforcement contingencies were reversed There were 30 trials per reversal session. Each animal was run for 20 sessions of reversal regardless of their performance.
2nd Visual Discrimination
During the second, more difficult visual discrimination, mice were presented with the novel visual stimuli shown in Supplementary Figure 5. All other parameters were identical to the first visual discrimination, except an acquisition criterion of 70% correct trails (excluding correction trials) on each of two consecutive sessions was applied.
Behavioral statistical analysis
All behavioral data was analyzed using the Statistics Package for Social Scientists (SPSS) software package, version 13.03.2. Graphs were prepared using GraphPad Prism 4. Throughout the study independent samples t-tests were carried out with genotype as the between subjects factor. In all cases the normality of the data was first tested by the Shapiro-Wilk test. In cases where the data was normally distributed, the P value for the t-test was reported. In all such cases Levene’s Test for Equality of Variances was observed. In cases where the data was not normally distributed, the non-parametric Mann-Whitney U test was applied. Repeated measures analysis of variance (ANOVA) was used to assess latency to fall over repeated trials in the rotarod. In all cases the between subject factor was genotype and the appropriate within subjects factor was used (trial/bin/session). When reporting within subjects effects by repeated measures ANOVA, Mauchly’s Test of Sphericity was observed. Data are presented as mean ± or standard error of the mean (s.e.m.). A critical value for significance of P < 0.05 was used throughout the study.
Supplementary Material
Acknowledgments
We thank D. Fricker and E. Tuck for technical support, M. Price for animal care, K. Elsegood for management of the GluN2AΔC and GluN2BΔC mouse colonies, and D. Maizels for artwork. We thank P. Seeburg for providing the GluN2AΔC and GluN2BΔC mouse lines, and P. Kind (University of Edinburgh) for sharing unpublished data. We are grateful to A. Bayés, G. Hardingham, T. Kitamura, A. McLysaght, R. Redondo, J. Sarinana, and D. Wyllie for critical reading of early manuscript drafts, and R. Frank, I. Greger, D. Stemple, A. Bari, L. van de Lagemaat, S. Manakov, and J. Symonds for many useful discussions. This project was supported by the Wellcome Trust, Genes to Cognition Program, The Medical Research Council and EU programs (Project GENCODYS No. 241995, Project EUROSPIN No. 242498 Project SYNSYS No. 242167 and Project PharMEA No. SME-2008-1-232554). T.J.R. was supported by a Wellcome Trust PhD Studentship for the majority of this project.
Footnotes
AUTHOR CONTRIBUTIONS
T.J.R., S.G.N.G, and N.H.K. conceived and designed research; T.J.R., M.V.K.., T.I., J.N., N.O.A., C.P., T.J.O., and N.H.K. performed research; T.J.R, M.V.K., L.E.S., R.S., L.M.S., T.J.B, T.J.O., and N.H.K. contributed new reagents/analytic tools; T.J.R., M.V.K., T.I., J.N., and T.J.O. analyzed data; and T.J.R., S.G.N.G, and N.H.K. wrote the manuscript.
References
- 1.Kandel ER. The molecular biology of memory storage: a dialogue between genes and synapses. Science. 2001;294:1030–1038. doi: 10.1126/science.1067020. [DOI] [PubMed] [Google Scholar]
- 2.LeDoux JE. Synaptic Self: How Our Brains Become Who We Are. Viking Press; 2002. [Google Scholar]
- 3.Margulies C, Tully T, Dubnau J. Deconstructing memory in Drosophila. Curr Biol. 2005;15:R700–713. doi: 10.1016/j.cub.2005.08.024. [DOI] [PMC free article] [PubMed] [Google Scholar]
- 4.Xia S, et al. NMDA receptors mediate olfactory learning and memory in Drosophila. Curr Biol. 2005;15:603–615. doi: 10.1016/j.cub.2005.02.059. [DOI] [PMC free article] [PubMed] [Google Scholar]
- 5.Glanzman DL. Common mechanisms of synaptic plasticity in vertebrates and invertebrates. Curr Biol. 2010;20:R31–36. doi: 10.1016/j.cub.2009.10.023. [DOI] [PMC free article] [PubMed] [Google Scholar]
- 6.Moore BR. The evolution of learning. Biol Rev Camb Philos Soc. 2004;79:301–335. doi: 10.1017/s1464793103006225. [DOI] [PubMed] [Google Scholar]
- 7.Emes RD, et al. Evolutionary expansion and anatomical specialization of synapse proteome complexity. Nat Neurosci. 2008;11:799–806. doi: 10.1038/nn.2135. [DOI] [PMC free article] [PubMed] [Google Scholar]
- 8.LeDoux J. Rethinking the emotional brain. Neuron. 2012;73:653–676. doi: 10.1016/j.neuron.2012.02.004. [DOI] [PMC free article] [PubMed] [Google Scholar]
- 9.Ohno S. Evolution by Gene Duplication. George Allen and Unwin; 1970. [Google Scholar]
- 10.McLysaght A, Hokamp K, Wolfe KH. Extensive genomic duplication during early chordate evolution. Nat Genet. 2002;31:200–204. doi: 10.1038/ng884. [DOI] [PubMed] [Google Scholar]
- 11.Prince VE, Pickett FB. Splitting pairs: the diverging fates of duplicated genes. Nat Rev Genet. 2002;3:827–837. doi: 10.1038/nrg928. [DOI] [PubMed] [Google Scholar]
- 12.Keller MJ, Gerhardt HC. Polyploidy alters advertisement call structure in gray treefrogs. Proc Biol Sci. 2001;268:341–345. doi: 10.1098/rspb.2000.1391. [DOI] [PMC free article] [PubMed] [Google Scholar]
- 13.Okubo K, Nagahama Y. Structural and functional evolution of gonadotropin-releasing hormone in vertebrates. Acta Physiol (Oxf) 2008;193:3–15. doi: 10.1111/j.1748-1716.2008.01832.x. [DOI] [PubMed] [Google Scholar]
- 14.Ito H, Ishikawa Y, Yoshimoto M, Yamamoto N. Diversity of brain morphology in teleosts: brain and ecological niche. Brain Behav Evol. 2007;69:76–86. doi: 10.1159/000095196. [DOI] [PubMed] [Google Scholar]
- 15.Ryan TJ, Emes RD, Grant SG, Komiyama NH. Evolution of NMDA receptor cytoplasmic interaction domains: implications for organisation of synaptic signalling complexes. BMC Neurosci. 2008;9:6. doi: 10.1186/1471-2202-9-6. [DOI] [PMC free article] [PubMed] [Google Scholar]
- 16.Ryan TJ, Grant SG. The origin and evolution of synapses. Nat Rev Neurosci. 2009;10:701–712. doi: 10.1038/nrn2717. [DOI] [PubMed] [Google Scholar]
- 17.Nakazawa K, McHugh TJ, Wilson MA, Tonegawa S. NMDA receptors, place cells and hippocampal spatial memory. Nat Rev Neurosci. 2004;5:361–372. doi: 10.1038/nrn1385. [DOI] [PubMed] [Google Scholar]
- 18.Barkus C, et al. Hippocampal NMDA receptors and anxiety: at the interface between cognition and emotion. Eur J Pharmacol. 2010;626:49–56. doi: 10.1016/j.ejphar.2009.10.014. [DOI] [PMC free article] [PubMed] [Google Scholar]
- 19.Paoletti P. Molecular basis of NMDA receptor functional diversity. Eur J Neurosci. 2011 doi: 10.1111/j.1460-9568.2011.07628.x. [DOI] [PubMed] [Google Scholar]
- 20.Monyer H, Burnashev N, Laurie DJ, Sakmann B, Seeburg PH. Developmental and regional expression in the rat brain and functional properties of four NMDA receptors. Neuron. 1994;12:529–540. doi: 10.1016/0896-6273(94)90210-0. [DOI] [PubMed] [Google Scholar]
- 21.Sakimura K, et al. Reduced hippocampal LTP and spatial learning in mice lacking NMDA receptor epsilon 1 subunit. Nature. 1995;373:151–155. doi: 10.1038/373151a0. [DOI] [PubMed] [Google Scholar]
- 22.Kishimoto Y, et al. Conditioned eyeblink response is impaired in mutant mice lacking NMDA receptor subunit NR2A. Neuroreport. 1997;8:3717–3721. doi: 10.1097/00001756-199712010-00012. [DOI] [PubMed] [Google Scholar]
- 23.Sprengel R, et al. Importance of the intracellular domain of NR2 subunits for NMDA receptor function in vivo. Cell. 1998;92:279–289. doi: 10.1016/s0092-8674(00)80921-6. [DOI] [PubMed] [Google Scholar]
- 24.Kiyama Y, et al. Increased thresholds for long-term potentiation and contextual learning in mice lacking the NMDA-type glutamate receptor epsilon1 subunit. J Neurosci. 1998;18:6704–6712. doi: 10.1523/JNEUROSCI.18-17-06704.1998. [DOI] [PMC free article] [PubMed] [Google Scholar]
- 25.Boyce-Rustay JM, Holmes A. Ethanol-related behaviors in mice lacking the NMDA receptor NR2A subunit. Psychopharmacology (Berl) 2006;187:455–466. doi: 10.1007/s00213-006-0448-6. [DOI] [PubMed] [Google Scholar]
- 26.Nakazawa T, et al. NR2B tyrosine phosphorylation modulates fear learning as well as amygdaloid synaptic plasticity. Embo J. 2006;25:2867–2877. doi: 10.1038/sj.emboj.7601156. [DOI] [PMC free article] [PubMed] [Google Scholar]
- 27.Boyce-Rustay JM, Holmes A. Genetic inactivation of the NMDA receptor NR2A subunit has anxiolytic- and antidepressant-like effects in mice. Neuropsychopharmacology. 2006;31:2405–2414. doi: 10.1038/sj.npp.1301039. [DOI] [PubMed] [Google Scholar]
- 28.Brigman JL, et al. Impaired discrimination learning in mice lacking the NMDA receptor NR2A subunit. Learn Mem. 2008;15:50–54. doi: 10.1101/lm.777308. [DOI] [PMC free article] [PubMed] [Google Scholar]
- 29.Jiao J, et al. Expression of NR2B in cerebellar granule cells specifically facilitates effect of motor training on motor learning. PLoS One. 2008;3:e1684. doi: 10.1371/journal.pone.0001684. [DOI] [PMC free article] [PubMed] [Google Scholar]
- 30.Bannerman DM, et al. NMDA receptor subunit NR2A is required for rapidly acquired spatial working memory but not incremental spatial reference memory. J Neurosci. 2008;28:3623–3630. doi: 10.1523/JNEUROSCI.3639-07.2008. [DOI] [PMC free article] [PubMed] [Google Scholar]
- 31.von Engelhardt J, et al. Contribution of hippocampal and extra-hippocampal NR2B-containing NMDA receptors to performance on spatial learning tasks. Neuron. 2008;60:846–860. doi: 10.1016/j.neuron.2008.09.039. [DOI] [PubMed] [Google Scholar]
- 32.Brigman JL, et al. Loss of GluN2B-containing NMDA receptors in CA1 hippocampus and cortex impairs long-term depression, reduces dendritic spine density, and disrupts learning. J Neurosci. 2010;30:4590–4600. doi: 10.1523/JNEUROSCI.0640-10.2010. [DOI] [PMC free article] [PubMed] [Google Scholar]
- 33.Brigman JL, Powell EM, Mittleman G, Young JW. Examining the genetic and neural components of cognitive flexibility using mice. Physiol Behav. 2012 doi: 10.1016/j.physbeh.2011.12.024. [DOI] [PMC free article] [PubMed] [Google Scholar]
- 34.Chen BS, Roche KW. Regulation of NMDA receptors by phosphorylation. Neuropharmacology. 2007;53:362–368. doi: 10.1016/j.neuropharm.2007.05.018. [DOI] [PMC free article] [PubMed] [Google Scholar]
- 35.Greer JM, Puetz J, Thomas KR, Capecchi MR. Maintenance of functional equivalence during paralogous Hox gene evolution. Nature. 2000;403:661–665. doi: 10.1038/35001077. [DOI] [PubMed] [Google Scholar]
- 36.Mori H, et al. Role of the carboxy-terminal region of the GluR epsilon2 subunit in synaptic localization of the NMDA receptor channel. Neuron. 1998;21:571–580. doi: 10.1016/s0896-6273(00)80567-x. [DOI] [PubMed] [Google Scholar]
- 37.Kutsuwada T, et al. Impairment of suckling response, trigeminal neuronal pattern formation, and hippocampal LTD in NMDA receptor epsilon 2 subunit mutant mice. Neuron. 1996;16:333–344. doi: 10.1016/s0896-6273(00)80051-3. [DOI] [PubMed] [Google Scholar]
- 38.Bussey TJ, et al. New translational assays for preclinical modelling of cognition in schizophrenia: The touchscreen testing method for mice and rats. Neuropharmacology. 2011 doi: 10.1016/j.neuropharm.2011.04.011. [DOI] [PMC free article] [PubMed] [Google Scholar]
- 39.Morton AJ, Skillings E, Bussey TJ, Saksida LM. Measuring cognitive deficits in disabled mice using an automated interactive touchscreen system. Nat Methods. 2006;3:767. doi: 10.1038/nmeth1006-767. [DOI] [PubMed] [Google Scholar]
- 40.Fineberg NA, et al. Probing compulsive and impulsive behaviors, from animal models to endophenotypes: a narrative review. Neuropsychopharmacology. 2010;35:591–604. doi: 10.1038/npp.2009.185. [DOI] [PMC free article] [PubMed] [Google Scholar]
- 41.Kohr G, et al. Intracellular domains of NMDA receptor subtypes are determinants for long-term potentiation induction. J Neurosci. 2003;23:10791–10799. doi: 10.1523/JNEUROSCI.23-34-10791.2003. [DOI] [PMC free article] [PubMed] [Google Scholar]
- 42.Moody TD, et al. Beta-adrenergic receptor activation rescues theta frequency stimulation-induced LTP deficits in mice expressing C-terminally truncated NMDA receptor GluN2A subunits. Learn Mem. 2011;18:118–127. doi: 10.1101/lm.2045311. [DOI] [PMC free article] [PubMed] [Google Scholar]
- 43.Husi H, Ward MA, Choudhary JS, Blackstock WP, Grant SG. Proteomic analysis of NMDA receptor-adhesion protein signaling complexes. Nat Neurosci. 2000;3:661–669. doi: 10.1038/76615. [DOI] [PubMed] [Google Scholar]
- 44.Migaud M, et al. Enhanced long-term potentiation and impaired learning in mice with mutant postsynaptic density-95 protein. Nature. 1998;396:433–439. doi: 10.1038/24790. [DOI] [PubMed] [Google Scholar]
- 45.Carlisle HJ, Fink AE, Grant SG, O’Dell TJ. Opposing effects of PSD-93 and PSD-95 on long-term potentiation and spike timing-dependent plasticity. J Physiol. 2008;586:5885–5900. doi: 10.1113/jphysiol.2008.163469. [DOI] [PMC free article] [PubMed] [Google Scholar]
- 46.Cousins SL, Papadakis M, Rutter AR, Stephenson FA. Differential interaction of NMDA receptor subtypes with the post-synaptic density-95 family of membrane associated guanylate kinase proteins. J Neurochem. 2008;104:903–913. doi: 10.1111/j.1471-4159.2007.05067.x. [DOI] [PubMed] [Google Scholar]
- 47.Nithianantharajah J, Komiyama NH, McKechanie A, Johnstone M, Blackwood D, St Clair D, Emes D, van de Lagemaat L, Saksida LM, Bussey TJ, Grant SG. Synaptic scaffold evolution generated components of vertebrate cognitive complexity. Nature Neuroscience. 2013 doi: 10.1038/nn.3276. [DOI] [PMC free article] [PubMed] [Google Scholar]
- 48.Endele S, et al. Mutations in GRIN2A and GRIN2B encoding regulatory subunits of NMDA receptors cause variable neurodevelopmental phenotypes. Nat Genet. 2010;42:1021–1026. doi: 10.1038/ng.677. [DOI] [PubMed] [Google Scholar]
- 49.O’Roak BJ, et al. Sporadic autism exomes reveal a highly interconnected protein network of de novo mutations. Nature. 2012 doi: 10.1038/nature10989. [DOI] [PMC free article] [PubMed] [Google Scholar]
- 50.Talkowski ME, et al. Sequencing Chromosomal Abnormalities Reveals Neurodevelopmental Loci that Confer Risk across Diagnostic Boundaries. Cell. 2012;149:525–537. doi: 10.1016/j.cell.2012.03.028. [DOI] [PMC free article] [PubMed] [Google Scholar]
- 51.Rice P, Longden I, Bleasby A. EMBOSS: the European Molecular Biology Open Software Suite. Trends Genet. 2000;16:276–277. doi: 10.1016/s0168-9525(00)02024-2. [DOI] [PubMed] [Google Scholar]
- 52.Larkin MA, et al. Clustal W and Clustal X version 2.0. Bioinformatics. 2007;23:2947–2948. doi: 10.1093/bioinformatics/btm404. [DOI] [PubMed] [Google Scholar]
- 53.Ramirez-Solis R, Davis AC, Bradley A. Gene targeting in embryonic stem cells. Methods Enzymol. 1993;225:855–878. doi: 10.1016/0076-6879(93)25054-6. [DOI] [PubMed] [Google Scholar]
- 54.Komiyama NH, et al. SynGAP regulates ERK/MAPK signaling, synaptic plasticity, and learning in the complex with postsynaptic density 95 and NMDA receptor. J Neurosci. 2002;22:9721–9732. doi: 10.1523/JNEUROSCI.22-22-09721.2002. [DOI] [PMC free article] [PubMed] [Google Scholar]
- 55.Kopanitsa MV, Afinowi NO, Grant SG. Recording long-term potentiation of synaptic transmission by three-dimensional multi-electrode arrays. BMC Neurosci. 2006;7:61. doi: 10.1186/1471-2202-7-61. [DOI] [PMC free article] [PubMed] [Google Scholar]
Associated Data
This section collects any data citations, data availability statements, or supplementary materials included in this article.