

Abstract
Objective
To examine the relationship between varying degrees of maternal hyperglycemia and pregnancy outcomes.
Methods
This was a secondary analysis of a treatment trial for mild gestational diabetes (GDM) including four cohorts: 1) 473 women with untreated mild GDM; 2) 256 women with a positive 50-gram screen and one abnormal oral glucose tolerance test (OGTT) value; 3) 675 women with a positive screen and no abnormal OGTT values; and 4) 437 women with a normal 50-gram screen. Groups were compared by test of trend for a composite perinatal outcome (neonatal hypoglycemia, hyperbilirubinemia, elevated cord c-peptide level, and perinatal trauma or death), frequency of large-for-gestational-age (LGA) infant, shoulder dystocia, and pregnancy-related hypertension. Three-hour OGTT levels (fasting, 1, 2, and 3 hour) levels were divided into categories and analyzed for their relationship to perinatal and maternal outcomes.
Results
There were significant trends by glycemic status among the four cohorts for the composite and all other outcomes (p<0.001). Analysis for trend according to OGTT categories showed an increasing relationship between fasting and all post load levels and the various outcomes (p<0.05). Fasting glucose ≥ 90 mg/dl and 1 hour ≥ 165 mg/dl were associated with an increased risk for the composite outcome, odds ratios and 95% CI of 2.0 (1.03-4.15) and 1.46 (1.02-2.11) to 1.52 (1.08-2.15), for the fasting and 1 hour, respectively. A 1 hour glucose ≥ 150 mg/dl was associated with an increased risk for LGA (odds ratios 1.8 (1.02-3.18) to 2.35 (1.35-4.14), however 2 and 3 hour glucose levels did not increase the risk for the composite or LGA until well beyond current GDM diagnostic thresholds.
Conclusion
A monotonic relationship exists between increasing maternal glycemia and perinatal morbidity. Current OGTT criteria require re-evaluation in determining thresholds for the diagnosis and treatment of GDM.
Gestational diabetes mellitus (GDM) represents a health care burden which can be expected to rise as the frequency of obesity increases worldwide.1 The lack of uniform criteria for diagnosis and the reliance on observational data drawing on historic controls has limited the accurate determination of the relationship between mild degrees of hyperglycemia and perinatal outcomes.2 The recent HAPO study confirmed that a strong continuous relationship exists between maternal glucose concentrations and increasing birthweight, cord blood serum c-peptide levels and other markers of perinatal complications.3 However, inconsistent results have been reported with respect to post glucose load levels and the risk for outcomes such as macrosomia.4 Using patients enrolled in a blinded trial of treatment for mild gestational diabetes, we sought to examine the relationship between varying degrees of maternal glycemia and pregnancy outcomes.
Methods
This study is a secondary analysis of the MFMU Network randomized clinical trial for the treatment of mild GDM.5 The study group consists of 1841 women enrolled between 24 weeks 0 days and 30 weeks 6 days of gestation. For this analysis, three groups are considered, consisting of: (1) 473 women in the untreated arm of the randomized trial with mild GDM defined as a fasting glucose less than 95 mg/dl with two or more post 100 gram glucose load measurements meetings or exceeding established cut-offs6; (2) an observational cohort of 931 women matched one to one to the randomized patients with respect to clinical center, raceor ethnicity, and body mass index (BMI) classified as <27 kg/m2 or ≥27kg/m2, with an elevated 50 gram screen (≥135 mg/dl) but normal oral glucose tolerance test (OGTT) results (for some analyses, this group is further divided into those with one abnormal value versus (n=256) those with no abnormal OGTT values n=675)); and, (3) an observational cohort of 437 women matched one to one to the untreated group with respect to clinical center, race or ethnicity, and body mass index (BMI) classified as <27 kg/m2 or ≥27kg/m2, with a screening value less than 120 mg/dl, and thus unlikely to have GDM. A three-hour OGTT was not performed for this group. In order to analyze for trend between glycemia and outcomes for patients who underwent an OGTT test, five categories were created according to 5 mg increments for the fasting values and in 15 mg increments for the 1, 2, and 3 hour time points of the OGTT. Fasting cut-offs were chosen based on the HAPO study3 whereas postprandial cut-offs were based on accepted OGTT thresholds with 15 gm increments selected to provide for adequate sample size for analysis.
The primary study outcome consisted of a composite outcome that included perinatal mortality, hypoglycemia, hyperbilirubinemia, elevated cord blood c-peptide level, and birth trauma.5 Other outcomes assessed in this analysis included the frequencies of large-for-gestational-age (LGA) (birthweight greater than the 90th centile of a U.S. reference population) infants, shoulder dystocia, and gestational hypertension, preeclampsia, or gestational hypertension coupled with preeclampsia.5 Trained study personnel collected antepartum, intrapartum and post-delivery data for enrolled women and their infants at the time of discharge from the hospital. All cases of hypertensive disorders and shoulder dystocia underwent masked central review by two of the authors to ensure accurate diagnosis.
For statistical analysis, baseline categorical variables were analyzed using chi square or Fisher's exact test. Continuous variables were analyzed using the Wilcoxon rank sum test or the Kruskal-Wallis test. The Cochrane Armitage test was used to test for trends between OGTT category as defined above and the outcomes of interest7Multiple logistic regression analysis was performed examining the relationship of higher OGTT glucose categories compared to the lowest OGTT glucose category to assess whether a trend or threshold was associated with increasing glucose levels and the outcome of interest, while adjusting for other potential confounders. In addition to glucose categories, regression models included maternal age, gestational age at enrollment and at delivery, parity, BMI, and race or ethnicity. Adjusted odds ratios and profile likelihood 95% confidence intervals were calculated.
A nominal two sided P value less than 0.05 was considered to indicate statistical significance. This study was approved by the institutional review boards of all participating centers.
Results
The demographics of the study population are in Table 1. Among the three groups, there was a significant increase in maternal age with greater degrees of carbohydrate intolerance. There were no significant differences in parity, race, and BMI among the three groups.
Table 1. Demographic Information.
| 50 gm Less Than 120 mg% (no OGTT) | 50 gm 135 mg% or higher (normal OGTT) | Untreated GDM | p-value | |
|---|---|---|---|---|
| N | 437 | 931 | 473 | |
| Age (yr) | 25.1 ± 5.3 | 27.4 ± 5.5 | 28.9 ± 5.6 | < 0.0001 |
| Nulliparous (%) | 37.3 | 31.9 | 35.3 | 0.12 |
| Race (%) | 0.70 | |||
| African American | 12.8 | 12.4 | 11.4 | |
| Hispanic | 58.6 | 58.3 | 56 | |
| Caucasian/other | 28.6 | 29.3 | 32.6 | |
| BMI at entry (kg/m2) | 29.9 ± 5.8 | 30.1 ±5.3 | 30.2 ± 5.1 | 0.23 |
Figure 1 illustrates a significant increasing trend (all p<0.002) of the composite perinatal outcome as well as the frequency of LGA infants, elevated cord c-peptide level, shoulder dystocia, and hypertensive disorders of pregnancy among four groups (women with an abnormal screen have been subdivided into those with or without one abnormal OGTT value). For example, the frequency of LGA increased from 6.7% in women with a normal screening value to 14.5% in untreated GDM. We did not observe a significant trend for either neonatal hypoglycemia or hyperbilirubinemia considered as a separate outcome.
Figure 1.
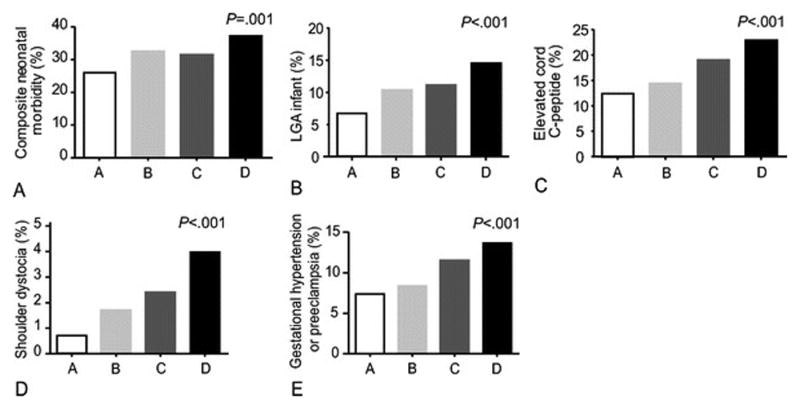
Frequencies of various outcomes according to glucose groupings. A = 50 gm screen <120 mg/dl, B = 50 gm screen ≥135mg/dl with normal OGTT, C = 50 gm screen ≥135 mg/dl with one abnormal OGTT value, D = GDM (two abnormal OGTT values).
Number of Subjects: Composite: A: 407 B: 626 C: 238 D: 440
LGA: A: 421 B: 652 C: 251 D: 454
C-Peptide: A: 365 B: 549 C: 211 D: 403
Shoulder Dystocia: A: 423 B: 653 C: 252 D: 455
Gestational Hypertertension: A: 423 B: 653 C: 252 D: 455
Figure 2 demonstrates direct comparisons between groups. An abnormal glucose screen was associated with an increased risk for both the composite outcome and LGA infants compared with a normal glucose screening test. Women with GDM (2 or more abnormal values on GTT) demonstrated an increased risk for LGA, elevated c-peptide, and shoulder dystocia compared to those with an abnormal screening test only. There were no statistically significant differences in the frequency of any of the outcomes in women with one abnormal value compared to those with untreated GDM.
Figure 2.
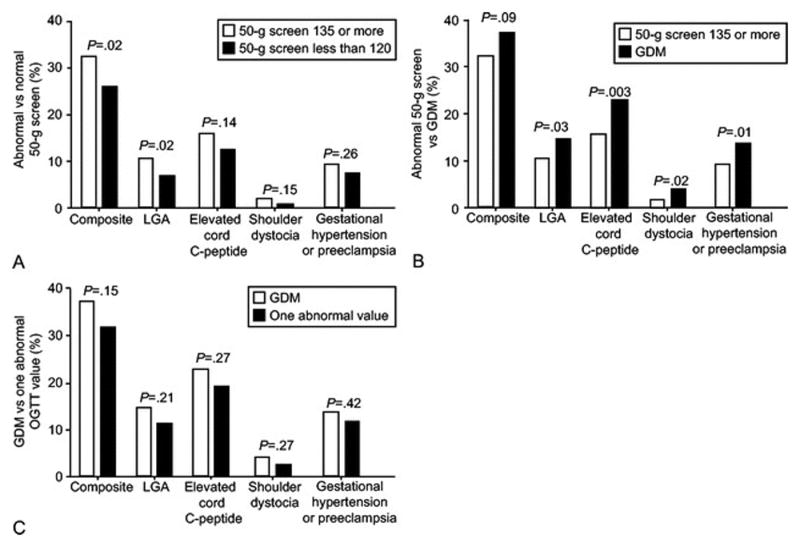
Comparisons of outcomes between glucose groups.
Abnormal versus Normal 50 Gram Screen: Composite: 279/864 (Abnormal Screen), 105/407 (Normal Screen)
LGA: 95/903 (Abnormal Screen), 28/421 (Normal Screen)
C-Peptide (C-Pep): 119/760 (Abnormal Screen), 45/365 (Normal Screen)
Shoulder Dystocia (ShD): 17/905 (Abnormal Screen), 3/423 (Normal Screen)
Gestational Hypertension/Preeclampsia (Gest.HTN/Preec): 83/905 (Abnormal Screen), 31/423 (Normal Screen)
Abnormal Screen versus GDM: Composite: 279/864 (Abnormal Screen), 163/440 (GDM)
LGA: 95/903 (Abnormal Screen), 66/454 (GDM)
C-Peptide (C-Pep): 119/760 (Abnormal Screen), 92/403 (GDM)
Shoulder Dystocia (ShD): 17/905 (Abnormal Screen), 18/455 (GDM)
Gestational Hypertension/Preeclampsia (Gest.HTN/Preec): 83/905 (Abnormal Screen), 62/455 (GDM)
GDM versus 1 Abnormal OGTT Value: Composite: 163/440 (GDM), 75/238 (1 Abnormal OGTT)
LGA: 66/454 (GDM), 28/251 (1 Abnormal OGTT)
C-Peptide (C-Pep): 92/403 (GDM), 40/211 (1 Abnormal OGTT)
Shoulder Dystocia (ShD): 18/455 (GDM), 6/252 (1 Abnormal OGTT)
Gestational Hypertension/Preeclampsia (Gest.HTN/Preec): 62/455 (GDM), 29/252 (1 Abnormal OGTT)
The distribution of subjects in the five glucose categories created from the OGTT is shown in Table 2. Significant trends for increasing frequency for LGA infants were present across the five glucose categories of the fasting, one hour, two hour, and three hour determinations (Figure 3). Similar trends were apparent for the composite outcome (all p<0.05), elevated cord c-peptide level (all p<0.02) with the trends only being significant for the one and two hour glucose in relation to shoulder dystocia (p<0.01). A significant trend was present for all three post glucose load times for hypertensive disorders (all p<0.03).
Table 2. Glucose Categories (mg/dl).
| 1 | 2 | 3 | 4 | 5 | |
|---|---|---|---|---|---|
| Fasting | < 75 (57) | 75-79 (171) | 80-84 (322) | 85-89 (426) | 90-94 (382) |
| 1-hour | < 150 (362) | 150-164 (233) | 165-179 (275) | 180-194 (254) | ≥ 195 (234) |
| 2-hour | < 125 (365) | 125-139 (240) | 140-154 (236) | 155-169 (234) | ≥ 170 (283) |
| 3-hour | < 110 (535) | 110-124 (296) | 125-139 (236) | 140-154 (171) | ≥ 155 (120) |
Number of women in each glucose grouping shown in parentheses.
Figure 3. Percentage of infants with LGA by OGTT Glucose Level.
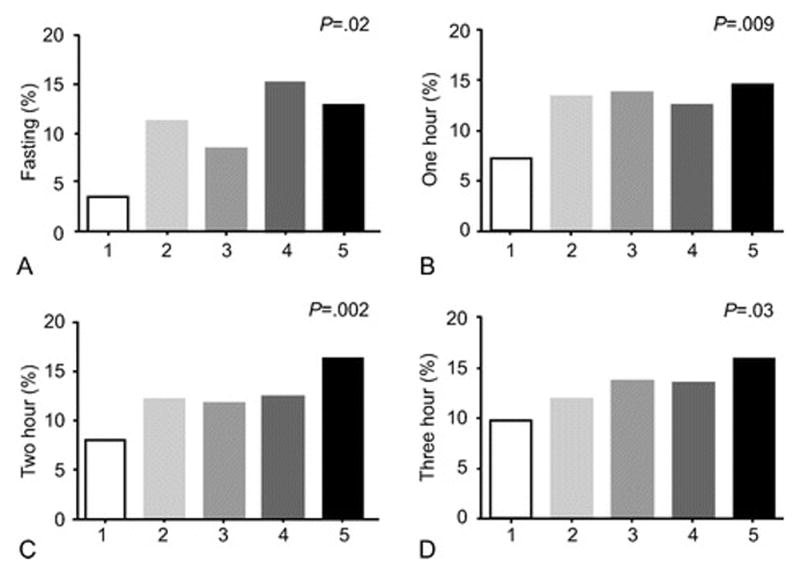
Fasting OGTT (mg/dL): (1) < 75, (2) 75-79, (3) 80-84, (4) 85-89, (5) 90-94
1 Hour OGTT (mg/dL): (1) < 150, (2) 150-164, (3) 165-179, (4) 180-194, (5) ≥ 195
2 Hour OGTT (mg/dL): (1) <125, (2) 125-139, (3) 140-154, (4) 155-169, (5) ≥ 170
3 Hour OGTT (mg/dL): (1) < 110 (2) 110-124, (3) 125-139, (4) 140-154, (5) ≥ 155.
Logistic regression analysis controlling for maternal age, gestational age at enrollment and at delivery, parity, BMI, and race/ethnicity for each glucose category was performed, in which adjusted odds ratios were generated comparing higher glucose categories to the lowest to assess whether a trend or threshold was associated with increasing glucose levels and outcomes (Table 3). For fasting glucose, an increased risk for both elevated c-peptide and LGA were evident at 85-89 mg/dl and for the composite at 90-94 mg/dl. For the one-hour value, an increased risk for the composite, LGA, and hypertensive disorders was evident at levels less than 180 mg/dl. A one-hour value of 165 to 179 mg/dl was associated with an increased risk for the composite outcome, a one-hour values of 150 to 164 mg/dl and 165 to 179 mg/dl was associated with an increased risk for LGA, and a one-hour value of 165 to 179 was associated with an increased risk of hypertensive disorders. The highest two-hour values were not associated with an increased risk for the composite, and the risk for LGA was not apparent until glucose exceeded 170 mg/dl. Similarly, for the three-hour value, an increased risk for several outcomes was present only in the highest glucose category.
Table 3. Adjusted Odds Ratios for Outcomes by OGTT Glucose Levels.
| Fasting Glucose Level (mg/dl) | |||||
|---|---|---|---|---|---|
| Outcome | <75 | 75-79 | 80-84 | 85-89 | 90-94 |
| Events / No. of Patients | Odds Ratio (95% CI) | Odds Ratio (95% CI) | Odds Ratio (95% CI) | Odds Ratio (95% CI) | |
| Composite (442/1304) | 1.0 | 1.40 (0.69-3.01) | 1.36 (0.70-2.84) | 1.63 (0.84-3.37) | 2.00* (1.03-4.15) |
| LGA (161/1357) | 1.0 | 3.27 (0.89-21.09) | 2.16 (0.61-13.72) | 3.98* (1.18-24.85) | 3.67* (1.07-23.05) |
| Elevated C- Peptide (211/1163) | 1.0 | 2.41 (0.78-10.59) | 1.64 (0.55-7.11) | 3.34* (1.15-14.18) | 3.76* (1.29-15.99) |
| Shoulder Dystocia (35/1360) | 1.0** | 3.21 (0.81-21.33) | 2.53 (0.66-16.58) | 3.35 (0.90-21.73) | |
| Gestational Hypertension or Preeclampsia(145/1360) | 1.0 | 1.35 (0.46-4.97) | 1.38 (0.50-4.91) | 0.98 (0.36-3.47) | 1.61 (0.60-5.62) |
| One-Hour Glucose Level (mg/dl) | |||||
| Outcome | <150 | 150-164 | 165-179 | 180-194 | ≥ 195 |
| Events / No. of Patients | Odds Ratio (95% CI) | Odds Ratio(95% CI) | Odds Ratio | (95% CI)Odds Ratio (95% CI) | |
| Composite (442/1304) | 1.0 | 1.17 (0.81-1.70) | 1.52* (1.08-2.15) | 1.27 (0.89-1.82) | 1.46* (1.02-2.11) |
| LGA (161 / 1357) | 1.0 | 1.80* (1.02-3.18) | 1.90* (1.11-3.30) | 1.60 (0.91-2.83) | 2.35* (1.35-4.14) |
| Elevated C- Peptide (211 / 1163) | 1.0 | 1.09 (0.64-1.85) | 1.52 (0.95-2.44) | 1.60 (0.99-2.58) | 2.01 (1.26-3.24) |
| Shoulder Dystocia (35/1360) | 1.0 | 2.33 (0.65-9.39) | 2.83 (0.83-11.02) | 2.26 (0.63-9.05) | 5.44* (1.81-20.10) |
| Gestational Hypertension or Preeclampsia (145 / 1360) | 1.0 | 1.43 (0.76-2.69) | 1.88* (1.06-3.38) | 1.91* (1.07-3.44) | 1.94* (1.09-3.52) |
| Two-Hour Glucose Level (mg/dl) | |||||
| Outcome | <125 | 125-139 | 140-154 | 155-169 | ≥ 170 |
| Events / No. of Patients | Odds Ratio (95% CI) | Odds Ratio (95% CI) | Odds Ratio (95% CI) | Odds Ratio (95% CI) | |
| Composite (442/1304) | 1.0 | 1.29 (0.90-1.85) | 1.27 (0.88-1.82) | 1.22 (0.85-1.75) | 1.40 (0.99-1.98) |
| LGA (161/1357) | 1.0 | 1.58 (0.90-2.76) | 1.47(0.83-2.59) | 1.66 (0.94-2.91) | 2.53* (1.51-4.28) |
| Elevated C- Peptide (211/1163) | 1.0 | 1.55 (0.93-2.58) | 1.51 (0.90-2.52) | 2.01* (1.23-3.30) | 2.36* (1.49-3.77) |
| Shoulder Dystocia (35/1360) | 1.0 | 4.10 (0.86-29.15) | 6.37* (1.49-43.58) | 6.46* (1.51-44.30) | 11.39* (3.02-74.65) |
| Gestational Hypertension or Preeclampsia (145/1360) | 1.0 | 0.81 (0.43-1.49) | 1.27 (0.72-2.23) | 1.31 (0.74-2.29) | 1.33 (0.79-2.27) |
| Three-Hour Glucose Level (mg/dl) | |||||
| Outcome Events / No. of Patients | <110 | 110-124 | 125-139 | 140-154 | ≥ 155 |
| Odds Ratio (95% CI) | Odds Ratio (95% CI) | Odds Ratio (95% CI) | Odds Ratio (95% CI) | ||
| Composite (442/1304) | 1.0 | 0.92 (0.67-1.26) | 1.28 (0.92-1.78) | 1.16 (0.80-1.68) | 1.41 (0.92-2.15) |
| LGA (161/1357) | 1.0 | 1.29* (0.80-2.05) | 1.54 (0.94-2.51) | 1.69 (0.97-2.89) | 2.24* (1.21-4.02) |
| Elevated C- Peptide (211/1163) | 1.0 | 1.08 (0.70-1.65) | 1.66* (1.08-2.53) | 1.01 (0.60-1.66) | 1.94* (1.13-3.28) |
| Shoulder Dystocia (35/1360) | 1.0 | 1.38 (0.53-3.43) | 1.91 (0.72-4.83) | 1.67 (0.51-4.72) | 0.96 (0.15-3.75) |
| Gestational Hypertension or Preeclampsia (145 / 1360) | 1.0 | 1.53(0.91-2.57) | 2.06* (1.21-3.50) | 2.21* (1.24-3.86) | 2.23* (1.13-4.23) |
Confidence Interval does not include 1.
Reference category for Fasting OGTT is < 80.0 for regression model for Shoulder Dystocia.
Discussion
We found a significant relationship between increasing levels of maternal glycemia and perinatal morbidity. This graded increase in adverse maternal-fetal outcomes is observed across the spectrum of carbohydrate intolerance and includes glucose values below current cut-offs for the diagnosis of gestational diabetes.2,3,8 This observation provides additional information as experts continue to debate what constitutes appropriate thresholds for the diagnosis of GDM.
Previous studies have documented that an abnormal glucose screening test alone is an independent predictor of macrosomia. 9,10 In addition to an increased risk for LGA infants, we have also documented a risk exists for other neonatal morbidities as well as shoulder dystocia in this group of women. Because of a perceived intermediate risk for fetal macrosomia, some have advocated follow-up diagnostic testing or close surveillance for fetal overgrowth during the third trimester for women with an abnormal screening test (and normal OGTT) discovered between 24-28 weeks of gestation.11 Recently, a small randomized trial has shown a reduction in large infants in women with abnormal screening results receiving nutritional intervention compared with controls.12
Although our sample size is relatively small, our findings support the hypothesis of an increased risk of perinatal outcomes with one abnormal OGTT value compared to the normal OGTT group, both in the trend analysis and in the comparison with the untreated mild GDM (at least two abnormal OGTT values) group. The finding of similar frequencies of various perinatal outcomes among women with one abnormal OGTT value compared with untreated mild GDM is important as some previous studies have compared this group with treated GDM subjects and thus have been unable to estimate their true level of risk.13 Originally, O'Sullivan and Mahan required two values to be abnormal on the diagnostic OGTT in order to minimize misclassification due to rapid glucose absorption or laboratory error.14 An analysis from the HAPO study demonstrating independent risks at each timed OGTT value has suggested that the criteria for the diagnosis of GDM should be based on the presence of one abnormal OGTT value. In an effort to define GDM, Sacks and colleagues were among the first to attempt to quantitate the relationship between maternal glucose levels and birthweight centiles.8 However, within the ranges of glucose studied in over three thousand women, these authors could not establish a “clinically meaningful” threshold for diagnosis. The HAPO study also failed to yield any apparent inflection points when comparing maternal glycemia to both perinatal and maternal outcomes. Thus, any proposed thresholds for diagnosis, as Sacks predicted, will rely on expert opinion and be based on a consideration of relative risk.8 Our analysis revealed that the risk for LGA and other morbidities to be present at fasting and one hour levels below the current criteria for the diagnosis of GDM. However, risks for LGA did not become significant until two and three hour values exceeded the Carpenter-Coustan thresholds.6 After controlling for confounders, Sermer and colleagues reported that only fasting glucose could be related to macrosomia (birthweight >4000g), whereas others have suggested that the one-hour postprandial level, representing the peak of the glucose response curve is most significant.2
We do note several limitations of this secondary analysis. First, we were able to only consider OGTT data from a cohort of women who failed the 50 gram glucose screen. These individuals likely have an intermediate level of carbohydrate intolerance and also appear to have an increased risk for adverse perinatal outcomes compared to women with normal screening. We chose to generate odds ratios for outcomes in comparison to the lowest glucose categories for this reason. Thus, our finding of increased two and three hour OGTT thresholds for several outcomes among such women may actually be considered even more significant. Our study also utilized the three hour, 100 gram OGTT, which, while standard for use in pregnancy in the United States, is not the diagnostic test common in many areas of the world. This limits direct comparisons to 75 gram, two-hour OGTT data found in other reports.8 While we analyzed outcomes in relation to greater than one thousand OGTTs, our treatment trial did not include a sample size sufficient to suggest precise cut-offs for the diagnosis of GDM. Current proposed recommendations for new diagnostic criteria for GDM, if adopted, will substantially increase the frequency of this diagnosis.15 While two RCTs now demonstrate a treatment benefit to women meeting specific OGTT criteria, evidence is lacking concerning treating women with thresholds outside those we studied as well as one abnormal 75 gram OGTT value.5,16 The results of treatment trials as well as the current analysis, will hopefully further aid professional organizations as they consider the most cost effective approach to the diagnosis and treatment of GDM.
Supplementary Material
Acknowledgments
Supported by grants from the Eunice Kennedy Shriver National Institute of Child Health and Human Development (HD27915, HD34116, HD40485, HD34208, HD27869, HD40500, HD40560, HD34136, HD40544, HD27860, HD40545, HD53097, HD21410, HD27917, HD40512, HD53118, HD36801), General Clinical Research Centers Grant (M01-RR00034) and the National Center for Research Resources (UL1-RR024989, M01-RR00080, UL1-RR025764, C06-RR11234 ) and does not necessarily represent the official views of the NICHD or the National Institutes of Health.
Footnotes
Financial Disclosure: The authors did not report any potential conflicts of interest.
Presented in part at the 30th annual meeting of the Society for Maternal-Fetal Medicine, Chicago, Illinois, February 1-6, 2010.
The authors thank Julia Zachary for data management; Francee Johnson, R.N., Joanne Tillinghast, R.N., and Susan Tolivaisa for coordination between clinical research centers; Elizabeth Thom, PhD for study design, data management, statistical analysis, and manuscript development, Steven G. Gabbe, M.D. and Menachem Miodovnik, M.D. for study design and protocol development, and Roger Newman, M.D. for study design.
Dr. Spong, Associate Editor of Obstetrics & Gynecology, was not involved in the review or decision to publish this article.
Publisher's Disclaimer: This is a PDF file of an unedited manuscript that has been accepted for publication. As a service to our customers we are providing this early version of the manuscript. The manuscript will undergo copyediting, typesetting, and review of the resulting proof before it is published in its final citable form. Please note that during the production process errors may be discovered which could affect the content, and all legal disclaimers that apply to the journal pertain.
References
- 1.Chen Y, Quick WW, Yang W, Zhang Y, Baldwin A, et al. Cost of gestational diabetes in the United States in 2007. Population Health Management. 2009;12:165–174. doi: 10.1089/pop.2009.12303. [DOI] [PubMed] [Google Scholar]
- 2.Sermer M, Naylor D, Phil D, Gare DJ, et al. for the Toronto Tri-Hospital Gestational Diabetes Investigators. Impact of increasing carbohydrate intolerance on maternal-fetal outcomes in 3637 women without gestational diabetes. Am J Obstet Gynecol. 1995;173:146–56. doi: 10.1016/0002-9378(95)90183-3. [DOI] [PubMed] [Google Scholar]
- 3.The HAPO Study Cooperative Research Group. Hyperglycemia and adverse pregnancy outcomes. N Engl J Med. 2008;358:1991–2002. doi: 10.1056/NEJMoa0707943. [DOI] [PubMed] [Google Scholar]
- 4.Dodd JM, Crowther CA, Antoniou G, Baghurst P, Robinson JS. Screening for gestational diabetes: The effect of varying blood glucose definitions in the prediction of adverse maternal and infant health outcomes. Aust NZ J Obstet Gynaecol. 2007;47:307–12. doi: 10.1111/j.1479-828X.2007.00743.x. [DOI] [PubMed] [Google Scholar]
- 5.Landon MB, Spong CY, Thom E, Carpenter MW, et al. A multicenter randomized trial of treatment for mild gestational diabetes. N Engl J Med. 2009;361:1339–48. doi: 10.1056/NEJMoa0902430. [DOI] [PMC free article] [PubMed] [Google Scholar]
- 6.Carpenter DR, Coustan DR. Criteria for screening tests for gestational diabetes. Am J Obstet Gynecol. 1982;144:768–73. doi: 10.1016/0002-9378(82)90349-0. [DOI] [PubMed] [Google Scholar]
- 7.Agresti Alan. Categorical Data Analysis. 1st. New York: Wiley; 1990. pp. 100–102. [Google Scholar]
- 8.Sacks DA, Greenspoon JS, Abu-Fadil S, Henry HM, et al. Toward universal criteria for gestational diabetes: The 75-hour glucose tolerance test in pregnancy. Am J Obstet Gynecol. 1995;172:607–14. doi: 10.1016/0002-9378(95)90580-4. [DOI] [PubMed] [Google Scholar]
- 9.Leiken LE, Jenkins JH, Pomerantz GA, Klein I. Abnormal glucose screening tests in pregnancy: a risk factor for fetal macrosomia. Obstet Gynecol. 1987;69:570–73. [PubMed] [Google Scholar]
- 10.Stamilio DM, Olsen T, Ratcliffe S, Sehdey HM, Macones GA. False-positive 1-h glucose challenge test and adverse perinatal outcome. Obstet Gynecol. 2004;103:148–56. doi: 10.1097/01.AOG.0000109220.24211.BD. [DOI] [PubMed] [Google Scholar]
- 11.Neiger R, Coustan DR. The role of repeat glucose tolerance tests in the diagnosis of gestational diabetes. Am J Obstet Gynecol. 1991;165:787–90. doi: 10.1016/0002-9378(91)90418-q. [DOI] [PubMed] [Google Scholar]
- 12.Bonomo M, Corsica D, Conclaves D, Motet G, et al. Evaluating the therapeutic approach in pregnancies complicated by borderline glucose intolerance: a randomized clinical trial. Diabet Med. 2005;22:1536–41. doi: 10.1111/j.1464-5491.2005.01690.x. [DOI] [PubMed] [Google Scholar]
- 13.Langer O, Brustman L, Anyaegbunam A, Mazze R. The significance of one abnormal glucose tolerance test value on adverse outcome in pregnancy. Am J Obstet Gynecol. 1987;157:758–63. doi: 10.1016/s0002-9378(87)80045-5. [DOI] [PubMed] [Google Scholar]
- 14.O'Sullivan JB, Maban CM, Charles D, Dandrow RV. Screening criteria for high-risk gestational diabetic patients. Am J Obstet Gynecol. 1973;116:895–900. doi: 10.1016/s0002-9378(16)33833-9. [DOI] [PubMed] [Google Scholar]
- 15.IADPSG Consensus Panel. International Association of Diabetes and Pregnancy Study Groups (IADPSG) recommendations on the diagnosis and classification of hypertension in pregnancy. Diabetes Care. 2010;33:676–682. doi: 10.2337/dc09-1848. [DOI] [PMC free article] [PubMed] [Google Scholar]
- 16.Crowther CA, Hiller JE, Moss JR, McPhee AJ, Jeffries WS, Robinson JS. Effect of treatment of gestational diabetes mellitus on pregnancy outcomes. N Engl J Med. 2005;352:2477–86. doi: 10.1056/NEJMoa042973. [DOI] [PubMed] [Google Scholar]
Associated Data
This section collects any data citations, data availability statements, or supplementary materials included in this article.