

Abstract
This paper presents a microchip that isolates and enriches target-binding single-stranded DNA (ssDNA) from a randomized DNA mixture using a combination of solid-phase extraction and electrophoresis. Strands of ssDNA in a randomized mixture are captured via specific binding onto target-functionalized microbeads in a microchamber. The strands are further separated from impurities and enriched on-chip via electrophoresis. The microchip consists of two microchambers that are connected by a channel filled with agarose gel. In the isolation chamber, beads functionalized with human immunoglobulin E (IgE) are retained by a weir structure. An integrated heater elevates the temperature in the chamber to elute desired ssDNA from the beads, and electrophoretic transport of the DNA through the gel to the second chamber is accomplished by applying an electric potential difference between the two chambers. Experimental results show that ssDNA expressing binding affinity to IgE was captured and enriched from a sample of ssDNA with random sequences, demonstrating the potential of the microchip to enhance the sensitivity of ssDNA detection methods in dilute and complex biological samples.
Keywords: Solid-phase extraction, electrophoresis, microchannel, ssDNA, human immunoglobulin E
1. Introduction
In bioanalytical assays, analytes of interest are often present in minute quantities and are contaminated with impurities. Thus, sample preparation steps prior to analysis are essential for improving the resolution of detection results [1-3]. In particular, isolation and enrichment of DNA molecules within dilute and complex samples can enable clinical detection of DNA markers linked to disease and synthetic selection of analyte-specific molecules such as aptamers [4, 5].
Microchip-based devices for sample enrichment have salient advantages over conventional technology, such as reduced sample consumption and shortened assay times. Consequently, many enrichment techniques have been implemented in microfluidic devices to separate and enrich low-concentration biological molecules from complex samples [6-8]. For example, solid-phase extraction (SPE) methods have been employed in microfluidic devices to capture target analytes on a solid phase (e.g., microbeads) while impurities in the sample solution are discarded [9-11]. Similarly, electrophoretic methods are utilized within microchips to effectively concentrate charged molecules (e.g., DNA and protein molecules) by applying an electric field [12, 13]. Liquid-liquid extraction (LLE) also has been used for sample preconcentration on microchips by allowing analytes in an aqueous solution to be extracted into a smaller volume of a water-immiscible solution [14-16].
However, existing devices are limited in their inability to isolate analytes specifically from sample solutions. For example, SPE devices typically employ hydrophobic or electrostatic interactions between analytes and the solid phase, which are inherently nonspecific [17-19]. Additionally, electrophoresis devices separate molecules based on mass-to-charge ratio, thus requiring additional processes to isolate analytes of interest from a solution [20-22]. The limited choice of biocompatible solvents for the extraction of biomolecules [23] and the extraction of non-specific molecules [24] are the main drawbacks of LLE devices. In addition, many existing microfluidic enrichment devices do not effectively separate enriched products from raw samples, contaminating the product solution [13, 25].
Seeking to address these issues, we report on a microchip that effectively isolates and enriches single-stranded DNA (ssDNA) molecules that bind to human immunoglobulin E (IgE) protein using a combination of SPE and electrophoresis methods. In our device, ssDNA molecules are isolated via specific capture onto microbeads functionalized with IgE in a microchamber and are electrophoretically enriched in the other chamber. The two chambers (isolation and enrichment chambers) are connected by a microchannel that is filled with agarose gel. Each chamber has an inlet and an outlet for sample solutions and an inlet for microbeads and a platinum (Pt) wire electrode. In the isolation chamber, microbeads are introduced and retained by a weir structure during the capture of ssDNA strands. The resistive heater integrated under the chamber provides heat to elute strongly bound ssDNA strands from the beads. The gel in the microchannel blocks flows of undesirable samples across the two chambers while only ssDNA strands can be transported with an applied potential difference. Results show that ssDNA strands that bind to human IgE were captured from a mixture of random ssDNA using IgE-coated beads and then released by heat in the isolation chamber. The IgE-binding ssDNA were enriched by repeatedly transporting them to the enrichment chamber via electrophoresis. As a result, our microchip can enhance the sensitivity of ssDNA detection in dilute and complex biological samples.
2. Principle, Design, and Fabrication
2.1. Principle
The isolation and enrichment processes for nucleic acids in a microfluidic chip are schematically shown in Figure 1. A random pool of nucleic acids is introduced to the target-functionalized microbeads placed in the isolation chamber (Figure 1a). Following capture of ssDNA by the beads, wash buffer is flushed through the chamber to remove weakly bound ssDNA (Figure 1b). Strongly bound ssDNA is then eluted from the beads by heating the chamber to 57°C (Figure 1c). The eluted strands are transported to the enrichment chamber by applying an electric field along the channel that is filled with solidified agarose gel. In our device, the gel-filled channel prevents the mixing of the different solutions between the two chambers while allowing only the electrophoretic transport of the isolated ssDNA molecules (Figure 1d). These steps are repeated with additional samples of ssDNA with random sequences to enrich the IgE-binding ssDNA molecules in the enrichment chamber.
Figure 1.

An illustration of isolation and enrichment of ssDNA in a microchip: (a) incubation of target-functionalized beads with ssDNA mixture, (b) wash of the loosely bound ssDNA from the beads, (c) elution of strongly bound ssDNA from the beads by heating, and (d) electrophoretic transport of the eluted ssDNA to the enrichment chamber.
2.2. Design
As shown in Figure 2, the microchip consists of two microchambers (depth: 200 μm, volume: 5 μL) for isolation and enrichment connected by a microchannel (length: 7 mm, width: 1 mm, height: 300 μm). A weir structure (height: 40 μm) in the isolation chamber retains microbeads (diameter: 100 μm) in that chamber during the isolation and enrichment processes. The resistive heater and temperature sensor integrated on the glass substrate controls the temperature in the isolation chamber during the thermal elution of ssDNA from the beads. The connecting channel is filled with agarose gel through an inlet. An additional length of channel (length: 0.6 mm, width: 0.4 mm, height: 40 μm) thermally insulates the solidified gel from the heated chambers during the thermal elution. Supplementary inlets are used to fill these additional channel areas with buffer. An electric field is formed across the microchannel by a potential difference applied via Pt wire electrodes that are inserted into the microchambers through the Pt wire inlets.
Figure 2.

Schematic of the microchip for ssDNA isolation and enrichment.
2.3. Fabrication
The microchip was fabricated from a polydimethylsiloxane (PDMS) microfluidic layer bonded onto a glass substrate patterned with a resistive heater and sensor using conventional microfabrication techniques such as lithography (Figure 3). To prepare an SU-8 mold for the PDMS layer, a silicon wafer was cleaned by soaking in piranha solution (a mixture of 98% sulfuric acid and 30% hydrogen peroxide, 3:1, v/v) for 1 hour. The wafer was then rinsed in deionized water and baked on a hotplate at 180°C for 15 minutes. Layers of SU-8 photoresist were spin-coated on the silicon wafer, exposed to ultraviolet light through photomasks, and baked to define a mold for generating PDMS microchannels (Figures 3a-c). PDMS pre-polymer (Sylgard 184, Dow Corning) was then spread onto the SU-8 mold, baked at 75°C for 1 hour on a hotplate, and peeled off from the mold (Figure 3d). In the meantime, chrome (thickness: 5 nm) and gold (thickness: 100 nm) layers were consecutively deposited on a piranha cleaned glass substrate using a thermal evaporator (Auto 306, BOC Edwards). After the metal layers were patterned using positive photolithography (Figures 3e-h), they were passivated with silicon dioxide (thickness: 1 μm) using plasma-enhanced chemical vapor deposition (Figure 3i). After punching access holes for inlets and outlets in the PDMS layer, it was bonded to the glass substrate following oxygen plasma treatment of the bonding surfaces. Inlet and outlet ports were connected to plastic tubes for sample handling. Molten agarose gel was injected using a micropipette to fill the microchannel through the gel inlet and was allowed to solidify (Figure 3j). The fabricated microchip is shown in Figure 4.
Figure 3.

Fabrication process for the microchip. (a-b) UV exposures on the 1st and 2nd SU-8 photoresist layers. (c) SU-8 mold developed in developer. (d) Casting PDMS layer using the SU-8 mold. (e) UV exposure on the positive photoresist on Au/Cr bilayer on a glass substrate. (f) Developing the photoresist. (g) Etching the Au/Cr bilayer in etchants to realize the resistive heater. (h) Removing the photoresist residue on the heater. (i) Deposition of SiO2 on the heater using PECVD. (j) Packaged microchip with tubing and microchannel filled with agarose gel.
Figure 4.

Photograph of the microchip with the chambers and channel filled with blue ink for visualization. (Scale bar: 1 cm.)
3. Experimental
3.1. Materials
To prepare IgE-functionalized microbeads, 200 μL of solution containing NHS-activated microbeads (mean diameter: ∼100 μm, GE Healthcare) was washed 3 times with 1× PBS buffer modified to contain 1 mM of Mg2+ ions (8.1 mM Na2HPO4, 1.1 mM KH2PO4, 138 mM NaCl, 2.7 mM KCl, 1 mM MgCl2, pH 7.4) [26] by centrifugation. Then the beads were incubated with 200 μL of 0.1 μM human myeloma IgE (Athens Research& Technology) for 5 hours at room temperature. After incubation, excess IgE molecules were discarded by washing the beads with fresh PBS buffer. To reduce nonspecific binding of ssDNA molecules to the beads, the surfaces that were not conjugated with IgE were passivated by incubating the beads in 0.1 M Tris-HCl buffer for 1 hour. The IgE-functionalized beads were stored in PBS buffer at 4°C before use. A fluorescently labeled ssDNA library having random sequences (87-mer, 5′-GCC TGT TGT GAG CCT CCT GTC GAA - 40 random bases - TTG AGC GTT TAT TCT TGT CTC CC-3′), IgE-specific ssDNA aptamer D17.4 (78-mer, KD = 10 nM, 5′-GCC TGT TGT GAG CCT CCT GTC GAA GCA CGT TTA TCC GTC CCT CCT AGT GGC GTG CTT GAG CGT TTA TTC TTG TCT CCC-3′) [26], and forward (5′-GCC TGT TGT GAG CCT CCT GTC GAA-3′) and reverse (5′-GGG AGA CAA GAA TAA ACG CTC AA-3′) primers were purchased from Integrated DNA Technologies. To isolate ssDNA having higher affinity to IgE, a mixture of random ssDNA and aptamer D17.4 (1000:1, mole ratio) was used throughout the experiment to increase competition for IgE binding sites [27]. The random ssDNA solution was prepared by mixing 1 μL of a 100 μM random ssDNA library and 1 μL of 0.1 μM aptamer D17.4 in 98 μL of 1× PBS buffer. The running buffer for electrophoretic transport of ssDNA in the microchannel and for a slab-gel electrophoresis was 0.5× TBE buffer (44.5 mM Tris base, 44.5 mM boric acid, 1.25 mM EDTA, pH 8.3). Three percent agarose gel (Difco Laboratories) for electrophoresis was prepared by dissolving 0.3 grams of agarose in 100 mL of 0.5× TBE buffer on a hotplate.
3.2. Experimental Setup
A schematic of the experimental setup is illustrated in Figure 5. The sample solutions including the ssDNA mixture and buffers were introduced into the microchambers using a syringe pump (NE 300, Harvard Apparatus). The temperature in the isolation chamber during the thermal elution process was maintained at 57°C via the resistive heater and sensor connected with a power supply (E3631A, Agilent Technologies) and a multimeter (34410A, Agilent Technologies), respectively, that are controlled by a LabVIEW-based PID module on a computer. The Pt electrodes were connected to the power supply to apply a potential difference between the two chambers to induce electrophoretic transport of ssDNA strands. The transport of ssDNA through the gel-filled channel was monitored at the center of the channel using a fluorescence microscope (LSM 510, Zeiss).
Figure 5.

A schematic of experimental setup.
3.3. Experimental Procedure
Isolation and enrichment of desired ssDNA molecules in a randomized ssDNA mixture was carried out as follows. The IgE-functionalized microbeads were loaded in the isolation chamber using a syringe through a bead inlet to fill approximately 30% of the chamber volume (∼3 × 10⁴ beads). After loading, the beads were washed for 5 minutes with 1× PBS buffer at a flow rate of 40 μL/min using a syringe pump. The random ssDNA mixture (100 μL) was introduced to the chamber through the inlet at a flow rate of 20 μL/min and collected from the outlet in 3 separate plastic tubes (∼33 μL/tube). PBS buffer was injected to the chamber at 40 μL/min to wash weakly bound DNA strands from the IgE-beads, and the waste solution was collected in 10 separate tubes at the outlet (∼33 μL/tube). The two chambers were filled with 0.5× TBE buffer and then the isolation chamber was heated at 57°C for 5 minutes via the resistive heater to elute strongly bound DNA strands from the beads.
As the thermal elution was occurring, Pt-wire electrodes were inserted into the chambers and a potential difference of approximately 50 V (i.e., an electric field of 25 V/cm) was applied for 25 minutes. The DNA strands were then electrophoretically transported to the enrichment chamber through the gel-filled channel. To investigate the single round of isolation and enrichment of ssDNA, the two chambers were flushed with PBS buffer as eluents were collected in plastic tubes (∼33 μL/tube). For multiple rounds of DNA enrichment, the beads in the isolation chamber were discarded and the chamber was thoroughly washed with PBS buffer prior to the next round of the isolation and enrichment processes to remove undesired DNA molecules that might remain. Fresh IgE-functionalized beads were then introduced in the isolation chamber for the next round of DNA isolation and enrichment.
To analyze the results from the experiment, representative eluent samples from each step were amplified by polymerase chain reaction (PCR) using a thermal cycler (Mastercycler Personal, Eppendorf). The PCR procedure included denaturation of DNA at 95°C for 3 minutes followed by 20 cycles of amplification. Each cycle consisted of denaturation at 95°C for 15 seconds, annealing at 59°C for 30 seconds, and extension at 72°C for 45 seconds. Following the amplification, 7 μL of PCR product was mixed with 7 μL of 2× DNA loading dye containing bromophenol blue and xylene cyanol (Thermo Scientific) and loaded into each lane of a 3% agarose gel. Electrophoresis was then carried out at 100 V for 30 minutes in 0.5× TBE buffer using a slab gel apparatus (Mupid-exU, Advance). The gel was then stained with ethidium bromide in deionized water for 5 minutes. The bands in the gel representing the concentration of DNA in each eluent sample were visualized using a UV illuminator (AlphaImager 3400, Alpha Innotech). A fluorescence microscope was used to monitor the electrophoretic transport of ssDNA through the gel-filled channel. The intensities of gel-bands and fluorescence from images obtained were analyzed using the ImageJ software (National Institutes of Health freeware).
4. Results and Discussion
This section presents experimental results from isolation and enrichment of IgE-binding DNA strands in a microchip. The investigation of the capture of IgE-binding nucleic acids from a sample of DNA with random sequences in the isolation chamber will first be discussed. Then studies on electrophoretic transport of the DNA through the gel-filled channel will be presented. Finally, the enrichment of IgE-binding DNA in the microchip will be discussed.
4.1. Isolation of IgE-binding ssDNA from a Randomized DNA Sample
We first investigated the isolation of IgE-binding ssDNA from the randomized ssDNA mixture in the isolation chamber. IgE isolation was effected by exposing the chamber to samples of randomized DNA and then washing with pure buffer to remove unbound DNA. These buffer samples containing residual DNA were collected following washing, and were amplified with PCR and visualized with slab gel electrophoresis to determine the effectiveness of the isolation procedure. Figure 6a shows a gel electropherogram of the PCR products of eluents collected during the isolation process. In the gel image, bands in lanes L, P, and N represent a 10 base pair (bp) DNA ladder, positive control (a PCR reaction in which template DNA consisted of 100 pmole random ssDNA and 0.1 pmole D17.4 aptamer) and negative control (a PCR reaction excluding template DNA), respectively. Additional bands represent amplified samples of eluent collected during incubation (lane I1), washing (lanes W1-W10), elution (lane E1), and buffer used to wash the enrichment chamber after the ssDNA isolation process (lane EC). Note that the numbers after the abbreviations of each process represent the order in which eluent samples were collected. For example, “5” in “W5” means the 5th eluent sample collected during the washing step.
Figure 6.


(a) Gel electropherogram of amplified eluents obtained during the isolation process. (b) Bar graph depicting band intensity for lanes I1-E1. Lane L: 10 bp ladder, Lane P: positive control, Lane N: negative control, Lane I1: incubation 1, Lane W1: wash 1, Lane W5: wash W5, Lane W10: wash 10, Lane E1: elution 1, and Lane EC: amplified eluent from enrichment chamber.
The upper and lower bands seen in lanes P and I1-E1 represent amplified samples of the 87 bp random ssDNA and 78 bp D17.4 aptamer, respectively. The upper bands are brighter than the lower bands as a result of the 1000:1 molar ratio of random ssDNA to D17.4 aptamer in the DNA mixture used for the isolation experiment. No bands are seen in lane N, indicating that the reagents used during the experiment were not contaminated by undesired DNA molecules. In addition, no bands are seen in lane EC, indicating that the gel-filled microchannel effectively prevented contamination of the enrichment chamber with unwanted ssDNA from the isolation chamber during the capture of the target-specific strands.
A bar graph depicting the band intensity of the 87-mer random ssDNA (the upper band) from lane I1 to lane E1 is plotted to show the progress of the isolation of IgE-binding ssDNA (Figure 6b). The significant concentration of DNA that did not bind to the IgE-coated microbeads during the incubation step is indicated by the high band intensity in lane I1. The decreasing intensity of the bands from lanes W1 to W10 indicates that as washing continued, loosely bound ssDNA molecules were removed from the bead surfaces, increasing the stringency of the isolation of target-specific ssDNA. The increased band intensity in lane E1 indicates that strongly bound ssDNA molecules were eluted from the bead surface by heating at 57°C. In addition, no damage was observed to the agarose gel in the electrophoresis channel, indicating that the channel length between the microchamber and the gel-filled channel was large enough to prevent thermal degradation of the gel during elution of DNA.
To verify that the isolated ssDNA strands in the previous experiment were specifically bound to IgE, we repeated the experiment using fresh NHS beads with no protein coupled to the surfaces. The gel image (Figure 7a) and bar graph (Figure 7b) show bright bands during incubation and earlier washing steps (lanes I1-W5) and no band during later washing and elution steps (lanes W10-E1). This indicates that ssDNA were very weakly bound on the NHS bead surfaces and removed by stringent washings. Hence, the 87-mer ssDNA collected in the previous experiment shown in Figure 6 are mostly likely IgE-binding ssDNA isolated from the random mixture. Similar to the previous experiment, no band seen in lane EC indicates that the gel in the channel prevented the undesired ssDNA from entering the enrichment chamber.
Figure 7.


(a) Gel electropherogram of amplified eluents obtained during the control experiment. (b) Bar graph depicting band intensity for lanes I1-E1. Lane L: 10 bp ladder, Lane P: positive control, Lane N: negative control, Lane I1: incubation 1, Lane W1: wash 1, Lane W5: wash 5, Lane W10: wash 10, Lane E1: elution 1, and Lane EC: amplified eluent from enrichment chamber.
4.2. Electrophoretic Transport of ssDNA through a Gel-Filled Microchannel
We tested 1× PBS and 0.5× TBE buffers as possible electrolytes for the electrophoretic transport of DNA through the gel-filled microchannel. PBS buffer is a strong electrolyte (electrical conductivity: 15 mS/cm [28, 29]), and as it is commonly used for other steps in the process its use in electrophoresis would simplify the enrichment process. Alternatively, TBE buffer (approximate electrical conductivity: 350 μS/cm [30]) is normally used as an electrolyte in gel electrophoresis applications [31].
As shown in Figure 8, when PBS was used as the electrophoresis buffer, no band was visible in corresponding lane, indicating that DNA strands were not transported to the enrichment chamber. However, when using TBE buffer, DNA strands migrated to the enrichment chamber effectively, as indicated by a distinctly visible band seen in lane TBE. This can be explained by noting that although PBS has a much higher conductivity than TBE, the salt ions (i.e., Na+ and Mg2+) present in PBS buffer shield DNA strands and neutralize their negative charges, preventing them from migrating toward the anode (i.e., enrichment chamber) [32, 33]. As a result, we chose to use 0.5× TBE buffer for electrophoretic transport of DNA in our microchip.
Figure 8.

Electrophoresis of the ssDNA through the gel-filled microchannel using different electrolytes. Lane L: 10 bp ladder and Lane P: positive control. Lanes PBS and TBE: eluents collected from the enrichment chamber after electrophoresis using 1× PBS buffer and 0.5× TBE buffer, respectively.
We then investigated the time required to electrophoretically transport ssDNA from the isolation to enrichment chambers. The fluorescence micrographs obtained during electrophoretic transport of fluorescently labeled ssDNA strands at different times monitored at the center of the gel-filled channel are shown in Figures 9(a-c). The peak in the fluorescence intensity profile at 10 minutes indicates that the ssDNA were migrating at a speed of approximately 1 mm/min through the gel-filled channel (Figure 9d). As the distance between the two chambers is approximately 20 mm, at least 20 minutes was required to electrophoretically transport the ssDNA to the enrichment chamber.
Figure 9.


Electrophoretic transport of fluorescently labeled ssDNA through the gel under an electric field of 25 V/cm at different times: (a) t = 0 min, (b) t = 10 min, (c) t = 20 min, and (d) fluorescence intensity as a function of time monitored at the center of the gel-filled channel. (Scale bar: 100 μm.)
We assessed the efficiency of the electrophoretic transport of DNA in our microchip by comparing the electrophoretic mobility of DNA obtained in our experiment with reported values in the literature. The measured DNA velocity (V = 1.7 × 10⁻³ cm/s) is related to the applied electric field (E = 25 V/cm) by the equation V = μE, where μ is the electrophoretic mobility of the DNA. The electrophoretic mobility in our chip was hence calculated to be μ = 6.67 × 10⁻⁵ cm2/Vs. This is lower than reported values (2 × 10⁻⁴ cm2/Vs) in the literature [34, 35], which could be attributed to a non-uniform electric field distribution imposed by geometrical constraints such as microbeads and the weir structure [36, 37].
4.3. Enrichment of IgE-Binding ssDNA
We next performed an entire round of isolation and enrichment of IgE-binding ssDNA in a single microchip. Random ssDNA library was exposed to IgE-coated beads, weakly bound strands were washed away, and aptamer candidates were thermally eluted and electrophoretically transported to the enrichment chamber. To analyze the results of the experiment, we collected eluent from each step (i.e., incubation: I, washing: W, elution: E) as well as the buffer used to wash the two chambers (i.e., isolation chamber: IC, elution chamber: EC) after the processes were completed. These eluents were then chemically amplified using PCR and visualized using slab gel electrophoresis. The electropherogram visualizing the amplified eluents is shown in Figure 10. DNA that did not bind to IgE during the incubation process is indicated by the bands in lanes I1-I3. As expected, these bands display high levels of fluorescent intensity, as most of the random DNA did not bind to IgE. The decrease in band intensity from lane W1 to W10 indicates that ssDNA strands having low binding affinity to IgE were gradually removed as the beads were continuously washed with buffer. The bright band in lane EC1 and dimmer band in lane IC1 indicate that the majority of the thermally eluted ssDNA having high binding affinities to IgE were electrophoretically transported to the enrichment chamber.
Figure 10.

Gel electropherogram of eluents obtained from the isolation and enrichment chambers after one round of isolation and enrichment experiment. Lane L: 10 bp ladder, Lane P: positive control, Lane N: negative control, Lanes I1-I3: incubations 1-3, and Lanes W1-W10: washes 1-10. Lanes EC1-EC3 and IC1-IC3: eluents 1-3 from the enrichment chamber and the isolation chamber, respectively, collected after completed processes.
To investigate the ability of the developed microchip to enrich IgE-binding DNA, multiple rounds of ssDNA enrichment were performed on a single chip. In this experiment, the isolated IgE-binding ssDNA strands were repetitively enriched via electrophoretic transport. A gel electropherogram of amplified eluents collected after 1 round (lane 1), 2 rounds (lane 2), and 3 rounds (lane 3) of enrichment in the microchip is shown in Figure 11(a).
Figure 11.
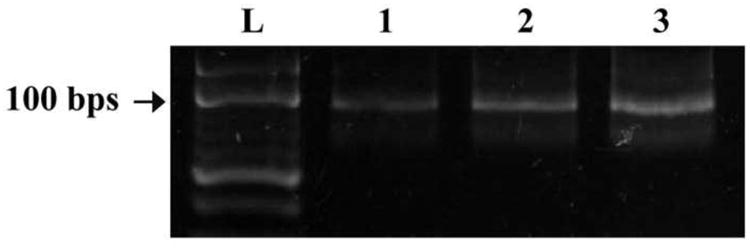

(a) Gel electropherogram of eluents obtained from the enrichment chamber following PCR amplification. (b) Bar graph depicting band intensities of the eluents. Lane L: 10 bp ladder, Lane 1-3: Eluents from the enrichment chamber after 1, 2, and 3 enrichment processes, respectively. Error bars denote standard deviation of three independent experiments.
As shown in Figure 11(b), with an increasing number of enrichments a higher concentration of DNA was detected in the enrichment chamber. The intensities of the bands for 2 and 3 rounds increase by approximately 72.1% and 153.3%, respectively, compared to the band intensity for 1 round. For a given number of rounds, experiments were performed in triplicate, which allowed calculation of standard deviations to assess the repeatability of DNA enrichment. These standard deviations were found to be 5.50, 5.04, and 6.02 for 1, 2, and 3 rounds of enrichment, respectively. The low standard deviations relative to the mean values indicate consistency in DNA enrichment using our device. With the device repeatability determined from these experiments, no intermediate band intensity from round to round was measured in multi-round enrichment experiments. In addition, no damage to the gel-filled microchannel was observed after the multiple rounds of enrichment. This indicates that further rounds of electrophoresis can be conducted to continue enriching IgE-binding ssDNA strands in the microchamber.
5. Conclusions
We have presented a microfluidic chip that isolates and enriches ssDNA molecules from a randomized pool using IgE-functionalized microbeads. The developed microchip consists of two chambers (i.e., isolation and enrichment chambers) connected by a microchannel filled with agarose gel. A weir structure integrated into the isolation chamber retains target-functionalized beads during the isolation of target specific DNA strands. The resistive heater under the isolation chamber provides heat to elute strongly bound DNA strands from the beads. The gel in the microchannel prevents unwanted nucleic acids from contaminating the other chamber, while allowing DNA strands to be transported using an applied potential difference between the chambers.
Experimental results obtained using the chip have shown that ssDNA that strongly bind to IgE were captured by IgE-functionalized beads in the isolation chamber. The isolated ssDNA were then electrophoretically transported through the gel-filled channel at a speed of approximately 1 mm/min to the enrichment chamber. The IgE-binding ssDNA were repetitively enriched in the chamber by increasing the number of the isolation and enrichment processes. During the multiple rounds of enrichment, the gel-filled channel effectively blocked flows of unwanted samples across the two chambers without having thermal damage. Experiments demonstrated that ssDNA that strongly bound to human IgE can be repeatedly isolated and enriched using a combination of solid-phase extraction and electrophoresis methods in our microchip. Thus, our device enables more efficient isolation and enrichment of nucleic acids than allowed by existing devices that use either solid-phase extraction or electrophoresis only. As such, our device can be potentially used for isolation of protein-binding nucleic acids such as aptamers.
Acknowledgments
We gratefully acknowledge financial support from the National Science Foundation (Award No. CBET-0854030) and the National Institutes of Health (Award Nos. RR025816-02 and CA147925-01).
Biographies
Jinho Kim is a Ph.D. candidate in Mechanical Engineering at Columbia University. He received B.S. (Summa cum laude) and M.S. degrees in Mechanical Engineering at Temple University, Philadelphia, USA, in 2007 and 2009, respectively. His research interests include development of nano/micro-biosensors for clinical diagnostics as well as applications of computational fluid dynamics (CFD) to all aspects of fluid dynamics and heat transfer.
John P. Hilton received his B.S.E degree from The Cooper Union for the Advancement of Science and Art in 2006, followed by a M.Eng. in 2007 from the same institution. He has been studying for a Ph.D. under the direction of Dr. Qiao Lin since 2008 at Columbia University. His interests include the use of microfluidic devices as sensor platforms and for the generation of affinity binding molecules, as well as CFD simulations of convective heat transfer.
Kyung A. Yang obtained her Ph.D. in plant molecular biology from Gyeongsang National University, Jinju, South Korea, in 2005. She has been a postdoctoral researcher at Seoul National University and currently in Department of Medicine at Columbia University. Her research interests include DNA computing and molecular biology.
Renjun Pei received his B.Sc. in 1993 and Ph.D. in 1998 from Wuhan University. He has been a professor at Suzhou Institute of Nano-Tech and Nano-Bionics, Chinese Academy of Sciences since 2011. His current interests include DNA-based nano-biomedicine, DNA computation, molecular robots, mRNA imaging, microfluidic microarray, nanobiosensor array, aptamer SELEX, target-directed delivery and molecular imaging, and high selective nano gene drugs.
Milan Stojanovic obtained his B.Sc. at Beogradski Univerzitet, Serbia and Ph.D. in organic chemistry at Harvard University, USA. After a postdoctoral fellowship at Columbia University, Department of Medicine, he remained there as a faculty member.
Qiao Lin received his Ph.D. in Mechanical Engineering from the California Institute of Technology in 1998 with thesis research in robotics. He conducted postdoctoral research in microelectromechanical systems (MEMS) at the Caltech Micromachining Laboratory from 1998 to 2000, and was an assistant professor of Mechanical Engineering at Carnegie Mellon University from 2000 to 2005. He has been an associate professor of Mechanical Engineering at Columbia University since 2005. His research interests are in designing and creating integrated micro/nanosystems, in particular MEMS and microfluidic systems, for biomedical applications.
Footnotes
Publisher's Disclaimer: This is a PDF file of an unedited manuscript that has been accepted for publication. As a service to our customers we are providing this early version of the manuscript. The manuscript will undergo copyediting, typesetting, and review of the resulting proof before it is published in its final citable form. Please note that during the production process errors may be discovered which could affect the content, and all legal disclaimers that apply to the journal pertain.
References
- 1.Oh HJ, Park JY, Park SE, Lee BY, Park JS, Kim SK, Yoon TJ, Lee SH. DNA-Enrichment Microfluidic Chip for Chromatin Immunoprecipitation. Analytical Chemistry. 2009;81:2832–2839. doi: 10.1021/ac802034s. [DOI] [PubMed] [Google Scholar]
- 2.Shiddiky MJA, Shim YB. Trace analysis of DNA: preconcentration, separation, and electrochemical detection in microchip electrophoresis using Au nanoparticles. Analytical Chemistry. 2007;79:3724–3733. doi: 10.1021/ac0701177. [DOI] [PubMed] [Google Scholar]
- 3.Lichtenberg J, de Rooij NF, Verpoorte E. Sample pretreatment on microfabricated devices. Talanta. 2002;56:233–266. doi: 10.1016/s0039-9140(01)00593-8. [DOI] [PubMed] [Google Scholar]
- 4.Nguyen TH, Pei R, Stojanovic M, Lin Q. Demonstration and Characterization of Biomolecular Enrichment on Microfluidic Aptamer-Functionalized Surfaces. Sensors and Actuators B: Chemical. 2010 doi: 10.1016/j.snb.2010.11.024. [DOI] [PMC free article] [PubMed] [Google Scholar]
- 5.Kim J, Hilton J, Yang K, Pei R, Ennis K, Stojanovic M, Lin Q. A microchip for nucleic acid isolation and enrichment. Proceedings of IEEE MEMS Conference; Paris, France. 2012. pp. 765–768. [Google Scholar]
- 6.Dittrich PS, Tachikawa K, Manz A. Micro total analysis systems. Latest advancements and trends. Analytical Chemistry. 2006;78:3887–3908. doi: 10.1021/ac0605602. [DOI] [PubMed] [Google Scholar]
- 7.Crevillén AG, Hervás M, López MA, González MC, Escarpa A. Real sample analysis on microfluidic devices. Talanta. 2007;74:342–357. doi: 10.1016/j.talanta.2007.10.019. [DOI] [PubMed] [Google Scholar]
- 8.Kim SM, Burns MA, Hasselbrink EF. Electrokinetic protein preconcentration using a simple glass/poly (dimethylsiloxane) microfluidic chip. Analytical Chemistry. 2006;78:4779–4785. doi: 10.1021/ac060031y. [DOI] [PubMed] [Google Scholar]
- 9.Saunders KC, Ghanem A, Boon Hon W, Hilder EF, Haddad PR. Separation and sample pre-treatment in bioanalysis using monolithic phases: A review. Analytica Chimica Acta. 2009;652:22–31. doi: 10.1016/j.aca.2009.05.043. [DOI] [PubMed] [Google Scholar]
- 10.Oleschuk RD, Shultz-Lockyear LL, Ning Y, Harrison DJ. Trapping of bead-based reagents within microfluidic systems: on-chip solid-phase extraction and electrochromatography. Analytical Chemistry. 2000;72:585–590. doi: 10.1021/ac990751n. [DOI] [PubMed] [Google Scholar]
- 11.Liu L, Yu S, Yang S, Zhou P, Hu J, Zhang Y. Extraction of genomic DNA using a new amino silica monolithic column. Journal of Separation Science. 2009;32:2752–2758. doi: 10.1002/jssc.200900208. [DOI] [PubMed] [Google Scholar]
- 12.Kim SJ, Song YA, Han J. Nanofluidic concentration devices for biomolecules utilizing ion concentration polarization: theory, fabrication, and applications. Chemical Society Reviews. 2010;39:912–922. doi: 10.1039/b822556g. [DOI] [PMC free article] [PubMed] [Google Scholar]
- 13.Dai J, Ito T, Sun L, Crooks RM. Electrokinetic trapping and concentration enrichment of DNA in a microfluidic channel. Journal of the American Chemical Society. 2003;125:13026–13027. doi: 10.1021/ja0374776. [DOI] [PubMed] [Google Scholar]
- 14.Pena-Pereira F, Lavilla I, Bendicho C. Miniaturized preconcentration methods based on liquid-liquid extraction and their application in inorganic ultratrace analysis and speciation: A review. Spectrochimica Acta Part B: Atomic Spectroscopy. 2009;64:1–15. [Google Scholar]
- 15.Ho TS, Pedersen-Bjergaard S, Rasmussen KE. Recovery, enrichment and selectivity in liquid-phase microextraction: Comparison with conventional liquid–liquid extraction. Journal of Chromatography A. 2002;963:3–17. doi: 10.1016/s0021-9673(02)00215-7. [DOI] [PubMed] [Google Scholar]
- 16.Handlos A, Baron T. Mass and heat transfer from drops in liquid-liquid extraction. AIChE Journal. 1957;3:127–136. [Google Scholar]
- 17.Lin CC, Hsu JL, Lee GB. Sample preconcentration in microfluidic devices. Microfluidics and Nanofluidics. 2011;10:481–511. [Google Scholar]
- 18.Karwa M, Hahn D, Mitra S. A sol–gel immobilization of nano and micron size sorbents in poly (dimethylsiloxane)(PDMS) microchannels for microscale solid phase extraction (SPE) Analytica Chimica Acta. 2005;546:22–29. doi: 10.1016/j.aca.2005.05.029. [DOI] [PubMed] [Google Scholar]
- 19.Zhong R, Liu D, Yu L, Ye N, Dai Z, Qin J, Lin B. Fabrication of two-weir structure-based packed columns for on-chip solid-phase extraction of DNA. Electrophoresis. 2007;28:2920–2926. doi: 10.1002/elps.200600604. [DOI] [PubMed] [Google Scholar]
- 20.Pennathur S, Baldessari F, Santiago JG, Kattah MG, Steinman JB, Utz PJ. Free-solution oligonucleotide separation in nanoscale channels. Analytical Chemistry. 2007;79:8316–8322. doi: 10.1021/ac0710580. [DOI] [PubMed] [Google Scholar]
- 21.Stein D, Deurvorst Z, Van Der Heyden FHJ, Koopmans WJA, Gabel A, Dekker C. Electrokinetic Concentration of DNA Polymers in Nanofluidic Channels. Nano letters. 2010;10:765–772. doi: 10.1021/nl902228p. [DOI] [PubMed] [Google Scholar]
- 22.Wu D, Qin J, Lin B. Electrophoretic separations on microfluidic chips. Journal of Chromatography A. 2008;1184:542–559. doi: 10.1016/j.chroma.2007.11.119. [DOI] [PMC free article] [PubMed] [Google Scholar]
- 23.Mazzola PG, Lopes AM, Hasmann FA, Jozala AF, Penna TCV, Magalhaes PO, Rangel-Yagui CO, Pessoa A., Jr Liquid–liquid extraction of biomolecules: an overview and update of the main techniques. Journal of Chemical Technology and Biotechnology. 2008;83:143–157. [Google Scholar]
- 24.Pedersen-Bjergaard S, Rasmussen KE, Grønhaug Halvorsen T. Liquid–liquid extraction procedures for sample enrichment in capillary zone electrophoresis. Journal of Chromatography A. 2000;902:91–105. doi: 10.1016/s0021-9673(00)00738-x. [DOI] [PubMed] [Google Scholar]
- 25.Inoue A, Ito T, Makino K, Hosokawa K, Maeda M. I-Shaped microchannel array chip for parallel electrophoretic analyses. Analytical Chemistry. 2007;79:2168–2173. doi: 10.1021/ac0616097. [DOI] [PubMed] [Google Scholar]
- 26.Wiegand TW, Williams PB, Dreskin SC, Jouvin MH, Kinet JP, Tasset D. High-affinity oligonucleotide ligands to human IgE inhibit binding to Fc epsilon receptor I. The Journal of Immunology. 1996;157:221. [PubMed] [Google Scholar]
- 27.Levine HA, Nilsen-Hamilton M. A mathematical analysis of SELEX. Computational Biology and Chemistry. 2007;31:11–35. doi: 10.1016/j.compbiolchem.2006.10.002. [DOI] [PMC free article] [PubMed] [Google Scholar]
- 28.Cannizzaro C, Tandon N, Figallo E, Park H, Gerecht S, Radisic M, Elvassore N, Vunjak-Novakovic G. Practical aspects of cardiac tissue engineering with electrical stimulation. Methods in Molecular Medicine. 2007;140:291. doi: 10.1007/978-1-59745-443-8_16. [DOI] [PubMed] [Google Scholar]
- 29.Miki S, Kaneta T, Imasaka T. Capillary electrophoresis immunoassay based on an on-column immunological reaction. Journal of Chromatography A. 2005;1066:197–203. doi: 10.1016/j.chroma.2005.01.037. [DOI] [PubMed] [Google Scholar]
- 30.Munson MS, Danger G, Shackman JG, Ross D. Temperature gradient focusing with field-amplified continuous sample injection for dual-stage analyte enrichment and separation. Analytical Chemistry. 2007;79:6201–6207. doi: 10.1021/ac070689r. [DOI] [PubMed] [Google Scholar]
- 31.Hayes JJ, Wolffe AP. Histones H2A/H2B inhibit the interaction of transcription factor IIIA with the Xenopus borealis somatic 5S RNA gene in a nucleosome. Proceedings of the National Academy of Sciences. 1992;89:1229. doi: 10.1073/pnas.89.4.1229. [DOI] [PMC free article] [PubMed] [Google Scholar]
- 32.Morales MC, Lin H, Zahn JD. Continuous microfluidic DNA and protein trapping and concentration by balancing transverse electrokinetic forces. Lab Chip. 2011 doi: 10.1039/c1lc20605b. [DOI] [PubMed] [Google Scholar]
- 33.Dill KA, Bromberg S. Molecular driving forces: statistical thermodynamics in chemistry and biology. Routledge. 2003 [Google Scholar]
- 34.Rousseau J, Drouin G, Slater GW. Gel electrophoretic mobility of single-stranded DNA: The two reptation field-dependent factors. Electrophoresis. 2000;21:1464–1470. doi: 10.1002/(SICI)1522-2683(20000501)21:8<1464::AID-ELPS1464>3.0.CO;2-E. [DOI] [PubMed] [Google Scholar]
- 35.Heller C. Separation of double-stranded and single-stranded DNA in polymer solutions: I. Mobility and separation mechanism. Electrophoresis. 1999;20:1962–1976. doi: 10.1002/(SICI)1522-2683(19990701)20:10<1962::AID-ELPS1962>3.0.CO;2-H. [DOI] [PubMed] [Google Scholar]
- 36.Chu G, Vollrath D, Davis RW. Separation of large DNA molecules by contour-clamped homogeneous electric fields. Science. 1986;234:1582–1585. doi: 10.1126/science.3538420. [DOI] [PubMed] [Google Scholar]
- 37.Chan YC, Lee YK, Zohar Y. High-throughput design and fabrication of an integrated microsystem with high aspect-ratio sub-micron pillar arrays for free-solution micro capillary electrophoresis. Journal of Micromechanics and Microengineering. 2006;16:699. [Google Scholar]