ABSTRACT
An efficient protocol for the manual fluorescent MGIT culture system combined with rapid confirmation of Mycobacterium avium subsp. paratuberculosis (MAP) growth in the broth culture was established and evaluated for the detection of viable MAP in direct quantitative PCR (QPCR) positive bovine feces. Manually detected fluorescence emissions from MGIT tubes were analyzed objectively using an open source software, ImageJ. For molecular confirmation of MAP growth, DNA samples harvested by simply boiling the broth, an inexpensive and time- and labor-saving DNA preparation method, yielded adequate results. The sheep strain of MAP required longer incubation time relative to the cattle strain, suggesting that the MGIT system may not support well the growth of ovine isolates as described previously. Of 61 direct QPCR positive bovine feces, the recovery rate of MAP in the MGIT system (62.3%) was significantly higher (P<0.05) than that using 7H10 agar-based slants (44.3%). The time to obtain a final result for fecal culture by the MGIT system was several weeks earlier compared to solid media. In MGIT culture positive samples, the time to detect fluorescence was correlated with the DNA quantity detected in fecal QPCR. As a positive result in the direct fecal QPCR test does not mean fecal excretion of viable MAP, bacterial isolation by fecal culture could be conducted to verify the QPCR result. For this purpose, the manual MGIT system is a sensitive and rapid culture method at least for bovine samples.
Keywords: fecal culture, ImageJ, MGIT, paratuberculosis, real-time quantitative PCR
Johne’s disease (JD) is prevalent worldwide in domestic ruminant animals and causes significant economic damage to livestock farming enterprises. Treatment of JD is not considered a practical option, and therefore, test-based culling of infected animals and preventing transmission are currently accepted as the most effective and rewarding strategies to control the disease [10, 18]. In Japan, the prevalence of JD has been kept at a low level by conducting nationwide active surveillance and culling infected animals with compensation since 1997.
Infected animals become infectious primarily by starting to shed Mycobacterium avium subsp. paratuberculosis (MAP), the etiological agent of JD, in their feces. These animals can shed approximately 108 organisms per gram of feces [2, 22]. Isolation of MAP from shedding animals by fecal culture is one of the most frequently used ante-mortem diagnostic tests for JD. To circumvent the dependence on time consuming culture methods, employment of a real-time quantitative PCR (QPCR)-based test for detection and quantification of MAP DNA in feces has been considered in Japan. It has been shown that a direct fecal QPCR test has similar sensitivity compared to fecal culture and provides immediate information to estimate the risk of transmission by quantification of MAP DNA in feces [8, 9]. However, the QPCR assay also detected many culture negative fecal samples from animals exposed to MAP, and it was not possible to distinguish live MAP from dead MAP [8]. To validate the QPCR assay for the detection of ‘live’ MAP shedders, employment of a practical rapid and sufficiently sensitive fecal culture method is still required.
For cultivation of MAP from clinical samples, solid media, such as Herrold’s egg yolk medium (HEYM) or Middlebrook 7H10 agar-based slants, are commonly used in Japan. However, many reports from abroad have suggested that liquid culture methods have advantages over solid media in terms of higher sensitivity [3, 12, 21] and shorter incubation time [4]. Among the commercially available liquid culture media, adequate performance of the MGIT culture system designed specifically for recovery of MAP (MGIT Para TB medium) has been shown for bovine samples [5, 6, 20]. MGIT medium, which is non-radioactive, replaced the BACTEC 460 system which involved use of radioactive media. MGIT media can be monitored manually using a simple UV light reader for fluorescence detection where an automated MGIT instrumentation is not available, but there are conflicting reports on the performance of the manual method. In one study, manual and automated MGIT systems showed similar detection times and recovery rates of mycobacteria, although a significant number of false-positive results were observed in the manual MGIT system [16]. In a second study, manual reading under a UV transilluminator required a longer incubation period to be positive and had a lower rate of detection of MAP compared to the results obtained by the automated MGIT system [7].
In order to introduce a liquid culture system to Japan for diagnosis of JD, an efficient protocol for the manual MGIT system combined with rapid confirmation of MAP growth was established in this study. The system was evaluated for the detection of viable MAP in direct QPCR positive bovine feces by comparison with fecal culture on solid medium.
MATERIALS AND METHODS
Culture media: A 7H10 agar-based plate containing DifcoTM Middlebrook 7H10 Agar (Becton, Dickinson and Co., Sparks, MD, U.S.A.) supplemented with 10% BBLTM Middlebrook OADC Enrichment (Becton, Dickinson and Co.), 7.5% egg yolk, 2 µg/ml of mycobactin J (Kyoritsu Seiyaku, Tokyo, Japan), 0.5% v/v glycerol and 50 µg/ml of amphotericin B was used for bacterial culture.
For fecal culture, Middlebrook 7H10 agar-based slants were also prepared. Ingredients were the same as the plate described above with the addition of 0.005% malachite green, 50 µg/ml vancomycin and 50 µg/ml nalidixic acid.
The manual fluorescent MGIT system was conducted as follows. An MGIT Para TB medium tube (Becton, Dickinson and Co.) was prepared and handled as recommended by the manufacturer with the exception that vancomycin was omitted for culturing the S strain of MAP. Cultures were incubated at 37°C for at least 49 days as prescribed by the manufacturer and monitored manually at least twice a week using a homemade device to capture an image of fluorescence from MGIT tubes. Digital images were analyzed with Java-based open source software, ImageJ 1.46p, freely downloadable from the US National Institute of Health website (http://imagej.nih.gov/ij/). Using a built-in method for dot blot analysis, the integrated density of each MGIT tube was measured according to the guidelines (also summarized in Fig. 1). Positive signals were defined as an integrated density over 30,000.
Fig. 1.
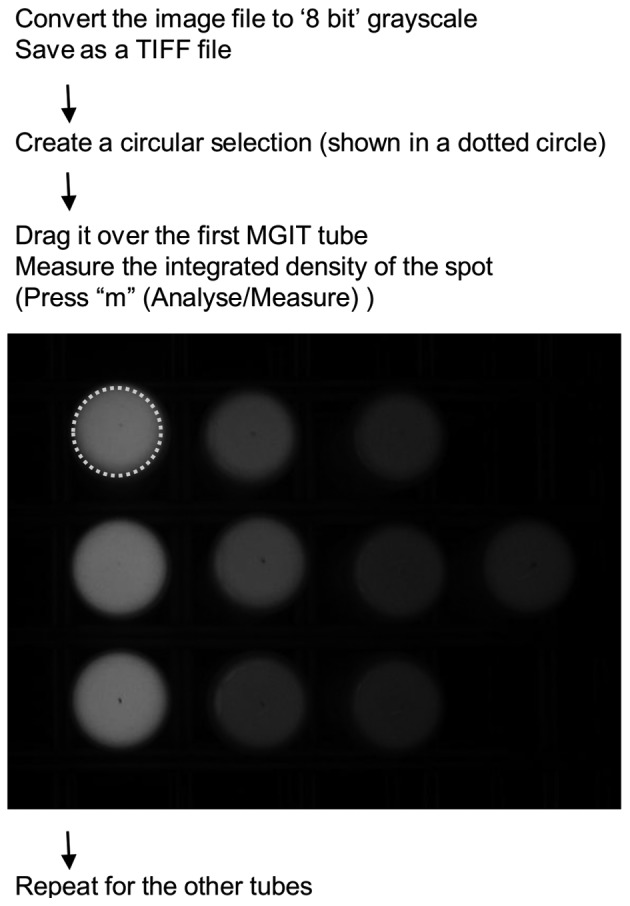
Image analysis by ImageJ 1.46p.
DNA extraction from MGIT medium: Three DNA extraction methods were compared in this study for molecular confirmation of MAP growth in the MGIT medium. After 7 weeks culture of MAP strains (K10 and Telford as described below) and a fecal sample from experimentally infected cattle in the MGIT medium, tenfold serial dilutions of the culture broth were prepared in control MGIT medium, and 170 µl of each dilution was processed for DNA extraction described as follows (also summarized in Table 1). The DNA harvesting process was conducted in duplicate.
Table 1. Methods for DNA extraction from MGIT culture tested in this study.
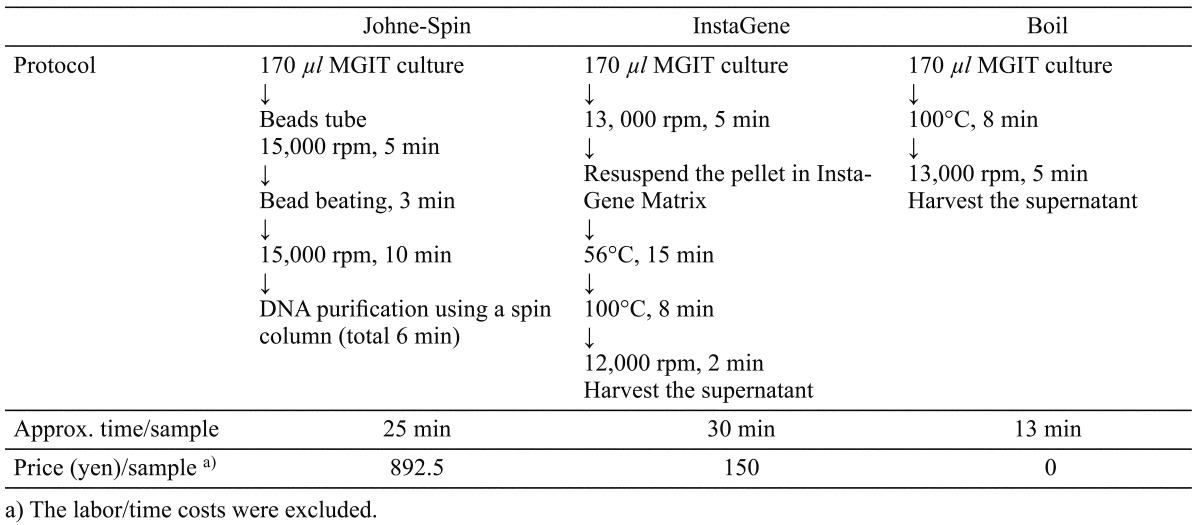
Johne-Spin; DNA extraction using a Johne-Spin (FASMAC, Atsugi, Japan) employed mechanical disruption of cells with bead beating followed by DNA purification using a spin column. Briefly, 170 µl of MGIT medium was transferred to a tube containing zirconia beads and centrifuged at 20,000 × g for 5 min. After the supernatant was carefully removed, 600 µl of lysis buffer and 6 µl of RNase A solution were added to the pellet with microbeads. Samples were agitated at 4,600 rpm for 3 min using a homogeniser (Micro SmashTM MS-100, TOMY SEIKO Co., Ltd., Tokyo, Japan). Following centrifugation at 13,000 × g for 1 min, 75 µl of extraction buffer was added to the homogenized sample. After centrifugation at 20,000 × g for 10 min, 500 µl of the supernatant was transferred to a new 1.5 ml tube containing 400 µl of binding buffer and then mixed by inverting. All the mixture was transferred to a spin column and centrifuged at 13,000 × g for 1 min. The column was washed once with 600 µl of washing buffer by centrifugation at 13,000 × g for 1 min and then placed onto a new 1.5 ml tube. Fifty microliter of elution buffer was added onto the center of the membrane, and the column was stood for 3 min at room temperature. DNA samples were eluted by centrifugation the column at 13,000 × g for 1 min.
InstaGene; DNA extraction using an InstaGeneTM Matrix (Bio-Rad, Hercules, CA, U.S.A.) was conducted according to the manufacturer’s instructions. Briefly, 170 µl of MGIT medium was transferred to a fresh microfuge tube. After centrifugation at 13,000 rpm for 5 min, 200 µl of InstaGeneTM Matrix was added to the pellet and incubated at 56°C for 15 min. The tube was placed in a boiling waterbath for 8 min and then centrifuged at 12,000 rpm for 2 min. After centrifugation, the supernatant was used for the QPCR assay.
Boiling; 170 µl of MGIT medium was transferred to a microcentrifuge tube and placed in a boiling waterbath for 8 min. After centrifugation at 13,000 rpm for 5 min, the supernatant was used for the QPCR assay.
To evaluate the ability of each extraction method to eliminate PCR inhibitors in the MGIT components, 2.5 µl of each template DNA harvested from control media was mixed with 1 pg of MAP genomic DNA and tested by QPCR. As a negative control for this experiment, 2.5 µl of TE buffer was used.
Molecular confirmation by QPCR: The QPCR assay to detect MAP IS900 was as described previously [8] with small modifications. A reaction volume of 25 µl contained 2.5 µl of template DNA, 12.5 µl of 2× QuantiTect SYBR Green PCR Master Mix (QIAGEN, Tokyo, Japan), 0.125 µl of 100 pmol of forward (MP10-1) and reverse (MP11-1) primers and 0.125 µl of 5,000 U/ml Uracil-DNA Glycosylase (UDG, New England BioLabs, Ipswich, MA, U.S.A.) in nuclease free water. The reaction conditions were arranged as follows; an initial incubation step at 37°C for 10 min to control carry-over contamination by UDG, one cycle of 15 min at 95°C and 45 cycles of PCR amplification at 95°C for 30 sec and 68°C for 60 sec followed by the dissociation curve analysis. For quantification, a standard curve was created as described previously [8]. All DNA templates were tested by the QPCR assay in duplicate.
MAP strains and preparation of bacterial suspensions: Two genotypically-distinct type strains of MAP were used in this study; cattle (C) strain K-10 (BAA-968) and sheep (S) strain Telford 9.2 (generous gift from Dr. R. Whittington). MAP strains were grown on Middlebrook 7H10 agar plates for 6 weeks at 37°C in air supplemented with 5% CO2. Bacterial cells were harvested and resuspended in PBS. The total number of MAP cells in each suspension was estimated by the DNA quantity (one genome of MAP contains 5 fg DNA) detected by a QPCR assay described previously [8].
The stock suspension was diluted in serial one hundredfold steps in PBS to provide bacterial suspensions ranging from 108 to 102 cells/ml, and 100 µl of each dilution was inoculated into each of 2 MGIT Para TB tubes to yield final concentrations ranging from 107 to 101 cells/tube. The tubes were incubated at 37°C, and the fluorescence emission was monitored twice a week. DNA templates were prepared from the MGIT cultures using the ‘Boiling’ method described above and tested by QPCR twice a week for the C strain of MAP (K-10) up to 5 weeks and once or twice a week for the S strain (Telford 9.2) up to 7 weeks.
Fecal samples and sample preparation for fecal culture: Fecal samples collected from naturally and experimentally infected cattle were tested by a direct QPCR assay described previously [8] using Johne-Spin (FASMAC) for DNA extraction from feces [11]. A total of 61 QPCR positive feces were processed for fecal culture. Sample preparation for fecal culture was undertaken by the NADC method of Stabel [17] with some modifications. Briefly, 1 g of feces added to 20 ml of sterile saline was shaken vigorously for 30 min and then allowed to settle for 30 min at room temperature. Five ml of the surface fluid was transferred to a new 50 ml tube containing 20 ml of 0.75% hexadecylpyridinium chloride made up in half-strength brain heart infusion broth and incubated at 37°C overnight. After centrifugation at 900 × g for 30 min, the supernatant was discarded, and the pellet was resuspended in 1 ml of a solution of antibiotics (50 µg/ml vancomycin, 50 µg/ml nalidixic acid and 50 µg/ml amphotericin B). After incubation at 37°C for 48 hr, 0.1 ml aliquot of the prepared fecal sediment was inoculated into 2 Middlebrook 7H10 solid medium slants and 2 MGIT Para TB liquid medium culture tubes. Cultures in MGIT medium were incubated at 37°C for 12 weeks (84 days), and the fluorescence emission was monitored at least once a week. For confirmation of MAP growth, DNA templates were prepared using the ‘Boiling’ method described above and tested by QPCR. In case MAP was identified only from MGIT culture, MGIT positive tubes were subcultured onto solid culture slants to confirm bacterial growth on solid media.
Statistical analysis: Mean Cp values between each DNA harvesting method and control (TE buffer) were compared by a t-test. A McNemar’s test was used to compare the results for the isolation of MAP between solid and liquid culture media, and a kappa value was calculated to assess the agreement of the results (http://graphpad.com/quickcalcs/). Differences in DNA quantities detected by the direct fecal QPCR assay for the result of fecal culture were evaluated by a Kruskal-Wallis test with multiple comparisons using a Dunn’s post hoc test. The relationship between the DNA quantity detected in the direct fecal QPCR test and the time for detection in the manual fluorescent MGIT Para TB system was assessed by nonlinear regression among 38 samples that were positive in MGIT culture.
RESULTS
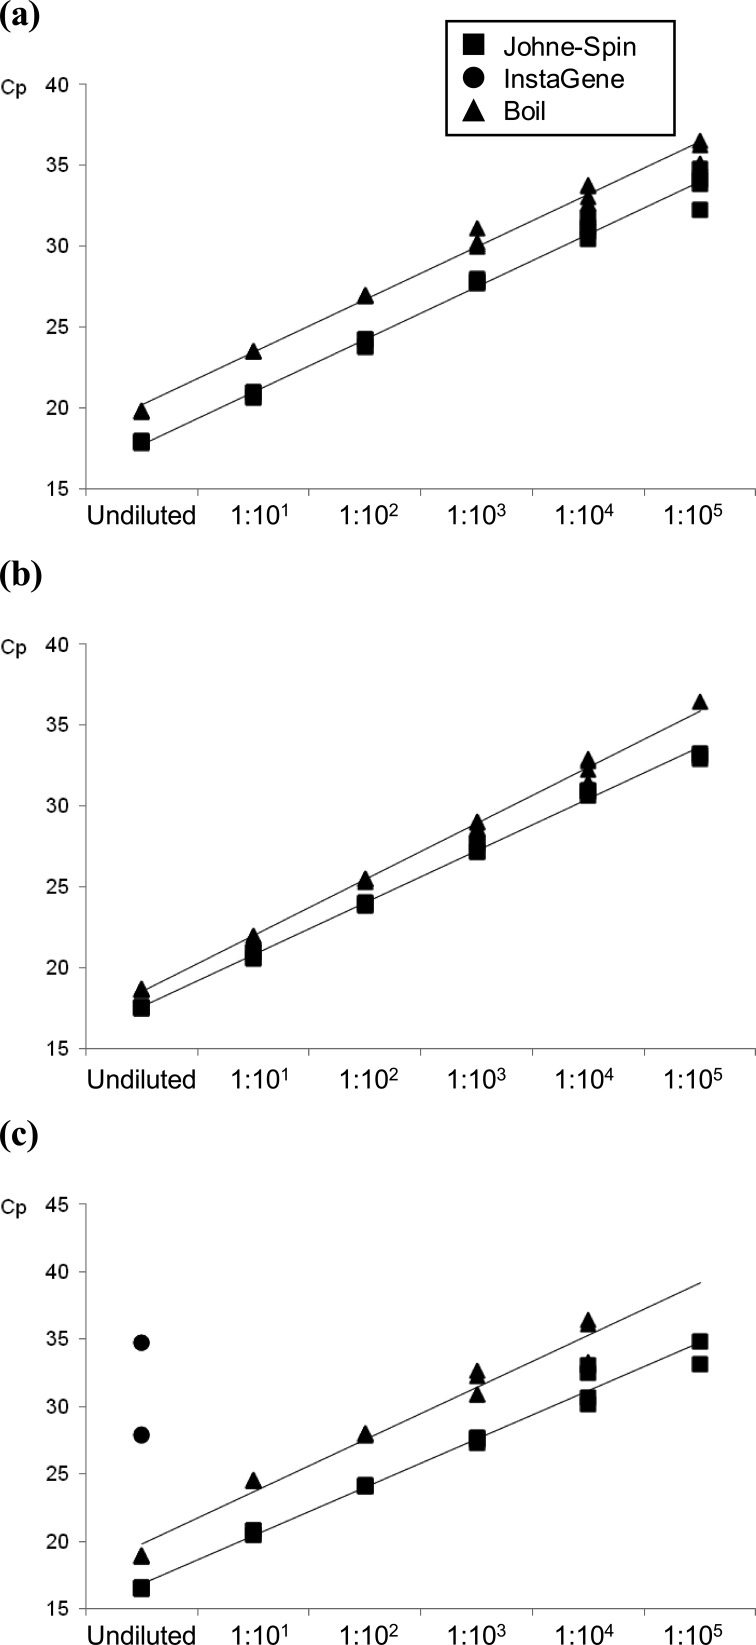
Comparison of DNA harvesting methods for QPCR confirmation of MAP growth: Three DNA extraction methods summarized in Table 1 were compared for molecular confirmation of MAP in MGIT culture. The crossing point (Cp) values in QPCR for each DNA sample harvested from MGIT culture broth of MAP strains and a positive fecal sample by the 3 DNA extraction methods are shown in Fig. 2. Compared to the mean Cp values for DNA extracted by Johne-Spin, they were delayed by 2.43 (K10), 1.52 (Telford) and 3.48 (positive feces) cycles for DNA samples harvested by the boil method (Fig. 2). Except for DNA samples from undiluted MGIT culture of positive feces, QPCR results were all negative when DNA was harvested using InstaGene.
Fig. 2.
Comparison of three DNA extraction methods for detection of MAP in MGIT culture by QPCR. (a) C-strain (K10), (b) S-strain (Telford) and (c) positive feces from experimentally inoculated cattle.
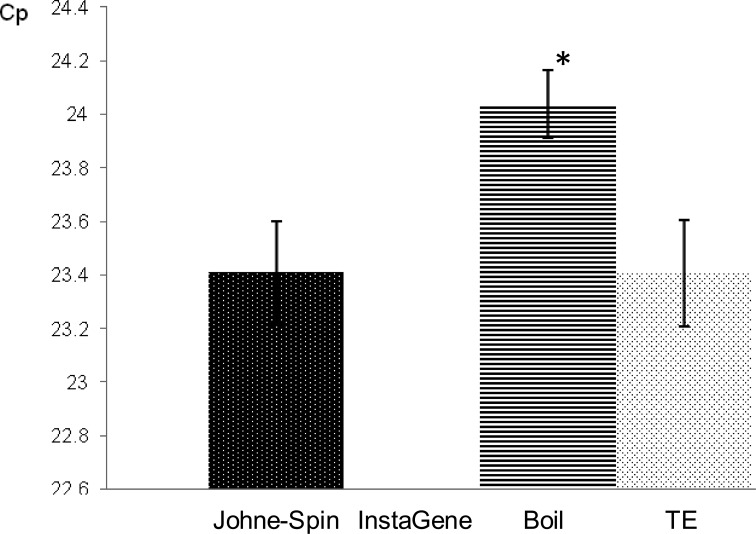
The mean Cp for amplification of 1 pg of MAP genomic DNA mixed with DNA template extracted from control MGIT broth by Johne-Spin was similar to that of MAP DNA with TE buffer, while it was significantly delayed by an average of 0.63 cycles when DNA harvested by the boil method was added (Fig. 3). One pg of MAP DNA was not amplified within 45 cycles when it was mixed with a DNA sample prepared using InstaGene.
Fig. 3.
Inhibition of PCR analytical sensitivity for amplification of 1 pg of MAP genomic DNA. *Indicates the mean Cp was significantly different (P<0.01) compared to that in control (TE buffer).
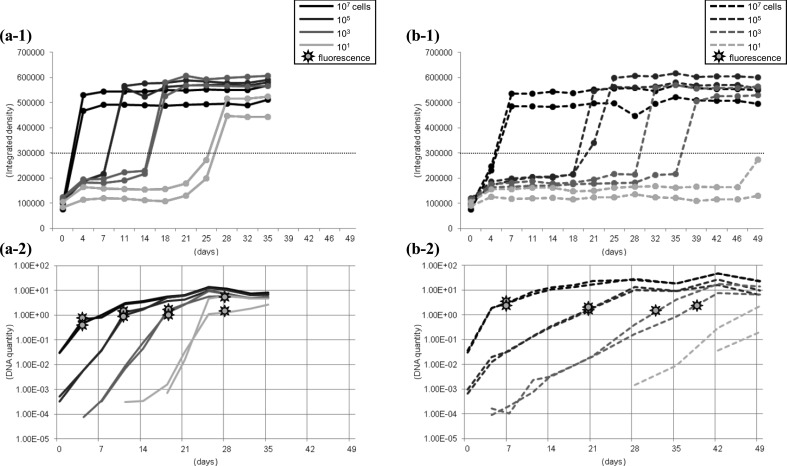
Growth of C and S strains of MAP in the manual MGIT system: Growth and detection of MAP in the manual MGIT system combined with the boil method for DNA harvesting followed by QPCR were evaluated using pure cultures of C and S strains (Fig. 4). Growth of C strain in the MGIT medium occurred quickly, and fluorescence was detected after 4 weeks of incubation when 101 cells of the C strain were inoculated (a-1). The S strain required more time to grow particularly in the lower inoculum size (b-1). When 101 cells of the S strain were inoculated, the integrated density did not reach the positive level within 49 days of incubation (b-1), although MAP DNA was increasing in the culture broth at that time (b-2). MAP DNA was detected by QPCR about 2 weeks and more than 3 weeks before detection of the fluorescence for culturing C and S strains of MAP, respectively (a-2 and b-2). Regardless of the starting quantity of MAP or the inoculum strain, approximately 2 pg of MAP DNA was detected in 2.5 µl of the DNA sample at the time of fluorescence positive: it can be estimated that there were at least 1.6 × 10⁵ cells/ml in the MGIT medium.
Fig. 4.
Growth and detection of C (a) and S (b) strains of MAP in the manual MGIT system combined with the boil method for DNA harvesting followed by QPCR. (a-1 and b-1) fluorescence, (a-2 and b-2) DNA quantity.
Detection of ‘live’ MAP in QPCR positive bovine feces by the manual MGIT system: A total of 61 direct fecal QPCR positive samples were cultured in the MGIT system and on 7H10 slopes (Table 2). MAP growth was confirmed in 38 fecal samples (62.3%) cultured using the MGIT system, while MAP was isolated from 27 feces (44.3%) by 7H10 solid slants. The sensitivity of fecal culture in the MGIT system was significantly higher than that on 7H10 slants (McNemar’s χ2=4.76, P<0.05), although there were 5 samples that the result of fecal culture was positive only by the solid media (Table 2). In total, MAP was isolated from 43 of 61 fecal QPCR positive feces (70.5%). MAP DNA quantities contained in the fecal samples that were culture positive in both liquid and solid media were significantly higher than those in either liquid or solid culture positive feces and culture negative feces (Table 2). In all the fecal samples from which MAP was isolated only by the MGIT system (n=16), MAP growth was confirmed on the 7H10 solid media after subculturing the MGIT culture broth. The average incubation time for positive samples in the MGIT system was 30.5 days, although 5 of them required more than 50 days of incubation to detect fluorescence. It took 2.5 to 5 months to confirm MAP colonies on the solid media.
Table 2. Fecal culture by MGIT Para TB compared to solid media for the 61 direct fecal QPCR positive samples.
| MGIT |
Total | |||
|---|---|---|---|---|
| No. +ve | No. -ve | |||
| (median DNA quantity (pg) in direct fecal QPCR*) | ||||
| 7H10 | No. +ve | 22 | 5 | 27 |
| (5.72E–02 a) | (8.31E–04 b) | |||
| No. –ve | 16 | 18 | 34 | |
| (1.30E–03 b) | (5.69E–04 b) | |||
| Total | 38 | 23 | 61 | |
Kappa value=0.33, McNemar’s χ2=4.76, P<0.05. * Different letters indicate differences in a Kruskal-Wallis test with post hoc multiple comparisons (P<0.05).
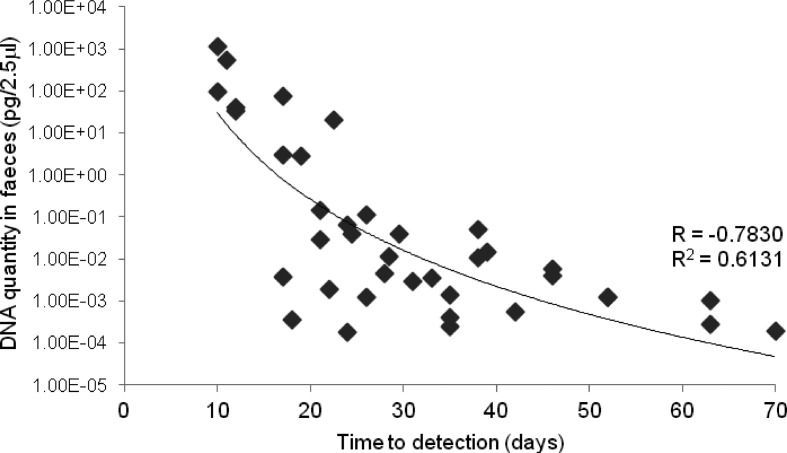
Among 38 samples that were positive in the MGIT system, there was a significant relationship between the DNA quantity detected in the direct fecal QPCR assay and the time to detect fluorescence in MGIT cultures (Fig. 5).
Fig. 5.
The relationship between the DNA quantity in feces and the time to detection by MGIT culture (n=38).
DISCUSSION
In this study, an efficient protocol for the MGIT culture system using manual fluorescence detection combined with rapid confirmation of MAP growth in the broth culture was established. The system was evaluated for the detection of viable MAP in direct QPCR positive bovine feces by comparison with a conventional fecal culture method on solid medium.
As manually or automatically detected fluorescence in the MGIT culture tube does not prove growth of MAP, subculturing on solid media for demonstration of mycobactin dependency or molecular confirmation is necessary for identification of MAP in the sample. For rapid confirmation, harvesting DNA from broth culture followed by detection of MAP specific genes by PCR is commonly applied. However, DNA sample preparation from liquid media often requires removal of egg yolk which inhibits PCR amplification. It has been shown that direct addition of unprocessed MGIT culture broth to the PCR reaction mixture resulted in an extended Cp value and a low sensitivity in the QPCR analysis [19]. Simple methods for DNA extraction from broth cultures using ethanol [23] or by boiling [19] have already been reported, although primers and/or the target DNA of the PCR procedure was different from the present study. In this study, three methods of harvesting DNA from MGIT culture media were compared, and the effect of residual PCR inhibitors was seen for the boil method as delayed Cp values in the QPCR assay (Fig. 3). Such effect was not observed in the DNA samples harvested using Johne-Spin, suggesting that inhibitors of the PCR reaction in the broth culture could be removed. For detection of MAP in MGIT culture, the DNA sample extracted by Johne-Spin always had lower Cp values compared with the boil method, suggesting that those samples had a greater quantity of target DNA and/or less PCR inhibitor (Fig. 2). The QPCR results also suggested that InstaGene was unsuitable for DNA extraction from MGIT cultures.
Although the quality and quantity of the DNA sample prepared using Johne-Spin seemed to be adequate, there are still sufficient reasons to employ the boil method for DNA harvesting from broth culture. The boil method was an inexpensive and time- and labor-saving DNA preparation method for confirmation of MAP growth in the MGIT medium by QPCR [19]. In this study, DNA samples prepared by the boil method were positive in QPCR few weeks before detection of fluorescence, suggesting that the boil method can be useful at least at the time when cultures become fluorescence positive, where massive amounts of MAP DNA should be present in the MGIT tube.
One advantage of employing the MGIT system is that MGIT culture tubes can be read manually using a UV transilluminator, which most laboratories already have. An automated MGIT reader, the BACTEC MGIT 960 Mycobacterial Detection System, is available from the manufacture, but the price of this instrument would be prohibitive for many of the veterinary and clinical laboratories in Japan. It has been demonstrated that detection time and recovery rates for mycobacteria were comparable between the manual and automated MGIT systems [16]. Another study confirmed that no statistical difference in recorded detection time was observed in the manual reading of MGIT tubes by three individual readers [6]. However, a contradictory result has also been reported, which is that the manual MGIT system was less sensitive and time consuming compared to the automated system [7]. In this study, manually detected fluorescence emissions from MIGT cultures were measured and analyzed objectively by use of ImageJ. The time to detection data for the C strain of MAP (K-10) recorded by the manual MGIT system in the present study seemed to be comparable to the universal standard curve for quantification of bovine and human isolates of MAP in the automated MGIT system demonstrated by Shin et al. [15].
Vancomycin was not included in the MGIT medium for culturing the S strain in this study due to its negative effect on growth [7]. The detection time for culturing a laboratory adapted S strain (Telford 9.2) in the MGIT system was improved; the time to detection for 1.0 × 10³ cells of the S stain was less than 40 days in the present study, while it took 63 days to detect the growth of 2.3 × 10³ cells in the MGIT system with vancomycin [7]. Nevertheless, the S strain of MAP in the MGIT system required a prolonged incubation relative to the C strain. Similar results that S-type strains isolated from sheep and goats tended to grow slower than the C-type (strain K-10) in the MGIT system have been reported [1]. Interestingly, C- and bison (B)-types of MAP strains isolated from sheep also required longer incubation times compared to those from cattle, goats and wildlife animals [1]. The correlation between genotype and growth in the MGIT system for the ovine isolates is still unclear.
The manual MGIT system showed significantly higher sensitivity for isolation of MAP from bovine feces compared to 7H10 agar-based slants. All the MAP isolates detected by the liquid culture alone grew on the solid media after subculturing the MGIT culture broth, suggesting a role for the MGIT culture system as an enrichment medium. However, in some feces, the result of fecal culture was positive only by the solid media. A contradictory result between the culture methods was observed in bovine feces which contained lower numbers of MAP, explained by non-homogeneous distribution or clumping of the bacteria. The isolation rate of ‘live’ MAP would be improved by using both liquid and solid cultures when the result of fecal QPCR suggests a low MAP DNA content in the fecal sample. Alternatively, employment of more replicates of the MGIT tubes would also increase the sensitivity of fecal culture. In this study, ‘live’ MAP was recovered from 70% of the direct fecal QPCR positive samples when both MGIT Para TB medium and 7H10 agar slants were used.
As expected, the time to obtain a final result of fecal culture by the MGIT system was several weeks earlier than the time to confirm MAP colonies on solid media. According to the protocol provided by the manufacturer, the incubation time to declare the positive/negative result is 49 days using an automated MGIT instrument. However, longer incubation time (>49 days) was required in some fecal samples in this study. The maximum incubation time in culture positive feces was 70 days (10 weeks), suggesting that reporting the fecal sample as culture negative would be possible at>70 days of incubation at least in the manual MGIT Para TB system. This should be confirmed in another study using more fecal samples which contain low numbers of MAP.
In MGIT culture positive samples, the time to detect fluorescence in the MGIT system was correlated with the DNA quantity detected in the direct fecal QPCR assay (r= −0.78). A similar correlation coefficient (r= −0.70) was obtained previously using BACTEC radiometric culture and the fecal QPCR in ovine feces [8]. Instead of counting the number of colonies on solid media, the starting number of viable organisms can be determined from the time to detection data in liquid media [14, 15]. It has been shown that the estimation of initial bacillary load by using the time to detection in the MGIT system was accurate and highly reproducible in pure cultures of MAP strains [15]. However, the time to detection in fecal culture with MGIT may be influenced by other factors: contribution to the time to signal positive by growth of irrelevant microbes in feces and potential loss of viable MAP through the decontamination procedure [13].
It has been suggested that quantification of MAP DNA in feces by QPCR possibly provides immediate information to estimate the risk of transmission from infected animals [8, 9]. However, a PCR-based test detects the entire target DNA regardless of the bacterial viability, and therefore, the number of viable MAP in a sample cannot be estimated from the DNA quantity detected in the QPCR test. A follow-up test by fecal culture needs to be conducted, especially when a relatively small amount of MAP DNA is detected by fecal QPCR, to confirm if the animal is shedding ‘live’ MAP and serves as a source of infection. For this purpose, the sensitivity of fecal culture is critical. As suggested previously by Whittington [21], our study also confirmed that the sensitivity of fecal culture would drop, if solid medium alone was used for primary culture.
In conclusion, rapid confirmation of MAP growth in the MGIT system would be possible by the boil method of DNA harvesting followed by the QPCR assay. For detection of MAP shedders in animals which were positive in the direct fecal QPCR test, the manual MGIT system showed significantly higher sensitivity compared with 7H10 agar-based slants.
ACKNOWLEDGMENTS
This study was supported by a grant-in-aid of the regulatory science project (#2307) of the Ministry of Agriculture, Forestry and Fisheries of Japan. Dr. Richard Whittington (Faculty of Veterinary Science, The University of Sydney, Australia) is gratefully acknowledged for providing a sheep strain of MAP (Telford 9.2) and useful comments on a draft of the manuscript. Dr. Sota Kobayashi (Viral Disease and Epidemiology Research Division, National Institute of Animal Health, Japan) is also appreciated for helpful suggestions for the statistical analysis.
REFERENCES
- 1.Abendaño N., Sevilla I., Prieto J. M., Garrido J. M., Juste R. A., Alonso-Hearn M.2012. Quantification of Mycobacterium avium subsp. paratuberculosis strains representing distinct genotypes and isolated from domestic and wildlife animal species by use of an automatic liquid culture system. J. Clin. Microbiol. 50: 2609–2617. doi: 10.1128/JCM.00441-12 [DOI] [PMC free article] [PubMed] [Google Scholar]
- 2.Chiodini R. J., Van Kruiningen H. J., Merkal R. S.1984. Ruminant paratuberculosis (Johne’s disease): the current status and future prospects. Cornell Vet. 74: 218–262 [PubMed] [Google Scholar]
- 3.Collins M. T., Kenefick K. B., Sockett D. C., Lambrecht R. S., McDonald J., Jorgensen J. B.1990. Enhanced radiometric detection of Mycobacterium paratuberculosis by using filter-concentrated bovine fecal specimens. J. Clin. Microbiol. 28: 2514–2519 [DOI] [PMC free article] [PubMed] [Google Scholar]
- 4.Damato J. J., Collins M. T.1990. Growth of Mycobacterium paratuberculosis in radiometric, Middlebrook and egg-based media. Vet. Microbiol. 22: 31–42. doi: 10.1016/0378-1135(90)90122-C [DOI] [PubMed] [Google Scholar]
- 5.Fyock T. L., Sweeney R. W., Whitlock R. H.2005. MGIT, liquid culture system for detection of MAP in bovine fecal samples. p. 554. In: Proceedings of the Eighth International Colloquium on Paratuberculosis. Copenhagen, Denmark: International Association for Paratuberculosis, Inc.
- 6.Grant I. R., Kirk R. B., Hitchings E., Rowe M. T.2003. Comparative evaluation of the MGIT and BACTEC culture systems for the recovery of Mycobacterium avium subsp. paratuberculosis from milk. J. Appl. Microbiol. 95: 196–201. doi: 10.1046/j.1365-2672.2003.02003.x [DOI] [PubMed] [Google Scholar]
- 7.Gumber S., Whittington R. J.2007. Comparison of BACTEC 460 and MGIT 960 systems for the culture of Mycobacterium avium subsp. paratuberculosis S strain and observations on the effect of inclusion of ampicillin in culture media to reduce contamination. Vet. Microbiol. 119: 42–52. doi: 10.1016/j.vetmic.2006.08.009 [DOI] [PubMed] [Google Scholar]
- 8.Kawaji S., Taylor D. L., Mori Y., Whittington R. J.2007. Detection of Mycobacterium avium subsp. paratuberculosis in ovine faeces by direct quantitative PCR has similar or greater sensitivity compared to radiometric culture. Vet. Microbiol. 125: 36–48. doi: 10.1016/j.vetmic.2007.05.002 [DOI] [PubMed] [Google Scholar]
- 9.Kawaji S., Begg D. J., Plain K. M., Whittington R. J.2011. A longitudinal study to evaluate the diagnostic potential of a direct faecal quantitative PCR test for Johne’s disease in sheep. Vet. Microbiol. 148: 35–44. doi: 10.1016/j.vetmic.2010.07.022 [DOI] [PubMed] [Google Scholar]
- 10.Kudahl A. B., Ostergaard S., Sorensen J. T., Nielsen S. S.2007. A stochastic model simulating paratuberculosis in a dairy herd. Prev. Vet. Med. 78: 97–117. doi: 10.1016/j.prevetmed.2006.05.015 [DOI] [PubMed] [Google Scholar]
- 11.Mori Y., Nagata R., Yoshihara K., Kawaji S., Minegishi Y., Nishikawa T., Haraguchi H.2012. Efficient DNA extraction and purification for sensitive detection of Mycobacterium avium subsp. paratuberculosis in bovine faeces and tissues. p. 54. In: Proceedings of the Eleventh International Colloquium on Paratuberculosis. Sydney, Australia: International Association for Paratuberculosis, Inc.
- 12.Motiwala A. S., Strother M., Theus N. E., Stich R. W., Byrum B., Shulaw W. P., Kapur V., Sreevatsan S.2005. Rapid detection and typing of strains of Mycobacterium avium subsp. paratuberculosis from broth cultures. J. Clin. Microbiol. 43: 2111–2117. doi: 10.1128/JCM.43.5.2111-2117.2005 [DOI] [PMC free article] [PubMed] [Google Scholar]
- 13.Reddacliff L. A., Vadali A., Whittington R. J.2003. The effect of decontamination protocols on the numbers of sheep strain Mycobacterium avium subsp. paratuberculosis isolated from tissues and faeces. Vet. Microbiol. 95: 271–282. doi: 10.1016/S0378-1135(03)00181-0 [DOI] [PubMed] [Google Scholar]
- 14.Reddacliff L. A., Nicholls P. J., Vadali A., Whittington R. J.2003. Use of growth indices from radiometric culture for quantification of sheep strains of Mycobacterium avium subsp. paratuberculosis. Appl. Environ. Microbiol. 69: 3510–3516. doi: 10.1128/AEM.69.6.3510-3516.2003 [DOI] [PMC free article] [PubMed] [Google Scholar]
- 15.Shin S. J., Han J. H., Manning E. J. B., Collins M. T.2007. Rapid and reliable method for quantification of Mycobacterium paratuberculosis by use of the BACTEC MGIT 960 system. J. Clin. Microbiol. 45: 1941–1948. doi: 10.1128/JCM.02616-06 [DOI] [PMC free article] [PubMed] [Google Scholar]
- 16.Shitaye E. J., Beran V., Svobodova J., Moravkova M., Babak V., Pavlik I.2009. Comparison of the conventional culture, the manual fluorescent MGIT system and the automated fluorescent MGIT 960 culture system for the detection of Mycobacterium avium ssp. avium in tissues of naturally infected hens. Folia Microbiol. (Praha) 54: 137–141. doi: 10.1007/s12223-009-0020-y [DOI] [PubMed] [Google Scholar]
- 17.Stabel J. R.1997. An improved method for cultivation of Mycobacterium paratuberculosis from bovine fecal samples and comparison to three other methods. J. Vet. Diagn. Invest. 9: 375–380. doi: 10.1177/104063879700900406 [DOI] [PubMed] [Google Scholar]
- 18.Stabel J. R.1998. Johne’s disease: a hidden threat. J. Dairy Sci. 81: 283–288. doi: 10.3168/jds.S0022-0302(98)75577-8 [DOI] [PubMed] [Google Scholar]
- 19.Sweeney R. W., Whitlock R. H., McAdams S. C.2006. Comparison of three DNA preparation methods for real-time polymerase chain reaction confirmation of Mycobacterium avium subsp. paratuberculosis growth in an automated broth culture system. J. Vet. Diagn. Invest. 18: 587–590. doi: 10.1177/104063870601800611 [DOI] [PubMed] [Google Scholar]
- 20.Thomas G., Manning E. J. B., Collins M. T.2005. Comparison of BACTEC and MGIT systems for detection of M. paratuberculosis p. 579. In: Proceedings of the Eighth International Colloquium on Paratuberculosis. Copenhagen, Denmark: International Association for Paratuberculosis, Inc.
- 21.Whittington R. J.2009. Factors affecting isolation and identification of Mycobacterium avium subsp. paratuberculosis from fecal and tissue samples in a liquid culture system. J. Clin. Microbiol. 47: 614–622. doi: 10.1128/JCM.01986-08 [DOI] [PMC free article] [PubMed] [Google Scholar]
- 22.Whittington R. J., Reddacliff L. A., Marsh I., McAllister S., Saunders V.2000. Temporal patterns and quantification of excretion of Mycobacterium avium subsp. paratuberculosis in sheep with Johne’s disease. Aust. Vet. J. 78: 34–37. doi: 10.1111/j.1751-0813.2000.tb10355.x [DOI] [PubMed] [Google Scholar]
- 23.Whittington R. J., Marsh I., Turner M. J., McAllister S., Choy E., Eamens G. J., Marshall D. J., Ottaway S.1998. Rapid detection of Mycobacterium paratuberculosis in clinical samples from ruminants and in spiked environmental samples by modified BACTEC 12B radiometric culture and direct confirmation by IS900 PCR. J. Clin. Microbiol. 36: 701–707 [DOI] [PMC free article] [PubMed] [Google Scholar]


