

Abstract
Face pareidolia is the illusory perception of non-existent faces. The present study, for the first time, contrasted behavioral and neural responses of face pareidolia with those of letter pareidolia to explore face-specific behavioral and neural responses during illusory face processing. Participants were shown pure-noise images but were led to believe that 50% of them contained either faces or letters; they reported seeing faces or letters illusorily 34% and 38% of the time, respectively. The right fusiform face area (rFFA) showed a specific response when participants “saw” faces as opposed to letters in the pure-noise images. Behavioral responses during face pareidolia produced a classification image that resembled a face, whereas those during letter pareidolia produced a classification image that was letter-like. Further, the extent to which such behavioral classification images resembled faces was directly related to the level of face-specific activations in the right FFA. This finding suggests that the right FFA plays a specific role not only in processing of real faces but also in illusory face perception, perhaps serving to facilitate the interaction between bottom-up information from the primary visual cortex and top-down signals from the prefrontal cortex (PFC). Whole brain analyses revealed a network specialized in face pareidolia, including both the frontal and occipito-temporal regions. Our findings suggest that human face processing has a strong top-down component whereby sensory input with even the slightest suggestion of a face can result in the interpretation of a face.
Keywords: face processing, fMRI, fusiform face area, top-down processing, face pareidolia
1. Introduction
Illusory sensory perception, or ‘pareidolia,’ is common. It occurs when external stimuli trigger perceptions of non-existent entities, reflecting erroneous matches between internal representations and the sensory inputs. Pareidolia is thus ideal for understanding how the brain integrates bottom-up input and top-down modulation. Among all forms of pareidolia, face pareidolia is the best recognized: individuals often report seeing a face in the clouds, Jesus in toast, or the Virgin Mary in a tortilla. Face pareidolia suggests that our visual system is highly tuned to perceive faces, likely due to the social importance of faces and our exquisite ability to process them.
Despite the fact that face pareidolia has been a well-documented phenomenon for centuries, little is known about the underlying neural mechanisms. Recent behavioral and functional imaging studies using a reverse correlation method have provided some intriguing insights about how face pareidolia might emerge. These studies have demonstrated that the internal representation of faces underlying face pareidolia can be reconstructed experimentally based on behavioral responses (Gosselin & Schyns, 2003; Rieth, Lee, Lui, Tian & Huber, 2011; Smith, Gosselin, & Schyns, 2012) or on brain activities measured by EEG (Hansen, Thompson, Hess, & Ellemberg, 2010) and fMRI (Nestor, Vettel, & Tarr, 2012). For example, in Gosselin and Schyns’ (2003) study, participants were instructed to detect a face from pure-noise images where, in fact, no face images existed. A face-like structure emerged in the classification image (CI) which was obtained by subtracting the pure-noise images to which participants failed to detect faces (no-face response) from those that participants claimed to have seen faces (face response). Using a similar experimental paradigm, Hansen et al. (2010) rendered a face-like structure not only based on behavioral responses but also from event related potential (ERP) responses. These findings suggest that face pareidolia is not purely imaginary; rather, it has a basis in physical reality. However, because the images do not actually contain faces, face pareidolia clearly requires substantial involvement of the brain’s interpretive power to detect and bind the faint face-like features to create a match with an internal face representation.
Recently, a few functional imaging studies have begun to explore brain regions involved in face pareidolia in abnormal individual (e.g., Iaria, G., Fox, C. J., Scheel, M., Stowe, R. M., & Barton, 2010) and normal individuals (e.g., Zhang, Liu, Huber, Rieth, Tian, & Lee, 2008; Li, Liu, Liang, Zhang, Zhao, Huber, et al., 2009). For example, Iaria and colleagues (2010) found that a patient with a schizoaffective history and a past of abusing lysergic acid diethylamide (LSD) and marijuana regularly showed decreased activity in his FFA when he claimed to see faces on trees. However, as the only healthy participant in Iaria et al.’s study could not generate the face pareidolia as the patient did, it is unclear whether the patient’s decrease in FFA activity during the experience of face pareidolia was due to his history of schizoaffective disorder or drug abuse and therefore it may not reflect the neural activity patterns among healthy individuals when they experience face pareidolia. Additionally, a recent fMRI study (Hadjikhani, del Rio, Wu, Schwartz, Bakker, Fischl, et al., 2001) found that when migraine patients experienced visual hallucination, known as a migraine aura, a change in time course of BOLD response was observed in the occipital cortex. This aura-related change was initiated in extrastriate cortex (V3A) and then spread to other regions of the visual cortex. Although such aura typically takes on “scintillating, shining, crenelated shapes” (Hadjikhani et al., 2001) rather than a face, these findings suggest that the neural responses of the visual cortex may be modulated by pareidolia.
In contrast to those findings from Iaria et al (2010) and Hadjikhani et al. (2001), some studies of normal participants revealed an enhanced brain response to illusory face detection. For example, Smith et al. (2012) revealed an enhanced EEG record elicited by face response relative to no face response over the frontal and occipitotemporal cortexes, with the former occurring prior to the latter. In agreement with Smith et al. (2012), Zhang et al. (2008) used a similar experimental paradigm but with fMRI methodology, and identified a network of brain regions showing greater activations when face pareidolia occurred, most notably in the fusiform face area or FFA (Kanwisher & Yovel, 2006) and in the inferior frontal gyrus (IFG). It was suggested that these cortical regions might play a crucial role in face pareidolia, perhaps by serving to integrate bottom-up signals and top-down modulations.
However, because neither Smith et al. (2012) nor Zhang et al. (2008) included a crucial condition assessing pareidolia of non-face objects, it is entirely unclear whether their neuroimaging findings elicited by illusory face perception are indeed specific to face pareidolia or the pareidolia of any visual object. For example, although converging evidence has demonstrated that the FFA shows increased response to faces than to other objects (Kanwisher & Yovel, 2006), its selectivity in face processing is of great controversy (Gauthier, Tarr, Anderson, Skudlarski, & Gore, 1999; Gauthier, Skudlarski, Gore, & Anderson, 2000a; Grill-Spector, Knouf, & Kanwisher, 2004; Grill-Spector, Sayres, & Ress, 2006; Tar & Gauthier, 2000). A recent study using high-resolution fMRI revealed that the FFA identified using traditional methods also includes clusters showing response to non-face objects (Grill-Spector et al., 2006). Further, the FFA is also known to be activated by non-face objects with which we have expertise (Gauthier et al., 1999, 2000a). Moreover, recent studies have reported that the inferior frontal gyrus (IFG) was also involved in the pareidolia of non-face objects with which we have expertise (letters, Liu, Li, Zhang, Rieth, Huber, Li, et al., 2010), the location of which was highly consistent with that for face pareidolia identified by Zhang et al. (2008). Thus, due to the lack of direct comparison of face versus non-face pareidolia, it is unclear whether the FFA and its associated cortical network (e.g., IFG) identified in the existing studies are specifically involved in face pareidolia (the face specificity hypothesis) or in the pareidolia of any objects with which we have processing expertise (the object expertise hypothesis).
The present study aims to bridge this important gap in the literature and to test these hypotheses. We, for the first time, directly compare the neural responses of face pareidolia to that of non-face object (letter) pareidolia. Specifically, we explore the specific role that the FFA plays in face pareidolia. In the present study, participants were instructed to detect faces from pure-noise images in the face condition, and letters from the same pure-noise images in the letter condition. To ensure that face or letter pareidolia really occurred, we used a reverse correlation method similar to that used by Hansen et al. (2010) to obtain classification images based on behavioral responses (face or no face response in the face condition and letter or no letter response in the letter condition). Hansen et al. (2010) have demonstrated that the frequency spectrum of the CI containing a face-structure was significantly correlated with that of a noise image in which an average face was embedded. However, because Hansen et al. (2010) did not instruct participants to detect non-face objects from pure noise images, the extent to which the frequency spectrum of their behavioral CI is indeed specific to faces remains unclear. The present study addressed this issue by asking participants to detect faces or letters in the same pure noise images. We then constructed behavioral CIs based on participants’ behavioral responses in either the face detection task or the letter detection task and compared the two CIs to determine whether there indeed exists face- or letter-specific behavioral CIs.
Second, we explored the role the FFA played in face pareidolia by examining the response patterns of the FFA, as well as those of the letter-preferential regions, when face pareidolia or letter pareidolia occurred. We correlated the behavioral CIs obtained in the face or letter detection tasks with neural responses in the FFA and letter-preferential regions to examine whether participants’ behavioral face or letter CIs were predictive of their neural responses in these cortical regions.
Finally, by comparing the neural network activated when an illusory face was ‘detected’ with that activated when a letter was ‘detected’, the neural correlates specific to face pareidolia are revealed.
2. Materials and Methods
2.1. Participants
Twenty right-handed, healthy Chinese individuals (11 males, age: 18–25) with normal or corrected-to-normal vision participated in this study after giving their informed consent. All participants had lived in China their whole lives and had at least 10 years of experience reading and writing Roman letters. The Human Research Protection Program of Tiantan Hospital, Beijing, China, approved this study.
2.2. Stimuli
Five types of stimuli were used: easy-to-detect faces (Fig. 1A), hard-to-detect faces (Fig. 1B), easy-to-detect letters (Fig. 1C), hard-to-detect letters (Fig. 1D), and pure-noise images (Fig. 1E).
Figure 1.

Examples of stimuli used in the experiment. (A) easy-to-detect face, (B) hard-to-detect face, (C) easy-to-detect letter, (D) hard-to-detect letter, (E) pure-noise image, (F) checkerboard image.
Figure 2 shows how the pure-noise images were produced. To create the pure-noise images bivariate Gaussian blobs with different standard deviations (SD) were randomly combined and uniformly spaced. Three standard deviation (SD) scales were used for the Gaussian blobs, namely SD = 64, 256, and 1024 pixels. Each scale produced different Gaussian blobs. By randomly positioning the Gaussian blobs within a corresponding spatial scale, three 480-by-480 pixel maps were created for the three SDs, respectively. After multiplying each by different weights, the three maps were combined (i.e., simple addition of the maps) to create one 480-by-480-pixel image:
| (1) |
Figure 2.

Illustration of production of the pure-noise images.
Where m1, m2 and m3 denote the maps composed of Gaussian blobs with SD = 64, 256, and 1024, respectively. In the present study, we use the noise images which were produced by overlapping the random-positioned bivariate Gaussian blobs with SDs of 64, 256, and 1024 in order to reliably generate the face pareidolia and letter pareidolia, respectively. The reason that we used Gaussian blobs with multiple SDs to create complex random noise images was that existing behavioral studies using this method reliably induced face or letter paradolia at about 35% of the time (Rieth et al., 2011; Liu et al., 2010). Pilot testing also showed that illusory detections of faces or letters substantially decreased when simple random noise images were used, resulting in too few illusory trials for meaningful data analyses.
A pure-noise image was then obtained by linearly transforming M into a 256 gray scale with the smallest intensity of M given a value of 255 (white) and the largest intensity given a value of 0 (black). Using the same method, 480 different 480-by-480 pixel pure-noise images were produced.
The face-noise images, which consisted of both easy- and hard-to-detect face images (Fig. 1A&B, respectively), were created from 20 gray Asian face photos (10 males). The true-face images had a resolution of 480-by-480 pixels and contained a centered front-view and neutral-expression face. Each face-noise image (FN) was obtained by blending one true image with one pure-noise image:
| (2) |
| (3) |
where A.* B and A. / B denote element-to-element multiplication and division of matrix A and B, respectively. λ denotes the blending parameter and is equal to 0.3 for easy-to-detect face images and 0.9999997 for hard-to-detect face images. NI and TF denote a pure-noise image and a true-face image, respectively. E is a 480-by-480 pixel matrix with all elements equal to 1. W denotes the bivariate Gaussian blobs centered on the images with a value ranging from 0~1 and a SD of 2,400 for easy-to-detect face images or 109 for hard-to-detect face images. The W can be thought of as a Gaussian window. The pixel-to-pixel product of W and a true-face image (i.e., TF) results in a face that is more visible in the center of the image, but less visible and more blended into the noisy background in the periphery of the image.
The letter-noise images consisted of both easy- and hard-to-detect letters (Fig. 1C&D, respectively) and were created from 9 Arial Roman/English letter images (i.e., a, s, c, e, m, n, o, r, u). A true-letter image was created by centering a black, printed letter on a 480-by-480 pixel image. The letter-noise images (LN) were obtained by blending a true-letter image with a pure-noise image:
| (4) |
where γ denotes the blending parameter and is equal to 0.6 for easy-to-detect letter images and 0.35 for hard-to-detect letter images. NI and TL denote a pure-noise image and a true-letter image, respectively. In the present study, the letter-noise images were used only in the training period. We used them to familiarize participants with the task and to mislead participants to believe that in the subsequently shown pure-noise images there were letters. For this training purpose, we created letter-noise images whereby the letters embedded could be readily detected. However, our pilot testing found that letters with only straight segments (e.g., i or l) were much more difficult to detect than those with curve segments when they were blended with bivariate Gaussian blobs. To ensure the training trials to be easy, we only used the letters with curve segments to produce the letter-noise image. It should be noted that participants were not informed of this procedural manipulation and they were instructed to respond when they had ‘found’ any one of the 26 letters in the noise image.
Additionally, checkerboard-images (Fig. 1F) were used to calculate participants’ baseline hemodynamic response. For all images, a black cross, 12 pixels long in each direction and 2 pixels wide, was overlaid in the middle of an image.
It should be noted that, as indicated by equations (2) and (4), the face-noise images and the letter-noise images were produced using different blending methods. This is due to the fact that people use different diagnostic features to detect faces as opposed to letters. To ensure that the faces or letters were detectable in the easy- and hard-to-detect images, stimulus-type-specific blending methods were used. If the letter-noise images were produced using the same method as that used for the face-noise images, few of them could be detected, and vice versa. More importantly, in the present study, the face-noise images and the letter-noise images were only used in the training period to prepare participants for their participation in the crucial testing period that aimed to elicit pareidolia experimentally. In the testing period, exactly the same pure-noise images were used but participants were asked to detect faces or letters depending on the training they had previously received.
Due to the fact that different blending methods were employed for the face-noise and letter-noise images used in the training period, neural activities during the training periods for these tasks would be not comparable and thus were not scanned.
2.3. Procedure
The experiment consisted of two within-subject tasks: the face task and the letter task. For each participant, the face task and the letter task were conducted in two sessions, separated by one week, and with the order of tasks counter-balanced across participants. Additionally, to identify the face-preferential brain regions (e.g., the FFA), following the face task or the letter task, an independent functional localizer period was run (thus two localizer periods in total).
Each task included a training period and a testing period. The training period of the face task included face-noise images and pure-noise images, and the training period of the letter task included letter-noise images and pure-noise images. However, the testing period of each task only included the pure-noise images that were the same for the face and letter tasks. One of the aims of employing increasing levels of difficulty during the training period was to help participants understand the nature of the task in the testing period. Another motivation was to help participants generate face and letter pareidolias when they were asked to detect “faces” or “letters” from pure-noise images in the testing period. It should be noted that, different from the previous studies that used the reverse correlation method, the present study asked participants to detect faces and letters from the same set of pure-noise images. For this reason, we included an increasingly difficult detection task in the training period to entice participants to believe that faces or letters really were in the pure-noise images in the testing period.
The face task training session consisted of 6 face-detection blocks, each of which consisted of 20 randomly presented task images. Each trial of the training period consisted of a 200-ms fixation crosshair and a 600-ms presentation of the task image (an easy-to-detect, hard-to-detect, or pure-noise image), followed by a blank screen for 1200 ms during which participants would give their response. Between the trials, a checkerboard image with a fixation crosshair was presented to mask any after-effects of the task images.
The task images in the first two blocks consisted of an equal number of easy-to-detect faces and pure-noise images. The task images in the next two blocks consisted of an equal number of hard-to-detect faces and pure-noise images. In the last two blocks of the training period, all of the task images were pure noise images. At the beginning of training period, participants were told that in each block, half of the 20 task images contained faces, and half did not. They were also told that the face would be increasingly difficult to detect and the level of task difficulty (i.e., easy, harder and hardest) were prompted at the beginning of each of the first two blocks, the next two blocks, and the last two blocks, respectively. They were instructed to press corresponding buttons on a response device with their left or right finger (counterbalanced across participants) to indicate whether or not they detected a face in the task image.
After the training period, participants took part in four testing sessions, each of which contained 120 pure-noise images presented in random order. The procedure for these test trials was the same as the last two blocks of the training trials, which only contained pure-noise images. The length of the inter-trial break varied between 2000 ms and 10,000 ms and served as a jitter. At the beginning of each testing session, participants were once again told that half of the images contained faces and the other half did not. They were also prompted that in this session the face was the hardest to detect. They were instructed to decide whether there was any face (not limited into the faces appearing in the training period) in the presented images by pressing corresponding buttons with their left or right finger (counterbalanced across participants).
Finally, the functional localizer period included two localizer sessions, each of which consisted of two 20-s presentations of face, common object, letter, and noise image blocks with 14-s fixation intervals between two adjacent blocks. Each block included 20 trials in which an image was presented for 400 ms followed by a 600 ms blank with visual angle of 11.1° by 11.1°. In each of category-specific block, the image was a grey-scale photo of a frontal face photos with neural expression, a grey-scale photo of a daily object, a black alphabetic letter, or random noise, respectively. Among the 20 trials of each block, the images of two randomly chosen trials contained a white border, which was used as target trial. During each trial, participants were instructed to passively view the image and press the key if the image with white border appeared (Haist, Lee, & Stiles, 2010). This procedure ensured that participants were paying attention during the passive viewing task.
The letter task served as a comparative measure to the face task in order to reveal potential unique networks of brain regions responsive to face pareidolia. For the letter task, the training period was similar to that of the face task except the images containing easy-to-detect faces or hard-to-detect faces were replaced with ones containing easy-to-detect letters or hard-to-detect letters, respectively (Fig. 1). At the beginning of training period, participants were told that in each block, half of the 20 task images contained letters, and half did not. They were also told that the letter would be increasingly difficult to detect and the level of task difficulty (i.e., easy, harder and hardest) were prompted at the beginning of each of the first two blocks, the next two blocks, and the last two blocks, respectively. The participants were instructed to determine whether or not each image contained a letter.
The testing period for the letter task used exactly the same pure noise images as those used in the testing period of the face task. At the beginning of each testing session, participants were once again told that half of the images contained letters and the other half did not. They were also prompted that in this session the letter would be the hardest to detect and were instructed to decide whether there was any of the 26 letters (not limited into the letters appearing in the training period) in the presented images by pressing corresponding buttons with their left or right finger (counterbalanced across participants). Finally, a localizer period, the same as that for the face task, followed the testing period.
Participants were scanned both during the testing period and the functional localizer period of each task.
2.4. fMRI data acquisition
Structural and functional MRI data were collected using a 3.0 T MR imaging system (Siemens Trio, Germany) at Tiantan Hospital. The functional MRI series were collected using a single shot, T2*-weighted gradient-echo planar imaging (EPI) sequence (TR/TE = 2000/30 ms; 32 slices; 4 mm thickness; matrix = 64×64) covering the whole brain with a resolution of 3.75×3.75 mm. High-resolution anatomical scans were acquired with a three-dimensional enhanced fast gradient-echo sequence, recording 256 axial images with a thickness of 1 mm and a resolution of 1×1 mm.
2.5. fMRI data analysis
Spatial preprocessing and statistical mapping were performed with SPM5 software (www.fil.ion.ucl.ac.uk/spm, Friston, Holmes, Worsley, Poline, Frith, & Frackowiak, 1994). The first three scans of each testing session were excluded for signal saturation. After slice-timing correction, spatial realignment and normalization to the MNI152 template (Montreal Neurological Institute), the scans of all sessions were re-sampled into 2×2×2 mm3 voxels, and then spatially smoothed with an isotropic 6 mm full-width-half-maximal (FWHM) smoothing function. The time series of each session was high-pass filtered (high-pass filter = 128 s) to remove low frequency noise possibly containing scanner drift (Friston et al., 1994).
Testing sessions and localizer sessions were analyzed separately using a general linear model (GLM). For each participant, scans of all testing sessions from the face task and the letter task were combined. For the face task testing session, trials were classified according to whether participants responded that they saw a face (face response) or did not see a face (no-face response) when viewing a pure noise image. Similarly, for the letter task testing session, trials were classified according to whether participants responded that they saw a letter (letter response) or did not see a letter (no-letter response) when viewing a pure noise image. This classification resulted in four regressors convolved with the hemodynamic response function (HRF). Movement parameters were used in the GLM as additional regressors to account for movement related artifacts. After participant-specific parameter estimates were computed, a conventional whole-brain analysis was performed at the individual level using contrasts of the face response minus the no-face response, the letter response minus the no-letter response, the face response minus letter response and the reverse contrast. Then, the group result for each contrast was obtained by averaging corresponding individual contrast maps using a random effect analysis.
Next, at the group level, a contrast of the face response minus the letter response (with the mask of the face response minus the no-face response), and the letter response minus the face response (with the mask of the letter response minus the no- letter response) was performed. As demonstrated by Esterman and Yantis (2010), an expectation to see faces was always maintained when the participants were detecting faces from pure-noise images, regardless of whether or not they reported seeing a face. It is thus important to limit the contrast of the face response vs. the letter response within the mask of the face response minus the no-face response and the mask of the letter response minus the no-letter response. This approach reduced the effect of the expectation to see faces or to see letters, respectively. All group results were obtained using a statistical threshold of p< 0.001 (uncorrected) and cluster threshold of k ≥ 12.
The two localizer periods, one following the face task and the other following the letter task, were combined. The face-preferential regions were identified using a conjunction analysis of face minus object and face minus letter and face minus noise contrasts (p< 0.0001, uncorrected). The letter-preferential regions were identified using a conjunction analysis of letter minus object and letter minus face and letter minus noise contrasts (p< 0.05, uncorrected). We used a different statistical threshold to identify face- and letter-preferential regions because the activations elicited by viewing letters as a whole were weaker than those elicited by viewing faces. As a result, when using the threshold of p< 0.0001 to identify the category-preferential regions, no letter-preferential regions would remain. However, when using the threshold of p< 0.05, the face-preferential regions would be too large to be isolated from their adjacent brain regions. For the same reasons, recent studies have identified the category-preferential brain regions using different statistical levels (e.g., p< 0.05 in Heim, Eickhoff, Ischebeck, Friederici, Stephan, & Amunts, 2009; p< 0.001 in Fairhall & Ishai, 2007).
Such face- and letter-preferential regions were defined as regions of interest (ROI), within which the percent signal change (PSC) for each condition of the testing sessions (i.e., face response, no-face response, letter response, and no-letter response) relative to the baseline was calculated using MarsBar software (Brett, Anton, Valabregue, & Poline, 2002). A 2 by 2 repeated ANOVA; task (face task vs. letter task) by detection (reporting seeing a face or a letter vs. reporting not seeing a face or a letter) was performed on the PSC of each ROI (ROI analysis).
3. Results
3.1. Behavioral results
Nine hundred and sixty trials of the testing sessions (480 trials for the face task and 480 trials for the letter task) were classified into four conditions according to participants’ responses when they viewed the pure-noise images, namely the face response and the no-face response when the participants reported ‘seeing’ a face or did not, respectively, and the letter response and the no-letter response when the participants reported ‘seeing’ a letter or did not, respectively.
On average, participants had a mean face-response rate (number of face-responses/480 pure noise images * 100%) of 34.23% (SD = 15.95%), and a mean letter-response rate (number of letter-responses/480 pure noise images * 100%) of 38.27% (SD = 18.40%). These two response rates were not significantly different from each other (t(19) = 1.229, p = 0.234). However, these two rates were significantly correlated (r = 0.642, p = 0.002), indicating that participants who exhibited more letter pareidolia were also more likely to exhibit face pareidolia. This finding underscored the necessity of our design that contrasted face pareidolia with non-face object pareidolia so as to obtain an understanding of the neural networks specifically responsive to face pareidolia.
Average response time was 696.50 ms (SD = 124.25 ms) for the face response, 678.88 ms (SD = 128.78 ms) for the no-face response, 735.10 ms (SD = 176.41 ms) for the letter response, and 732.83 ms (SD = 176.15 ms) for the no-letter response. An ANOVA of task (face task vs. letter task) by detection (face response or letter response vs. no-face response or no-letter response) was performed on the response times. Neither the interaction (F(1,19) = 2.103, p = 0.163) nor main effects were significant (task: F(1,19) = 2.694, p = 0.117; detection: (F(1,19) = 0.779, p = 0.388).
3.2. Analysis of Classification image (CI)
To ascertain whether participants actually experienced face or letter pareidolia when they reported to have seen a face or letter respectively, we used classification images (CI) based on participants’ behavioral responses for the face task and the letter task, respectively (Smith et al., 2012).
The production of CIs was similar to that used by Hansen et al. (2010). For each participant, an individual face CI was obtained by subtracting the averaged pure-noise images with the no-face response from that with the face response. The group face CI was obtained by averaging all individual face CIs across 20 participants. Similar to Hansen et al. (2010), we also used a “cluster test” method (Stat4Ci Matlab toolbox, Chauvin, Worsley, Schyns, Arguin, & Gosselin, 2005) to identify the significant regions of face CI. This method was considered to be more sensitive and therefore better able to detect significant regions with widely contiguous pixels but relatively low Z scores (Chauvin et al., 2005). According to Chauvin et al. (2005), the group face CI was first filtered using a bivariate Gaussian function with SD of 20 pixels and size of 64*64 (Fig. 3A left-top). Then it was Z-scored
Figure 3.

Illustration of the classification images (CI). (A) Top-row: the filtered group face CI (left), filtered group letter CI (middle), and filtered group random CI (right). The bottom-row: the significant regions within corresponding images in the top-row. These significant regions are shown in red. It should be noted that the intensity range of all the CIs have been extended to 0~255. (B) Left: The orientation-averaged 1D frequency amplitude spectrum for the group face CI (blue), group letter CI (red), and group random CI (green). The right: the difference in 1D frequency amplitude spectrum of the group face CI minus the group random CI (blue), and that of the group letter CI minus the group random CI (red).
| (5) |
Where Sz presents the Z-scored face CI and Sf presents the filtered group face CI. S̄f and stdf are the mean and standard deviation of the intensity across all pixels of the filtered group face CI. Finally, the “cluster test” was performed on the Z-scored group face CI, and the statistically significant regions were shown in red. As indicated in Figure 3A (left-bottom), there was a face-like structure (encircled by an oval) in the filtered group face CI.
Similar to the production of the group face CI, each participant’s individual letter CI was obtained by subtracting the averaged pure-noise images with no-letter responses from that with letter responses. The group letter CI was obtained by averaging all individual letter CIs across 20 participants. With the same steps as the group face CI, the group letter CI was also subject to the “cluster test”. As revealed by the “cluster test”, there was a letter-like structure in the center of the group letter CI (Fig. 3A, middle-bottom).
Though the significant regions in the group face CI and group letter CI looked like a structure of a face or a letter, respectively, it would be premature to conclude that they indeed were related to faces or letters. Two alternative possibilities exist for the face- and letter-like structures in the CIs. First, these category-like structures might be a result of chance due to participants’ random responses to trials. Second, they might also reflect general object shapes rather than face- or letter-specific forms.
To rule out these possibilities, we created random individual CIs (Hansen et al., 2010). To obtain such CIs, we randomly divided the 480 pure-noise images into two sets to produce an individual random CI by subtracting the averaged pure-noise images of one set from that of the other. Using this method repeatedly, we produced 20 different individual random CIs because we had 20 face CIs and 20 letter CIs from the 20 participants. Then, the group random CI was obtained by averaging the 20 individual random CIs. We also ran the same “cluster test” on the group random CI. Figure 3A (right-bottom) showed the significant regions in the filtered group random CI, which did not appear to show face- or letter-like structures.
To further ascertain the face or letter specificity of the face and letter CIs, respectively, we first compared the spatial frequency amplitude spectrums of the group face CI and the group letter CI with that of the group random CI. The orientation-averaged 1D frequency amplitude spectrum (Sk) for each CI was calculated in the following manner:
| (6) |
Where the FCI presents a 2-D Fast Fourier transformation spectrum (under polar coordinates) for each CI (e.g. group face CI), and the k and the θi denote the radius and the orientation of a position in the FCI, respectively.
Figure 3B (left) showed the orientation-averaged 1D frequency amplitude spectrum for the group face CI (blue), group letter CI (red), and group random CI (green). The relative 1D frequency amplitude spectrums of the group face CI and the group letter CI were obtained by subtracting the 1D spectrum of random CI from those of the group face CI and the group letter CI, respectively (Fig. 3B right). The remaining amplitudes in the two relative spectrums show that the group face CI and the group letter CI were indeed different from the group random CI, and their significant clusters were not due to chance (Hansen et al., 2010).
To further validate the specificity of the structures in the group face CI and the group letter CI, we compared their frequency spectrums to those of a noise-masked face image and a noise-masked letter image, respectively. The noise-masked face image (Figure 4A middle-top) was produced by blending a contrast-reduced average face image with the group random CI (Hansen et al., 2010). The average face image (Fig. 4A left-top) was obtained using the following steps. First, 200 face images (100 males) were generated using the “FaceGenModeller” (Singular Inversions Inc.), and then for each face image, its neck was removed. Next, an averaged face image was obtained by overlapping these 200 face images. The edges of the averaged face image were cut, so that the forehead and the chin of the face reached the top and the bottom edges of the averaged face image, respectively.
Figure 4.

Illustrations of a noise-masked face image and a noise-masked letter image, and their orientation-averaged 1D frequency amplitude spectrums. A) From left to right are: the average face image (top) and the average letter image (bottom); the noise-masked face image (top) and noise-masked letter image (bottom); the filtered noise-masked face image (top) and filtered noise-masked letter image (bottom). B) Left: The normalized 1D frequency amplitude spectrums of the group face CI (blue), noise-masked face image (red), and average face image (green). Right: The normalized 1D frequency amplitude spectrums of the group letter CI (blue), noise-masked letter image (red), and average letter image (green). It should be noted that the intensity range of all the images have been extended to 0~255 to improve clarity.
The noise-masked letter image (Fig. 4A middle-bottom) was produced by blending a contrast-reduced average letter image which was obtained by averaging 26 480*480 English letter images (Fig. 4A left-bottom) with the same group random CI as that used for producing the noise-masked face image. It is noted that, in the present study, the participants were instructed to detect any one of the 26 letters from the noise image in the letter task. Thus, the noise-masked letter image was produced using the average of the 26 letters, even though only 9 letters were used in the training period. For the simplicity of description, we will henceforth refer to the group face CI, noise-masked face image and average face image as face-related images. We will refer to the group letter CI, noise-masked letter image and average letter image as letter-related images. The mean intensities of the average face, the noise-masked face, the average letter, and the noise-masked letter were reduced to zero. Then, using Equation 6, the orientation-averaged 1D frequency amplitude spectrum of each of these images was obtained. Figure 4B shows the normalized orientation-averaged 1D frequency amplitude spectrums for the face-related images (Fig. 4B left), and the letter-related images (Fig. 4B right).
As indicated by Figure 4B, the difference in frequency amplitudes between faces and letters mainly resides on the low-frequency bands. Due to this distribution difference, the frequency band was limited to 1~12 cycles/picture for the following correlation analyses for both the face- and letter-related images. If the face-like region in the group face CI and the letter-like region in the group letter CI were indeed respectively relevant to faces or letters, one should expect a significant correlation of 1D frequency amplitude spectrums between the group face CI and the noise-masked face, and between the group letter CI and the noise-masked letter. One would also expect a lack of significant correlations between the face-related images and the letter-related images. In agreement with our expectations (Fig. 5), the significant correlation coefficients were only observed between the group face CI and the noise-masked face image, and between the group letter CI and the noise-masked letter image (ps < 0.005, corrected for 6 multi-comparisons, Bonferroni correction).
Figure 5.

The results of the correlation analysis used to validate the specificity of face-like structure and letter-like structure in-group face CI and group letter CI, respectively. The numbers beside the arrowed lines are the correlation coefficients, which were calculated using 12 low-frequency components (i.e., 1~12 cycles/picture). The significant correlations are indicated by a star marker (ps < 0.005, corrected for 6 multi-comparisons, Bonferroni correction).
Some may argue that the significant regions in the group random CI was also face-like with a right eye and mouth combination. To rule out this possibility, we performed the spatial correlation analysis between the average face and group face CI and that between the average face and group random CI. We found that the group face CI correlated with the average face, whereas the group random CI did not, suggesting that the group face CI were significantly different from the group random CI (more detail see Supplementary result 1).
These findings confirmed that the structures in the group face CI and the group letter CI were indeed face-like and letter-like, respectively. They also demonstrated that we were successful in eliciting face pareidolia in the face task and letter pareidolia in the letter task.
3.3. ROI analysis
Subject-specific face and letter preferentially responsive regions in the occipitotemporal cortex were defined as the regions of interest (ROI) by the localizer sessions. As summarized in Table 1, regions that responded more to faces than to other stimuli were observed in the bilateral fusiform gyrus, the coordinates of which were highly consistent with what has been reported in the literature regarding the Fusiform Face Area (FFA) (Kanwisher, McDermott, & Chun, 1997; Yovel & Kanwisher, 2004; Ishai, Schmidt, & Boesiger, 2005). The letter-preferential region (LA, Gauthier, Tarr, Moylan, Skudlarski, Gore, & Anderson, 2000b) was only found in the left occipitotemporal cortex whose locus was consistent with those reported by recent studies (e.g., Gauthier et al., 2000b). Additionally, another face-preferential region, the occipital face area (OFA, Gauthier et al., 2000b) was also identified by the same conjunction analysis (Supplementary Table S1). For simplicity of description, these ROIs will be referred to using these names based on their response preference or their anatomical locations.
Table 1.
The face-preferential brain regions (p < 0.0001 uncorrected) and letter-preferential region (p < 0.05 uncorrected) defined by the localizer sessions.
| Brain Regions | Number | Talairacha
|
T | Size (voxel)b | |||
|---|---|---|---|---|---|---|---|
| x | y | z | |||||
| FFA | left | 16 | −39(1) | −52(1) | −17(1) | 7.0(0.5) | 80(16) |
| right | 17 | 41(1) | −48(1) | −15(1) | 7.8(0.6) | 104(21) | |
| LA | left | 14 | −49(2) | −56(2) | −8(1) | 2.4(0.2) | 21(7) |
Mean (Standard error);
Voxel size is 2×2×2mm3. FFA fusiform face area and LA Letter-preferential area.
Figure 6 showed the results of the ROI analysis based on the data from the experimental testing sessions. Significant percent signal change (PSC) was found for all conditions (i.e., face response, no-face response, letter response, and no-letter response) relative to baseline for the bilateral FFA (ps < 0.001). In contrast, within the LA, significant PSC was found for the letter response (t(13) = 3.095, p = 0.009) and the no-letter response relative to baseline (t(13) = 2.220, p = 0.045) but not for the face response(t(13) = 1.961, p = 0.072) and the no-face response (t (13) = −0.068, p = 0.947).
Figure 6.
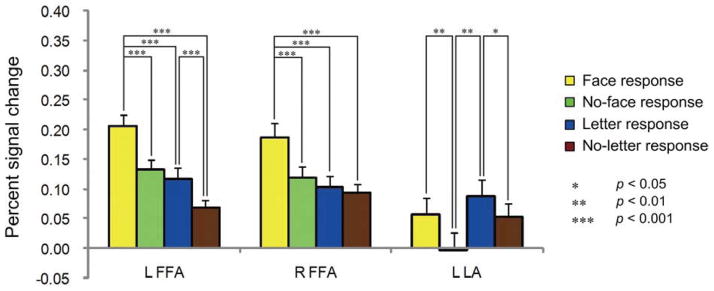
The results of ROI analyses. The y-axis indicates the percent signal change (PSC) and the error bar indicates the standard error of the mean BOLD signal across subjects.
Within each of ROIs, a two-way ANOVA of task (face task vs. letter task) by detection (reporting seeing a face or a letter vs. not reporting seeing a face or a letter) was performed on the PSC across all participants. Within the right FFA, there was a main effect of task (F(1,16) = 12.923, p = 0.002, ηp2 = 0.447) and detection (F(1,16) = 23.216, p < 0.001, ηp2 = 0.592) due to greater PSC for the face task than the letter task, and greater PSC for detection responses than for no-detection responses. Additionally, within this region, there was a significant interaction between task and detection (F(1,16) = 20.682, p < 0.001, ηp2 = 0.564). Post hoc analyses revealed that the right FFA showed more activation for the face responses than for any of the other three conditions (ps < 0.001) with no significant difference in activity between the latter three conditions (ps > 0.1) (Fig. 6).
Within the left FFA, the main effects of task (F (1,15) = 24.506, p< 0.001, ηp2 = 0.620), and detection, (F(1,15) = 32.075, p< 0.001, ηp2 = 0.681), were significant, due to greater PSC for the face task than for the letter task, and greater PSC for detection responses than for no-detection responses, respectively. However, the interaction between task and detection was not significant (F(1,15) = 3.383, p = 0.086, ηp2 = 0.184). Post hoc analyses revealed that, like the right FFA, the left FFA showed more activation for the face responses than for any of the other three types of responses (ps < 0.001). However, unlike the right FFA, in the left FFA, the letter response activation was also significantly greater than the no-letter response activation (t(15) = 4.547, p< 0.001; Fig. 6), suggesting that the left FFA might not be specifically responsive to face pareidolia.
Within each of the bilateral OFAs, neither the interaction between task and detection nor any main effect was significant (ps > 0.05, for more details see Supplementary result 2) except that the right OFA only presented a significant main effect of detection due to greater responses when participants “saw” a face or a letter in the pure-noise image than that when they did not (F(1,13) = 12.742, p = 0.003).
As for the letter-preferential area, namely the letter area (LA), the main effects of task (F(1,13) = 4.712, p = 0.049, ηp2 = 0.266), and detection (F(1,13) = 17.592, p = 0.001, ηp2 = 0.575) were significant, due to greater PSC for the letter task than for the face task, and greater PSC for detection responses than for no-detection responses, respectively. However, there was no significant interaction between task and detection (F(1,13) = 0.882, p = 0.365, ηp2 = 0.064). Post hoc analyses revealed that in the LA, both the letter and face responses elicited greater activation than the no-letter (t(13) = 2.307, p = 0.038) and no-face responses (t(13) = 3.312, p = 0.006), respectively (Fig. 6).
3.4. Correlations between the group face CI and the activity of the bilateral FFAs
As indicated above, the face-like structure in the group face CI reflected that participants likely experienced face pareidolia behaviorally. We further examined whether each participant’s activation difference between face and no-face responses in the bilateral FFA were related to the individual participant’s face CI derived from his or her behavioral data. We first extracted the face-like structure from the group face CI as a mask (Fig. 7A top-middle). We then calculated the mean intensity across all pixels of each participant’s face CI within this face-like mask. This measure reflects the extent to which a participant’s face CI resembled the group face CI: the greater the pixel intensity, the more it resembled the group face CI (or the more face-like). Finally, for each of the bilateral FFAs, we calculated the correlation coefficient between participants’ PSC difference of the face response minus the no-face response and their face CI’s mean pixel intensity within the face-like mask. Additionally, as a control, in each of the FFAs, we also calculated the correlation coefficient between participants’ PSC difference of the letter response minus the no-letter response and their face CI’s mean pixel intensity within the face-like mask.
Figure 7.

The correlation between activity of the right FFA and the intensity of face CI. A) Top line: the group face CI (left), the extracted face-like mask (middle), and the extracted contour-related mask (right); Bottom line: the group letter CI (left) and the extracted letter-like mask (right). B) The sub-regions of extracted face-like mask (left) and the extracted contour-related mask (right). These regions are named according to their spatial relationship in the group face CI. C) The top-left: the correlation between the PSC difference of the face response minus the no-face response of the right FFA (horizontal axis) and the mean pixel intensity in face-like mask for participants’ face CI (vertical axis). The top-right: the correlation between the PSC difference for the face response minus the no-face response of the right FFA (horizontal axis) and the mean pixel intensity in Mouth-Nose mask for participants’ face CI (vertical axis). The bottom-left: the correlation between the PSC difference of the face response minus the no-face response of the right FFA (horizontal axis) and the mean pixel intensity in contour-1 mask for participants’ face CI (vertical axis). The bottom-right: the correlation between the PSC difference for the face response minus the no-face response of the right FFA (horizontal axis) and the mean pixel intensity in contour-2 mask for participants’ face CI (vertical axis).
The significant correlation between the mean pixel intensity and the PSC difference of the face response minus the no-face response was observed only within the right FFA (r = 0.547, p = 0.023; Fig. 7C top-left), but not within the left FFA (r = 0.196, p = 0.468). The same pixel intensity did not correlate with the PSC difference of the letter response minus the no-letter response within the right FFA (r = −0.124, p = 0.635) or the left FFA (r = 0.097, p = 0.722). In other words, the more a participants’ face CI resembled a face, the greater the PSC difference between the face-response and the no-face response in the right FFA. This finding suggests that the neural responses in the right FFA were specifically associated with the extent to which participants experienced face pareidolia.
As shown in Figure 7B (left), the face-like structure consists of three sub-regions, namely the “right eye”, the “left eye”, and the “mouth and nose”. To ascertain which of the three sub-regions is specifically related to the activity in the right FFA, we also calculated the correlation coefficient between the mean pixel intensity of each of these three sub-regions and the PSC difference of the face response and the no-face response of the right FFA. The significant correlation was only observed for the “mouth-nose” mask (r = 0.520, p = 0.032) (Fig. 7C top-right), but not for the “right-eye” mask (r = 0.277, p = 0.281) or the “left-eye” mask (r = 0.321, p = 0.209). Further, for none of such three sub-regions, its mean pixel intensity significantly correlated with the PSC difference of letter responses and no-letter responses (right-eye mask: r = 0.176, p = 0.499; mouth-nose mask (r = −0.142, p = 0.586; left-eye mask: r = −0.228, p = 0.379).
Because the “mouth-nose” mask partially overlaps with the letter-like structure in the group letter CI (Fig. 7A bottom-left), as a control, we performed an additional correlation analyses between participants’ individual letter CIs and the neural activity in the LA. To this end, we first extracted the letter-like structure of the group letter CI as a mask (Fig. 7A bottom-right). We then calculated the mean intensity across all pixels within the letter-like mask. Finally, we calculated the correlation coefficients between the PSC difference of the letter response minus the no-letter response of the LA and the individual letter CIs’ mean pixel intensity within the letter-like mask, but the correlation was not significant (r = 0.239, p = 0.411). We did the same with the PSC difference of the face response minus the no-face response in the LA, and no significant correlations were found (r = −0.221, p = 0.447).
We observed that there were regions located at the edge of the oval (Fig. 7A top-right) in the group face CI that resembled the contour of a face. To validate our observation we first extracted these regions from the group face CI and referred them as contour-related masks (Fig. 7A top-right). We then calculated the mean intensity across all pixels of each participant’s face CI within each of contour-related masks. Finally, for each of the bilateral FFAs we calculated the correlation coefficient between participants’ PSC difference of the face response minus the no-face response and their face CI’s mean pixel intensity within each contour-related mask (Fig. 7B right). Within the right FFA, the significant correlation was found for contour-1 mask (r = 0.483, p = 0.049, Fig. 7C bottom-left) and contour-2 mask (r = 0.529, p = 0.029 Fig. 7C bottom-right), but not for contour-3 mask (r = −0.365, p = 0.150). These findings suggested that these regions at the edge of the oval (i.e., contour-1 and contour-2 mask, Fig. 7B left) might be related to illusory detection of the face contour. Additionally, as a control, in the right FFA, we also calculated the correlation coefficient between participants’ PSC difference of the letter response minus the no-letter response and the face CI’s mean pixel intensity within each contour-related mask. However, none of such three sub-regions presented significant correlation (contour-1 mask: r = 0.265, p = 0.305; contour-2 mask: r = −0.087, p = 0.741; contour-3 mask: r = −0.415, p = 0.098).
Within the left FFA, neither its PSC difference of the face response minus the no-face response nor that of the letter response minus the no-letter response significantly correlated with the mean pixel intensity of each contour-related sub-regions (ps > 0.2).
Whole brain analysis
A whole brain analysis was performed using the data from the testing sessions. As shown in Table 2, by contrasting face responses relative to no-face responses a distributed network was identified which included the frontal cortex, parietal cortex, temporal cortex, occipital cortex, limbic lobe, and some sub-lobar regions (Fig. 8 left). Table 2 also summarizes the regions that responded to the letter response more than to the no-letter response. These regions included the frontal cortex, parietal cortex, occipital cortex, and some sub-lobar regions (Fig. 8 right).
Table 2.
The peak activation elicited by the face response relative to the no-face response and that of the letter response relative to the no-letter response. (p < 0.001 uncorrected, k ≥ 12)
| Brain Region | Hem | BA | Talairach Coorndinates
|
T | Size (voxel) a | |||
|---|---|---|---|---|---|---|---|---|
| x | y | z | ||||||
| Face response minus no-face response | ||||||||
| Frontal Lobe | Middle Frontal Gyrus | R | 46 | 44 | 24 | 21 | 6.26 | 241 |
| Middle Frontal Gyrus | R | 6 | 30 | −4 | 43 | 4.18 | 16 | |
| Inferior Frontal Gyrus | L | 10 | −46 | 45 | −2 | 7.15 | 840 | |
| Inferior Frontal Gyrus | R | 46 | 44 | 34 | 11 | 6.20 | 117 | |
| Inferior Frontal Gyrus | L | 9 | −38 | 7 | 22 | 5.30 | 307 | |
| Parietal Lobe | Inferior Parietal Lobule | R | 40 | 42 | −31 | 42 | 4.11 | 23 |
| Precuneus | L | 7 | −24 | −45 | 39 | 5.90 | 412 | |
| Precuneus | R | 7 | 24 | −54 | 45 | 4.61 | 98 | |
| Temporal Lobe | Middle Temporal Gyrus | R | 39 | 32 | −63 | 27 | 4.35 | 39 |
| Middle Temporal Gyrus | R | 39 | 40 | −73 | 16 | 3.81 | 15 | |
| Fusiform Gyrus | L | 37 | −42 | −61 | −12 | 7.77 | 692 | |
| Fusiform Gyrus | R | 37 | 42 | −59 | −8 | 7.18 | 695 | |
| Limbic Lobe | Anterior Cingulate | L | 33 | −4 | 16 | 18 | 6.53 | 632 |
| Anterior Cingulate | R | 32 | 12 | 28 | 19 | 4.56 | 17 | |
| Posterior Cingulate | L | 30 | −30 | −67 | 18 | 4.22 | 29 | |
| Sub-lobar | Caudate | L | −8 | 10 | 0 | 6.63 | 121 | |
| Insula | R | 47 | 28 | 21 | −3 | 6.65 | 514 | |
| Lentiform Nucleus | R | 12 | 9 | −4 | 5.41 | 131 | ||
| Posterior Lobe | Declive | L | −8 | −73 | −20 | 6.40 | 75 | |
| Declive | R | 22 | −61 | −21 | 5.43 | 86 | ||
| Pyramis | R | 10 | −71 | −24 | 4.70 | 95 | ||
| Letter response minus no-letter response | ||||||||
| Frontal Lobe | Superior Frontal Gyrus | L | 6 | −2 | 14 | 53 | 4.08 | 13 |
| Middle Frontal Gyrus | R | 6 | 26 | 8 | 44 | 4.18 | 20 | |
| Middle Frontal Gyrus | L | 6 | −24 | −2 | 39 | 4.13 | 44 | |
| Inferior Frontal Gyrus | L | 9 | −44 | 5 | 29 | 7.19 | 1268 | |
| Inferior Frontal Gyrus | R | 9 | 50 | 9 | 24 | 5.30 | 263 | |
| Inferior Frontal Gyrus | R | 46 | 46 | 37 | 11 | 3.98 | 17 | |
| Medial Frontal Gyrus | L | 9 | −4 | 33 | 32 | 4.06 | 26 | |
| Parietal Lobe | Inferior Parietal Lobule | R | 40 | 44 | −31 | 36 | 5.19 | 88 |
| Superior Parietal Lobule | L | 7 | −34 | −50 | 50 | 7.06 | 2217 | |
| Occipital Lobe | Middle Occipital Gyrus | R | 37 | 50 | −61 | −7 | 7.18 | 1501 |
| Middle Occipital Gyrus | L | 37 | −48 | −61 | −7 | 6.81 | 493 | |
| Sub-lobar | Claustrum | L | −34 | −3 | 11 | 6.08 | 30 | |
| Claustrum | L | −28 | 15 | −6 | 5.29 | 81 | ||
| Anterior Lobe | Culmen | R | 28 | −62 | −23 | 4.81 | 34 | |
Voxel size is 2×2×2mm3.
Figure 8.

Activation for face responses relative to no-face responses (left) and activation for letter responses relative to no-letter responses (right). The threshold was set at p < 0.001, uncorrected, k ≥ 12.
As shown in Table 3, increased activation in response to faces relative to letters was observed within the right medial frontal cortex (MFC, BA 8), the right inferior frontal gyrus (IFG) (BA 45) which extended to the right middle frontal gyrus (MFG) (BA 46), the left IFG (BA 47), the right precentral gyrus (BA 44), the right middle and posterior fusiform gyrus (BA 37), the left anterior cingulate cortex (ACC BA32) and some sub-lobar regions such as the left lentiform nucleus and the right anterior insula (BA 47) (Fig. 9 left). In contrast, increased activation in response to letters relative to faces was observed only within the anterior lobe of the right cerebellum (Fig. 9 right).
Table 3.
The peak activation of the face response relative to the letter response and that of the letter response relative to the face response (p < 0.001 uncorrected, k ≥ 12).
| Brain Region | Hem | BA | Talairach Coorndinates
|
T | Size (voxel) a | |||
|---|---|---|---|---|---|---|---|---|
| x | y | z | ||||||
| Face response minus letter response | ||||||||
| Frontal Lobe | Inferior Frontal Gyrus | R | 45 | 42 | 24 | 17 | 5.15 | 80 |
| Inferior Frontal Gyrus | L | 47 | −36 | 17 | −9 | 5.17 | 205 | |
| Medial Frontal Gyrus | R | 8 | 4 | 25 | 39 | 3.93 | 15 | |
| Precentral Gyrus | R | 44 | 50 | 12 | 7 | 4.28 | 18 | |
| Temporal Lobe | Fusiform Gyrus | R | 37 | 44 | −65 | −11 | 4.73 | 39 |
| Fusiform Gyrus | R | 37 | 42 | −47 | −15 | 4.59 | 14 | |
| Limbic Lobe | Cingulate Gyrus | L | 32 | −6 | 33 | 30 | 4.67 | 78 |
| Sub-lobar | Extra-Nuclear | R | 13 | 40 | 9 | −7 | 3.95 | 12 |
| Insula | R | 47 | 28 | 21 | −3 | 4.04 | 27 | |
| Lentiform Nucleus | L | −10 | 4 | 0 | 4.95 | 42 | ||
| Letter response minus face response | ||||||||
| Anterior Lobe | Culmen | R | 32 | −54 | −20 | 4.28 | 16 | |
Voxel size is 2×2×2mm3.
Figure 9.

Activation for face responses relative to letter responses (left) and activation for the reverse contrast (right). The activated regions for face response minus letter response were masked by contrast of face response minus no-face response. The activated regions for letter response minus face response were masked by contrast of letter response minus no-letter response. The threshold was set at p < 0.001, uncorrected, k ≥ 12.
4. Discussion
The present study used a behavioral reverse correlation method and fMRI methodology to explore the specificity of neural responses during face pareidolia. Specifically, we tested whether the FFA plays a crucial and specific role in the experience of face pareidolia. To this end, we compared behavioral and neural responses when participants experienced face pareidolia versus letter pareidolia.
Behavioral reverse correlations showed that the face CI produced a face-like structure, consistent with previous reverse correlation studies (Gosselin & Schyns, 2003; Hansen et al., 2010; Rieth et al., 2011), even though we used relatively fewer trials than those existing studies. More importantly, the spectral properties of our face CI significantly correlated with those of a noise-masked averaged face image but did not correlate with the letter CI or the noise-masked averaged letter image. In contrast, the letter CI presented a centralized blob. Letters, unlike faces, do not have a uniform spatial structure; therefore, the blob in the letter CI may reflect an amalgamation of different letters rather than a specific letter. This hypothesis was supported by our finding that the spectral properties of the letter CI significantly correlated with those of a noise-masked average of 26 actual letters but did not with the face CI or the noise-masked averaged face image. Because participants saw identical pure-noise images for the face task and the letter task, our behavioral findings suggest that the face CI and the letter CI were a result of face or letter pareidolia, respectively (Hansen et al., 2010; Gosselin and Schyns, 2003).
One of our major findings was that the right FFA showed specific activation during face pareidolia. Only when the participants “saw” a face in the pure-noise images, did the right FFA show enhanced activation. Furthermore, the correlation analyses between the face CIs and the activity in the right FFA revealed that the greater the activation in the right FFA for face response relative to no-face response, the more face-like the participant’s behavioral face CI. In other words, the greater the activity in the right FFA, the stronger the face pareidolia. Thus, our findings suggest that the response of the right FFA is not only specific to face pareidolia, but may also be quantitatively modulated by the degree to which we experience face pareidolia.
Our findings are highly consistent with those of several recent studies. For example, Summerfield, Egner, Mangels, and Hirsch (2006a) demonstrated that the FFA showed an enhanced response to houses mistaken as face than to faces mistaken as houses. Further, a recent study of face pareidolia (Hadjikhani, Kveraga, Naik, & Ahlfors, 2009) used magnetoencephalography (MEG) with combination of source location method. They found that the FFA showed equal responses to face-like objects and faces but more responses to face-like objects than to objects at the early stage (165 ms) of processing. Additionally, the right FFA can also be activated by face imagery (Mechelli, Price, Friston, & Ishai, 2004; O’Craven & Kanwisher, 2000). Because these face imagery studies did not provide participants with any visual input, they could be construed to have involved pure top-down face processing. The fact that the right FFA was activated under such conditions suggests that the right FFA is not only involved in bottom-up face processing (i.e., perception of a true face, for a review see Kanweisher & Yovel, 2006), but also is recruited by a pure top-down face processing. In other words, it has an overlapped role in both top-down and bottom-up face processing. Our findings support this hypothesis. In the present study, although the visual stimuli (i.e., pure-noise images) did not contain any face features, the right FFA presented increased activation when participants reported seeing a face in them than when they did not. Thus, the specific response of the right FFA to face pareidolia may have been driven not only by the bottom-up features in the pure-noise images but also by top-down signals, which might have led to a successful match between the internal face template stored in our brain and the sensory input (Summerfield, Egner, Greene, Koechlin, Mangels, & Hirsch, 2006b).
The left FFA also showed greater activation for illusory face detection than for the other three conditions (i.e., no-face response, letter response and no-letter response), suggesting that the left FFA may also play an important role in face pareidolia. However, different from the right FFA, the left FFA also showed enhanced activation to letter response than to no-letter response. This finding suggests that compared to the right FFA, the left FFA’s responses were less specific to face pareidolia. Converging evidence has demonstrated that the right FFA is more sensitive to faces than the left FFA (for a review see Kanweisher and Yovel, 2006). The difference in response to face pareidolia between the bilateral FFA may be due, in part, to the dominance of the right FFA in face processing. As for the bilateral OFAs, we failed to find a significant interaction between task and detection. Further, both of them were equally activated by face responses and letter response, suggesting that their responses might not be specific to face pareidolia. These findings were greatly consistent with recent fMRI studies wherein no response difference was revealed between top-down processing of faces and that of non-face objects (e.g., houses, Summerfield et al., 2006a; Esterman & Yantis, 2010).
The LA showed enhanced activation not only to letter-response than to no-letter response, but also to face-response than to no-face response, suggesting that it may not be specific to letter pareidolia. Because we are experts in processing of both faces and letters, one possibility is that the LA may be involved in the pareidolia of objects with which we have expertise (e.g. face and letter). However, because only faces and letters were used as stimuli in the present study, this hypothesis should be tested in future studies using experimental paradigm including stimuli with which we have or have not expertise.
One may argue that the increased activation of the bilateral FFA in response to face pareidolia was a result of pure expectation for faces rather than face pareidolia per se, that requires bottom-up input. Esterman and Yantis (2010) found that face expectation can enhance activation of the FFA even before seeing the expected face. It is important to note that although our participants were misled to believe that 50% pure noise images contained faces, they did not know which ones “contained” a face. If our findings were due to face expectations alone, the bilateral FFAs should show equally enhanced activation for both the face response and the no-face response trials. This was clearly not the case, as the face-response activations in the bilateral FFA were significantly greater than the no-face response, letter-response, and no-letter response.
Another alternative explanation could be that the structure of faces is more complex than that of letters, and therefore it is more difficult to detect a face than a letter from noise images. For this reason, the right FFA and left FFA could have shown greater activation in response to the detection of faces in the face task than to the detection of letters in the letter task. However, as indicated by the behavioral results, there is no significant difference in detection rate or response time between the face task and the letter task. Further, the letter-preferential region (i.e., LA) showed significantly increased activation during the letter task compared to during the face task. Thus, the greater activation of the bilateral FFA to the illusory detection of faces in the face task is highly specific and indeed attributable to face pareidolia.
Nevertheless, it should be noted that unlike the previous behavioral studies (e.g., Hansen et al., 2010), due to the MRI scanning time limitation, we only used 480 pure noise image trials to induce face or letter pareidolia respectively. Although we reliably produced face and letter pareidolia in all participants, their individual CIs were highly variable. Had we used more trials, the correlations between the face or letter CIs and neural responses in the face-responsive regions could have been even stronger.
Using a whole brain analysis, comparisons of activities between the face- and letter-responses revealed a distributed network extending from the ventral occipitotemporal cortex (VOT) to the prefrontal cortex. In the VOT portion of this network, we found two face-specific regions in the right fusiform gyrus: one in the middle right fusiform gyrus, and the other in the posterior fusiform gyrus. The locus of the first region was highly consistent with the right FFA identified by the localizer sessions. Thus, consistent with the findings of the ROI analysis, the whole brain analysis revealed that the middle right fusiform gyrus responds uniquely during face pareidolia. The second region, the right posterior fusiform gyrus, was located at the midway point between the right primary visual cortex and the right FFA. Recent studies revealed a hierarchical pathway of face processing along the VOT (Haxby, Hoffman, & Gobbini, 2000, Fairhall & Ishai, 2007) wherein the lower visual cortex may segment face-like features from external information and send them to a higher visual region (e.g., the FFA) for the assembly of a face. Further, recent EEG studies using another reverse correlation method, Bubbles, revealed a dynamic integration of face features when facial expressions were categorized (Schyns, Petro, & Smith, 2007; Schyns, Gosselin, & Smith, 2009; van Rijsbergen & Schyns, 2009). Especially, Schyns et al. (2007) found that the N170 recorded at the bilateral occipitotemporal cortex, a face-sensitive ERP component, can integrate face features. It started as early as 50 ms before N170 for coding of the eyes, and then moved down the face, and finally peaked when the diagnostic feature for a perception decision was coded. Thus in the present study, when participants tried to detect a face from pure noise images, the right VOT may be involved at first in processing local facial features before integrating them into a face, which in turn may result in the experience of face pareidolia in the FFA or in higher cortical regions.
The whole brain analysis also revealed face specific activations in the prefrontal cortex and sub-lobar regions, such as the bilateral IFG, MFG, and right anterior insula. These findings are consistent with Summerfield et al. (2006a) who found that the dorsal medial frontal cortex (MFC), right anterior insula, and right dorsolateral prefrontal cortex (DLPFC) were activated when participants mistook degraded houses for faces. Additionally, these regions were recently reported to be involved in the learning and retrieval of faces (Gobbini & Haxby, 2006, 2007; Sergerie, Lepage, & Armony, 2005; Devue, Collette, Balteau, Degueldre, Luxen, Maquet, 2007; Sugiura, Sassa, Jeong, Horie, Sato, & Kawashima, 2008). As face pareidolia relies on a match between external information and internally stored face templates, increased activation in these regions during face pareidolia may be related to the retrieval and activation of internal face representations.
Previous studies have reported that the prefrontal cortex can exert considerable influence on the visual cortex to facilitate the processing of sensory input (Curtis & D’Esposito, 2003; Miller & D’Esposito, 2005; Beck & Kastner, 2009; Gilbert & Sigman, 2007). Specifically, a recent fMRI study has revealed that feed-backward connectivity from the MFG to the FFA was enhanced when participants decided whether degraded stimuli were faces versus houses (Summerfield et al., 2006b). Further, a recent EEG study using a similar reverse correlation method to that in the present study found increased neural activity in the frontal cortex and the occipitotemporal regions, and moreover the frontal activation occurred prior to the occipitotemporal activation (Smith et al., 2012). This evidence along with our findings suggests that when experiencing face pareidolia, neural regions in the upper stream of the face processing network may send modulatory signals to influence the activities in the FFA, biasing the FFA to interpret the bottom-up signals from the visual cortex as containing face information despite the fact that the pure-noise images do not contain faces.
5. Conclusion
In summary, the present study, for the first time, contrasted behavioral and neural responses of face pareidolia with those of letter pareidolia to explore face-specific behavioral and neural responses during illusory face processing. We found that behavioral responses during face pareidolia produced a classification image that resembled faces, whereas those during letter pareidolia produced a classification image that was letter like. Further, we revealed that the extent to which such behavioral classification images resembled faces was directly related to the level of face-specific activations in the right FFA. This finding suggests that the right FFA plays a specific role, not only in the processing of real faces, but also in illusory face perception, perhaps serving to facilitate the interaction between bottom-up information from the primary visual cortex and top-down signals from the prefrontal cortex (PFC). Whole brain analyses revealed a network specialized in face pareidolia, including both the frontal and occipito-temporal regions. Our findings suggest that human face processing has a strong top-down component whereby sensory input with even the slightest suggestion of a face can result in a face interpretation. This tendency to detect faces in ambiguous visual information is perhaps highly adaptive given the supreme importance of faces in our social life and the high cost resulting from failure to detect a true face.
Supplementary Material
Acknowledgments
This paper is supported by the National Basic Research Program of China (973 Program) under Grant 2011CB707700, the National Natural Science Foundation of China under Grant No. 81227901, 61231004, 61375110, 30970771, 60910006, 31028010, 30970769, 81000640, the Fundamental Research Funds for the Central Universities (2013JBZ014, 2011JBM226) and NIH (R01HD046526 & R01HD060595). We would like to thank David Huber and Cory Reith for comments and suggestions on the earlier versions of this manuscript.
Footnotes
Publisher's Disclaimer: This is a PDF file of an unedited manuscript that has been accepted for publication. As a service to our customers we are providing this early version of the manuscript. The manuscript will undergo copyediting, typesetting, and review of the resulting proof before it is published in its final citable form. Please note that during the production process errors may be discovered which could affect the content, and all legal disclaimers that apply to the journal pertain.
References
- Beck DM, Kastner S. Top-down and bottom-up mechanisms in biasing competition in the human brain. Vision Research. 2009;49(10):1154–1165. doi: 10.1016/j.visres.2008.07.012. [DOI] [PMC free article] [PubMed] [Google Scholar]
- Brett M, Anton J, Valabregue R, Poline J. Region of interest analysis using an SPM toolbox [abstract]. The 8th International Conference on Functional Mapping of the Human Brain; Sendai, Japan. 2002. Available on CD-ROM in NeuroImage. [Google Scholar]
- Chauvin A, Worsley KJ, Schyns PG, Arguin M, Gosselin F. Accurate statistical tests for smooth classification images. Journal of Vision. 2005;5(9):659–667. doi: 10.1167/5.9.1. [DOI] [PubMed] [Google Scholar]
- Curtis CE, D’Esposito M. Persistent activity in the prefrontal cortex during working memory. Trends in Cognitive Sciences. 2003;7(9):415–423. doi: 10.1016/s1364-6613(03)00197-9. [DOI] [PubMed] [Google Scholar]
- Devue C, Collette F, Balteau E, Degueldre C, Luxen A, Maquet P, et al. Here I am: The cortical correlates of visual self-recognition. Brain Research. 2007;1143:169–182. doi: 10.1016/j.brainres.2007.01.055. [DOI] [PubMed] [Google Scholar]
- Esterman M, Yantis S. Perceptual expectation evokes category-selective cortical activity. Cerebral Cortex. 2010;20(5):1245–1253. doi: 10.1093/cercor/bhp188. [DOI] [PMC free article] [PubMed] [Google Scholar]
- Fairhall SL, Ishai A. Effective connectivity within the distributed cortical network for face perception. Cerebral Cortex. 2007;17(10):2400–2406. doi: 10.1093/cercor/bhl148. [DOI] [PubMed] [Google Scholar]
- Friston KJ, Holmes AP, Worsley KJ, Poline JP, Frith CD, Frackowiak RS. Statistical parametric maps in functional imaging: A general linear approach. Human Brain Mapping. 1994;2(4):189–210. [Google Scholar]
- Gauthier I, Tarr MJ, Anderson AW, Skudlarski P, Gore JC. Activation of the middle fusiform ‘face area’ increases with expertise in recognizing novel objects. Nature Neuroscience. 1999;2(6):568–573. doi: 10.1038/9224. [DOI] [PubMed] [Google Scholar]
- Gauthier I, Skudlarski P, Gore JC, Anderson AW. Expertise for cars and birds recruits brain areas involved in face recognition. Nature Neuroscience. 2000a;3:191–197. doi: 10.1038/72140. [DOI] [PubMed] [Google Scholar]
- Gauthier I, Tarr MJ, Moylan J, Skudlarski P, Gore JC, Anderson AW. The fusiform “face area” is part of a network that processes faces at the individual level. Journal of Cognitive Neuroscience. 2000b;12:495–504. doi: 10.1162/089892900562165. [DOI] [PubMed] [Google Scholar]
- Gilbert CD, Sigman M. Brain states: Top-down influences in sensory processing. Neuron. 2007;54(5):677–696. doi: 10.1016/j.neuron.2007.05.019. [DOI] [PubMed] [Google Scholar]
- Gobbini MI, Haxby JV. Neural response to the visual familiarity of faces. Brain Research Bulletin. 2006;71(1):76–82. doi: 10.1016/j.brainresbull.2006.08.003. [DOI] [PubMed] [Google Scholar]
- Gobbini MI, Haxby JV. Neural systems for recognition of familiar faces. Neuropsychologia. 2007;45(1):32–41. doi: 10.1016/j.neuropsychologia.2006.04.015. [DOI] [PubMed] [Google Scholar]
- Gosselin F, Schyns PG. Superstitious perceptions reveal properties of internal representations. Psychological Science. 2003;14(5):505–509. doi: 10.1111/1467-9280.03452. [DOI] [PubMed] [Google Scholar]
- Grill-Spector K, Knouf N, Kanwisher N. The fusiform face area subserves face perception, not generic within-category identification. Nature Neuroscience. 2004;7(5):555–562. doi: 10.1038/nn1224. [DOI] [PubMed] [Google Scholar]
- Grill-Spector K, Sayres R, Ress D. High-resolution imaging reveals highly selective nonface clusters in the fusiform face area. Nature Neuroscience. 2006;9(9):1177–1185. doi: 10.1038/nn1745. [DOI] [PubMed] [Google Scholar]
- Hadjikhani N, del Rio MS, Wu O, Schwartz D, Bakker D, Fischl B, et al. Mechanisms of migraine aura revealed by functional MRI in human visual cortex. Proceedings of the National Academy of Sciences. 2001;98(8):4687–4692. doi: 10.1073/pnas.071582498. [DOI] [PMC free article] [PubMed] [Google Scholar]
- Hadjikhani N, Kveraga K, Naik P, Ahlfors SP. Early (N170) activation of face-specific cortex by face-like objects. Neuroreport. 2009;20(4):403–407. doi: 10.1097/WNR.0b013e328325a8e1. [DOI] [PMC free article] [PubMed] [Google Scholar]
- Haist F, Lee K, Stiles J. Individuating faces and common objects produces equal responses in putative face-processing areas in the ventral occipitotemporal cortex. Frontiers in human neuroscience. 2010;4 doi: 10.3389/fnhum.2010.00181. [DOI] [PMC free article] [PubMed] [Google Scholar]
- Hansen BC, Thompson B, Hess RF, Ellemberg D. Extracting the internal representation of faces from human brain activity: An analogue to reverse correlation. NeuroImage. 2010;51(1):373–390. doi: 10.1016/j.neuroimage.2010.02.021. [DOI] [PubMed] [Google Scholar]
- Haxby JV, Hoffman EA, Gobbini MI. The distributed human neural system for face perception. Trends in Cognitive Sciences. 2000;4(6):223–233. doi: 10.1016/s1364-6613(00)01482-0. [DOI] [PubMed] [Google Scholar]
- Heim S, Eickhoff SB, Ischebeck AK, Friederici AD, Stephan KE, Amunts K. Effective connectivity of the left BA 44, BA 45, and inferior temporal gyrus during lexical and phonological decisions identified with DCM. Human Brain Mapping. 2009;30(2):392–402. doi: 10.1002/hbm.20512. [DOI] [PMC free article] [PubMed] [Google Scholar]
- Iaria G, Fox CJ, Scheel M, Stowe RM, Barton JJS. A case of persistent visual hallucinations of faces following LSD abuse: a functional magnetic resonance imaging study. Neurocase. 2010;16:106–18. doi: 10.1080/13554790903329141. [DOI] [PubMed] [Google Scholar]
- Ishai A, Schmidt CF, Boesiger P. Face perception is mediated by a distributed cortical network. Brain Research Bulletin. 2005;67(1–2):87–93. doi: 10.1016/j.brainresbull.2005.05.027. [DOI] [PubMed] [Google Scholar]
- Kanwisher N, McDermott J, Chun MM. The fusiform face area: A module in human extrastriate cortex specialized for face perception. The Journal of Neuroscience. 1997;17(11):4302–4311. doi: 10.1523/JNEUROSCI.17-11-04302.1997. [DOI] [PMC free article] [PubMed] [Google Scholar]
- Kanwisher N, Yovel G. The fusiform face area: A cortical region specialized for the perception of faces. Philosophical Transactions of the Royal Society B: Biological Sciences. 2006;361(1476):2109–2128. doi: 10.1098/rstb.2006.1934. [DOI] [PMC free article] [PubMed] [Google Scholar]
- Li J, Liu J, Liang J, Zhang H, Zhao J, Huber DE, et al. A distributed neural system for top-down face processing. Neuroscience letters. 2009;451(1):6–10. doi: 10.1016/j.neulet.2008.12.039. [DOI] [PMC free article] [PubMed] [Google Scholar]
- Liu J, Li J, Zhang H, Rieth CA, Huber DE, Li W, et al. Neural correlates of top-down letter processing. Neuropsychologia. 2010;48(2):636–641. doi: 10.1016/j.neuropsychologia.2009.10.024. [DOI] [PMC free article] [PubMed] [Google Scholar]
- Mechelli A, Price CJ, Friston KJ, Ishai A. Where bottom-up meets top-down: Neuronal interactions during perception and imagery. Cerebral Cortex. 2004;14(11):1256–1265. doi: 10.1093/cercor/bhh087. [DOI] [PubMed] [Google Scholar]
- Miller BT, D’Esposito M. Searching for “the top” in top-down control. Neuron. 2005;48(4):535–538. doi: 10.1016/j.neuron.2005.11.002. [DOI] [PubMed] [Google Scholar]
- Nestor A, Vettel JM, Tarr MJ. Internal representations for face detection: An application of noise–based image classification to BOLD responses. Human Brain Mapping. 2012 doi: 10.1002/hbm.22128. (in press) [DOI] [PMC free article] [PubMed] [Google Scholar]
- O’Craven KM, Kanwisher N. Mental imagery of faces and places activates corresponding stimulus-specific brain regions. Journal of Cognitive Neuroscience. 2000;12(6):1013–1023. doi: 10.1162/08989290051137549. [DOI] [PubMed] [Google Scholar]
- Rieth CA, Lee K, Liu J, Tian J, Huber DE. Faces in the mist: Illusory face and letter detection. i-Perception. 2011;2(5):458–476. doi: 10.1068/i0421. [DOI] [PMC free article] [PubMed] [Google Scholar]
- Schyns PG, Petro LS, Smith ML. Dynamics of visual information integration in the brain for categorizing facial expressions. Current Biology. 2007;17(18):1580–1585. doi: 10.1016/j.cub.2007.08.048. [DOI] [PubMed] [Google Scholar]
- Schyns PG, Gosselin F, Smith ML. Information processing algorithms in the brain. Trends in Cognitive Sciences. 2009;13(1):20–26. doi: 10.1016/j.tics.2008.09.008. [DOI] [PubMed] [Google Scholar]
- Sergerie K, Lepage M, Armony JL. A face to remember: Emotional expression modulates prefrontal activity during memory formation. Neuroimage. 2005;24(2):580–585. doi: 10.1016/j.neuroimage.2004.08.051. [DOI] [PubMed] [Google Scholar]
- Smith ML, Gosselin F, Schyns PG. Measuring internal representations from behavioral and brain data. Current Biology. 2012;22(3):191–196. doi: 10.1016/j.cub.2011.11.061. [DOI] [PubMed] [Google Scholar]
- Sugiura M, Sassa Y, Jeong H, Horie K, Sato S, Kawashima R. Face-specific and domain-general characteristics of cortical responses during self-recognition. Neuroimage. 2008;42(1):414–422. doi: 10.1016/j.neuroimage.2008.03.054. [DOI] [PubMed] [Google Scholar]
- Summerfield C, Egner T, Mangels J, Hirsch J. Mistaking a house for a face: Neural correlates of misperception in healthy humans. Cerebral Cortex. 2006a;16(4):500–508. doi: 10.1093/cercor/bhi129. [DOI] [PubMed] [Google Scholar]
- Summerfield C, Egner T, Greene M, Koechlin E, Mangels J, Hirsch J. Predictive codes for forthcoming perception in the frontal cortex. Science. 2006b;314(5803):1311–1314. doi: 10.1126/science.1132028. [DOI] [PubMed] [Google Scholar]
- Tarr MJ, Gauthier I. FFA: A flexible fusiform area for subordinate-level visual processing automatized by expertise. Nature Neuroscience. 2000;3:764–770. doi: 10.1038/77666. [DOI] [PubMed] [Google Scholar]
- van Rijsbergen NJ, Schyns PG. Dynamics of trimming the content of face representations for categorization in the brain. PLoS Computational Biology. 2009;5(11):e1000561. doi: 10.1371/journal.pcbi.1000561. [DOI] [PMC free article] [PubMed] [Google Scholar]
- Yovel G, Kanwisher N. Face perception: Domain specific, not process specific. Neuron. 2004;44(5):889–898. doi: 10.1016/j.neuron.2004.11.018. [DOI] [PubMed] [Google Scholar]
- Zhang H, Liu J, Huber DE, Rieth CA, Tian J, Lee K. Detecting faces in pure noise images: A functional MRI study on top-down perception. Neuroreport. 2008;19(2):229–233. doi: 10.1097/WNR.0b013e3282f49083. [DOI] [PubMed] [Google Scholar]
Associated Data
This section collects any data citations, data availability statements, or supplementary materials included in this article.