

Abstract
α6β2* nAChRs in the ventral tegmental area (VTA) to nucleus accumbens (NAc) pathway are implicated in the response to nicotine, and recent work suggests these receptors play a role in the rewarding action of ethanol. Here, we studied mice expressing gain-of-function α6β2* nAChRs (α6L9’S mice) that are hypersensitive to nicotine and endogenous acetylcholine (ACh). Evoked extracellular dopamine (DA) levels were enhanced in α6L9’S NAc slices compared to control, non-transgenic (nonTg) slices. Extracellular DA levels in both nonTg and α6L9’S slices were further enhanced in the presence of GBR12909, suggesting intact DA transporter function in both mouse strains. Ongoing α6β2* nAChR activation by ACh plays a role in enhancing DA levels, as α-conotoxin MII completely abolished evoked DA release in α6L9’S slices and decreased spontaneous DA release from striatal synaptosomes. In HPLC experiments, α6L9’S NAc tissue contained significantly more DA, 3,4-dihydroxyphenylacetic acid (DOPAC), and homovanillic acid (HVA) compared to nonTg NAc tissue. Serotonin (5-HT), 5-hydroxyindoleacetic acid (5-HIAA), and norepinephrine (NE) were unchanged in α6L9’S compared to nonTg tissue. Western blot analysis revealed increased tyrosine hydroxylase expression in α6L9’S NAc. Overall, these results show that enhanced α6β2* nAChR activity in NAc can stimulate DA production and lead to increased extracellular DA levels.
Keywords: dopamine, nicotinic, nucleus accumbens, cholinergic, addiction, Parkinson’s disease
Introduction
Nicotinic acetylcholine receptors (nAChRs) are pentameric, ligand-gated cation channels that, when activated, permit depolarization of a cell’s membrane potential. Neuronal nAChRs are expressed on postsynaptic and/or presynaptic membranes, and can be either homomeric (containing five α7 subunits) or heteromeric (containing two α, two β, and a fifth subunit that is either an α or a β subunit). Heteromeric neuronal nAChRs often contain one or more β2 subunits (Picciotto et al. 1998), where α4β2* (* = other subunits may be present in the pentameric receptor in addition to those indicated) nAChRs are among the most important, prevalent, and widely-expressed subtype in the brain (Exley et al. 2011, McGranahan et al. 2011, Pons et al. 2008, Tapper et al. 2004). Other subtypes, such as α6β2* and α3β4* nAChRs, are now appreciated to have important functions (Drenan et al. 2008, Exley et al. 2011, Frahm et al. 2011, Pons et al. 2008). Acetylcholine (ACh), mainly through is action at ionotropic nAChRs, is a potent regulator of dopamine (DA) transmission in the mammalian brain. nAChRs are richly expressed on the soma and dendrites of midbrain DA neurons in the A9 (substantia nigra pars compacta; SNc) and A10 (ventral tegmental area; VTA) brain areas, and their activation allows for high-frequency burst firing of these cells (Corrigall et al. 1994, Mameli-Engvall et al. 2006). nAChRs are also found in DA axons in forebrain target structures of midbrain DA neurons, including – but not limited to – dorsal striatum, nucleus accumbens (NAc), and prefrontal cortex (Grady et al. 2002). In dorsal striatum and NAc, activation of these presynaptic nAChRs by ACh released from local cholinergic interneurons is critical for normal control of DA transmission (Cachope et al. 2012, Threlfell et al. 2012).
nAChRs containing α6 subunits exhibit high sensitivity to ACh and nicotine (Salminen et al. 2007, Salminen et al. 2004), and are predominantly expressed in only a few brain areas, including DA neurons, norepinephrine neurons, and cells of the visual system (Mackey et al. 2012). For these reasons, it has been suggested that drugs selective for α6* nAChRs may have utility modulating DA transmission in human conditions such as nicotine dependence, alcohol use disorders, Parkinson’s disease, and mood disorders (Drenan & Lester 2012, Quik & McIntosh 2006, Quik & Wonnacott 2011). Studies in rodents have confirmed the potential importance of α6* nAChRs in several conditions. For example, α6 knockout mice do not self-administer nicotine, and re-expression of α6 subunits in the VTA of these mice restores self-administration (Pons et al. 2008). Blockade of α6* nAChRs attenuates voluntary alcohol drinking (Larsson et al. 2004) as well as operant responding for alcohol (Lof et al. 2007). α6* nAChRs are also important in motor control, as rodents lacking full expression of α6 subunits exhibited reduced nicotine-elicited increases in locomotor activity (le Novere et al. 1999). Also, antagonism of α6* nAChRs reduces nicotine-stimulated locomotor hyperactivity (Dwoskin et al. 2008). α6* nAChRs, or the cells on which they reside, may be selectively vulnerable to neurotoxins in animal models of Parkinson’s disease as well as PD itself (Bordia et al. 2007), suggesting that increasing α6* nAChR activity in this disease may be therapeutic.
To better understand the in vivo actions of α6* nAChRs, we constructed and studied a strain of mice expressing α6 subunits with a leucine to serine mutation at the 9′ residue in the second transmembrane domain that increases the sensitivity of α6* nAChRs to agonists such as ACh or nicotine. These α6L9’S mice exhibit spontaneous and nicotine-stimulated locomotor hyperactivity due to enhanced activation of midbrain DA neurons (Drenan et al. 2008), both of which required the α4 nAChR subunit (Drenan et al. 2010). Locomotor activation in these mice may be explained by substantial increases in DA release in dorsal striatum, which we studied using synaptosome preparations and fast scan cyclic voltammetry in brain slices (Drenan et al. 2010, Drenan et al. 2008).
Recently, we have used α6L9’S mice to study the role of α6 subunits in reward and reinforcement. We demonstrated that α6L9’S mice are hypersensitive to the rewarding effect of ethanol injections in conditioned place preference experiments (Powers et al. 2013), suggesting that activation of α6* nAChRs is sufficient for ethanol reward-like behavior. We also showed that activation of α6* nAChRs on VTA DA neurons is sufficient to induce cellular changes that are thought to promote drug reward and subsequent increases in drug seeking (Engle et al. 2013), providing a possible mechanism to explain the response to ethanol in these mice. Together, these studies highlight the importance of α6* nAChRs in the response to drugs of abuse such as ethanol and nicotine. To further examine the mechanisms underlying reward-related behaviors exhibited by α6L9’S mice, we studied DA dynamics in the NAc of these animals. Our results demonstrate substantial yet specific alterations in DA synthesis and release in α6L9’S mice, which provides important new insights into how the nicotinic cholinergic system modulates the DA reward pathway.
Materials and Methods
Mice
All experiments were conducted in accordance with the guidelines for care and use of animals provided by the Office of Laboratory Animal Welfare at the National Institutes of Health, and protocols were approved by the Institutional Animal Care and Use Committee (IACUC) at Purdue University and/or University of Colorado at Boulder. Care was taken to adhere to the ARRIVE guidelines. Mice were kept on a 12hr/12hr light/dark cycle at 22°C and given food and water ad libitum. On approximately postnatal day 21, mice were weaned and housed with same-sex littermates. Tail biopsies were taken for genotype analysis by PCR as previously described (Drenan et al. 2010). α6L9’S mice were generated as described (Drenan et al. 2008) and were backcrossed to C57BL/6 > 10 times. All groups of mice in this study contained approximately equal numbers of males and females. Mice aged 2 to 6 months old were used for experiments.
Materials
α-conotoxin MII (αCtxMII) was synthesized by previously described methods (Azam et al. 2010). 7,8-[3H]Dopamine (specific activity 40–60 Ci/nmol) was a product of PerkinElmer Life and Analytical Sciences (Boston, MA). N-(2-hydroxyethyl)piperazine-N′-(2-ethanesulfonic acid) (HEPES) and its sodium salt were from BDH Chemicals distributed by VWR (Denver, CO). GBR12909 was from Tocris Bioscience (Bristol, UK). Unless specifically mentioned above, all other chemicals and compounds were from Sigma-Aldrich (St. Louis, MO).
Brain Slice Preparation for Electrophysiology
Brain slices were prepared as described (Engle et al. 2012). Mice were anesthetized with sodium pentobarbital (100 mg/kg; i.p.) followed by cardiac perfusion with oxygenated (95% O2/5% CO2), 4°C NMDG-recovery solution containing (in mM): 93 n-methyl D-glucamine, 2.5 KCl, 1.2 NaH2PO4, 30 NaHCO3, 20 HEPES, 25 glucose, 5 Na+ ascorbate, 2 thiourea, 3 Na+ pyruvate, 10 MgSO4•7H2O, 0.5 CaCl2•2H2O (300–310 mOsm, pH 7.3–7.4). Brains were removed from the skull and retained in 4°C NMDG-recovery solution for 1 min. Coronal slices (250 μm) were cut with a DTK-Zero 1 microslicer (Ted Pella, Redding, CA). Brain slices recovered for 12 min at 33°C in oxygen-saturated NMDG-recovery solution, after which they were held until recording in HEPES holding solution containing (in mM): 92 NaCl, 2.5 KCl, 1.2 NaH2PO4, 30 NaHCO3, 20 HEPES, 25 glucose, 5 Na+ ascorbate, 2 thiourea, 3 Na+ pyruvate, 2 MgSO4•7H2O, 2 CaCl2•2H2O (300–310 mOsm, pH 7.3–7.4). Coordinates for recordings in NAc were within the following range: (+0.7 to +1.5 mm from bregma, 4.0 to 5.0 mm from the surface, and 0.5 to 1.5 mm from the midline).
Fast Scan Cyclic Voltammetry in Striatal Slices
One slice was transferred to a recording chamber (Warner Instruments, RC-27L bath with PH-6D heated platform), and slices were superfused during the experiment with standard recording ACSF containing (in mM): 124 NaCl, 2.5 KCl, 1.2 NaH2PO4, 24 NaHCO3, 12.5 glucose, 2 MgSO4•7H2O, 2 CaCl2•2H2O (300–310 mOsm, pH 7.3–7.4). Carbon fiber electrode construction and recordings were as previously described (Drenan et al. 2010). Carbon fiber (7 μm, unsized; Goodfellow) electrodes were constructed using anodic electrodeposition of paint (Akopian et al. 2008, Schulte & Chow 1996). Voltammetry data were acquired with a Multiclamp 700B amplifier, a 16-bit Digidata 1322A A/D converter, and pClamp10.3 software (all Molecular Devices Corp.). The command microelectrode potential was −400 mV (against a Ag/AgCl reference electrode), and the potential was scanned from −400 mV to +1000 mV to −400 mV at a rate of 300 V/sec. Ramps were run at 10 Hz. Dopamine release was evoked by stimulating DA fibers with a concentric bipolar electrode (Frederick Haer & Co.), placed 200–300 μm from the recording electrode. The stimulus (250 μs; 100 μA in nonTg slices, 300 μA in α6L9’S slices) elicited maximal or near-maximal release, and stimulus trains were generated with a Master-9 (A.M.P.I.) pulse stimulator. Maximal release was chosen because it reduced variability across experiments (Cragg 2003). DA release responses were sensitive to block by tetrodotoxin (data not shown). A fresh carbon surface was cut and exposed each recording day. Initially, electrodes were calibrated using the following concentrations of dopamine (in μM): 0.5, 1.0, 3.0, 5.0. When data from several (n=5) freshly-cut surfaces were fitted to a linear regression line, this approach yielded an average R2 value equal to 1) 0.99084 when lines were not forced through the zero intercept, and 2) 0.9827 when lines were forced through the zero intercept. From this, we concluded that our probes were sufficiently linear in the 0.5 to 1.0 μM DA range, and we subsequently used only 3.0 and 5.0 μM DA for calibration. Raw DA concentrations reported herein were determined using these standards.
DA Release from Striatal Synaptosomes
DA release from synaptosomes was conducted as previously described (Salminen et al. 2007). Briefly, mice were sacrificed by cervical dislocation, and brain regions to be assayed were dissected. These tissues were homogenized in ice-cold 0.32 M sucrose buffered with 5 mM HEPES, and then centrifuged (12,000g for 20 min). The resulting crude synaptosomal pellets were resuspended in 1.6 ml uptake buffer (in mM: 128 NaCl, 2.4 KCl, 3.2 CaCl2, 1.2 KH2PO4, 1.2 MgSO4, 25 HEPES, pH7.5, 10 glucose, 1 ascorbic acid, 0.01 pargyline). Aliquots were incubated at 37°C for 15 min with the addition of [3H]DA (100 nM, 1μCi for every 0.2 ml) for the last 5 min. Aliquots (80 μl) were transferred to filters and perfused with buffer (uptake buffer with 0.1% BSA, 1 μM atropine and 1μM nomifensine) at 0.7 ml/min for 10 min. For determining the effect of αCtxMII, selected aliquots were perfused for the last 5 min with buffer containing 50 nM αCtxMII. Fractions (~0.1 ml, 10s) were collected into 96-well plates using a Gilson FC204 fraction collector (Gilson, Inc., Middleton, WI) and radioactivity determined after addition of 0.15 ml Optiphase scintillation cocktail to each well using a 1450 Microbeta Trilux counter (Perkin Elmer Life Sciences). For each aliquot, a mean baseline was calculated as cpm/fraction over 5 fractions. For each mouse, 3–5 aliquots were run for each condition (with or without αCtxMII).
High-Performance Liquid Chromatography
Mouse brains were quickly removed, cooled in ice-cold PBS, dissected on ice, flash frozen in liquid nitrogen and then stored at −80°C until being processed for neurochemical analysis. Frozen brain tissue samples were sonicated in cold 0.4 N perchloric acid and centrifuged at 16,100 × g for 30 min. The supernatant was then collected and filtered in Costar Spin-X 0.22 μm nylon membrane polypropylene centrifuge tubes at 1,000 × g for 15 min and then stored at −80°C until analysis. The pellet was resuspended in 0.1 NaOH for protein quantification. Levels of dopamine (DA), DOPAC (3,4-dihydroxyphenylacetic acid), HVA (homovanillic acid), serotonin (5-HT), 5-Hydroxyindoleacetic acid (5-HIAA) and norepinephrine (NE) were analyzed using high-performance liquid chromatography with electrochemical detection (HPLC-ECD). The supernatant was injected into a Dionex Ultimate 3000 HPLC (Thermo Scientific, Bannockburn, IL, USA) using an autosampler within the separation module. The sample temperature was maintained at 8°C prior to injection. The HPLC mobile phase contained: 0.08 M sodium phosphate monobasic, 8% methanol, 2% acetonitrile, 2.0 mM 1-octanesulfonic acid, 0.025 mM ethylenediaminetetraacetic acid, and 0.2 mM triethylamine, at pH 2.4. Chromatography was isocratic with a flow rate of 0.6 mL/min. The mobile phase passed through a precolumn conditioning cell to oxidize contaminants, set at 450 mV. Neurotransmitters were separated on a 150 × 3.2mm C18 column (MD-150, Thermo Scientific) with a 3.0 μm particle size and detected on a Coulochem III electrochemical detector (Thermo Scientific). Ec1 was set at −150mV to oxidize sample contaminants and interfering analytes. Ec2, the analytical cell was set at 350mV. The separation and detection occurred at 32°C. Neurotransmitters were determined as ng analyte per mg protein and quantified using a standard curve generated from injection of standards of the highest available purity. Protein concentration in the tissue samples was determined by the bicinchoninic acid (Smith et al. 1985) protein assay method (Pierce BCA Protein Assay Kit, Thermo Scientific) in a 96-well plate, using bovine serum albumin as a standard (Bradford 1976, Smith et al. 1985).
Western Blot Analysis
Mouse brains were removed and dissected as described for HPLC analysis. Nucleus accumbens (NAc) and dorsal striatum were dissected from nonTg and α6L9’S mice. Brain samples were homogenized in RIPA buffer (25 mM Tris, pH 7.6, 150 mM NaCl, 5 mM EDTA, 1% NP-40, 1% sodium deoxycholate, and 0.1% SDS) containing 1x protease inhibitor cocktail and 1x phosphatase inhibitor cocktail. Samples were sonicated (30% power, 40 sec), centrifuged at 16,000 rcf for 10 min, and the pellet was discarded. Protein concentration of the supernatant was measured using BCA protein assay (Pierce). 20 μg of sample was separated via electrophoresis through a 4–20% gradient polyacrylamide gel, followed by transfer to a PVDF membrane (Bio-rad). After three, 10 min washes in PBS, membranes were incubated in blocking buffer (Li-Cor or nonfat dry milk in TBST) for 90 min at RT. Membranes were then immunoblotted with the following primary antibodies at 4°C overnight: tyrosine hydroxylase (AB1542, Millipore, 1:1000), β-tubulin (AB9354, Millipore, 1:1000), DARPP-32 (cat. #2306, Cell Signaling Technology, 1:1000), or phospho-DARPP-32 (T34) (cat, #5393, Cell Signaling Technology, 1:1000 dilution). After three, 10 min washes in PBS, membranes were probed at RT for 60 min with the following secondary antibodies: HRP-conjugated goat anti-rabbit (1:2000), donkey anti-chicken IR-Dye 680 (Li-Cor; 1:20000), or donkey anti-sheep IR-Dye 800 (Rockland; 1:20000). For tyrosine hydroxylase and β-tubulin western blots, membranes were imaged using a Li-Cor Odyssey scanner following six, 10 min washes in PBS. Western blots were quantified as follows. Western blot bands were quantified using the “signal” parameter in the Odyssey software. Background was subtracted, and the TH signal value was normalized to the β-tubulin signal for each sample to control for equal protein loading. Normalized TH signals were averaged for nonTg and α6L9’S sample groups for both NAc and dorsal striatum. For DARPP-32 western blots, membranes were visualized with ECL reagent (Amersham).
Statistics and Data Analysis
Statistical analysis was performed with GraphPad Prism 6 software. All data are reported as mean + or ± SEM. HPLC, western blot, and synaptosome data were analyzed for significance using an unpaired, two-tailed t-test. Voltammetry data were analyzed for significance using a paired, two-tailed t-test.
Results
To study DA release in NAc shell, we recorded electrically evoked DA signals in brain slices from α6L9’S mice and their non-transgenic (nonTg) littermates. In slices from adult animals containing NAc shell, carbon fiber electrodes were placed ventral and medial to the anterior commissure, and a stimulating electrode for delivering current pulses was placed within 200–300 μm (Fig. 1A). DA was detected by measuring the peak oxidative and reductive currents at +0.6V and −0.2V, respectively, at a sampling frequency of 10 Hz. Figure 1B shows a representative voltammogram from an electrical stimulation in NAc shell. Peak oxidative current at +0.6V was plotted to visualize and analyze extracellular DA levels over time. Figure 1C shows a representative peak oxidative current vs. time ([DA]o) response from nonTg NAc shell. All data were normalized to known concentrations of DA, which were applied to electrodes each recording day to calibrate responses in brain slices. We sought to stimulate NAc slices with sufficient current to elicit maximal or nearly maximal release, which has been reported to reduce variability across experiments compared to sub-maximal stimulation (Cragg 2003). To determine maximal stimulation current, peak [DA]o in response to single (1P) stimulation was recorded for a range of stimulation current values in nonTg and α6L9’S NAc slices. Stimulation with 100 μA (nonTg slices) or 300 μA (α6L9’S slices) current elicited maximal or near maximal (90–100%) peak [DA]o (Fig. 1D). In all subsequent experiments, we used these values to stimulate DA release. All subsequent experiments were conducted in NAc shell.
Figure 1. Recording DA release from NAc using fast scan cyclic voltammetry.
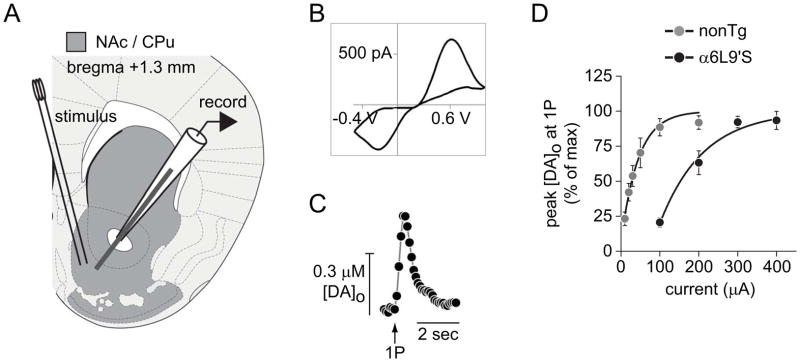
A) NAc recording site. Brain slices from α6L9’S and nonTg mice were prepared at the indicated coordinates. Carbon fiber electrode and stimulating electrode were placed approximately as indicated.
B) A representative cyclic voltammogram is shown from a recording of electrically-evoked DA release from NAc slices.
C) A representative plot of the peak oxidative (+0.6V) current versus time is shown for an evoked DA release event.
D) Input/output curve for DA release from nonTg and α6L9’S NAc slices. DA release from the indicated genotype was electrically evoked with a range of current values. The peak [DA]o data from each genotype were normalized, plotted, and fitted to an exponential function.
In NAc of slices from α6L9’S and nonTg mice, we recorded extracellular DA levels following single stimulations (1P) as well as following 4 stimulations (4P) at 10, 20, 30, and 100 Hz. At all frequencies tested, evoked extracellular DA levels from α6L9’S slices exceeded levels from nonTg slices (Fig. 2A). We quantified these results by measuring both the peak DA achieved at the electrode surface ([DA]o) as well as the area under the release curve, which we refer to as relative DA signal as previously described (Zhang et al. 2009). The relative DA signal (AUC) parameter was previously employed in voltammetric recordings from α6L9’S dorsal striatum (Drenan et al. 2010), where it revealed differences in DA efflux between single pulse and burst stimulation that were not evident by simply measuring peak [DA]o. For both peak [DA]o (Fig. 2B) and relative DA signal (Fig. 2C), DA levels following 4P stimulation exceeded levels following 1P stimulation. In most cases, 4P levels were maximal at 30 Hz, and a decline was seen when stimulation frequency increased from 30 Hz to 100 Hz. Although the frequency-dependence of DA levels was conserved between α6L9’S and nonTg slices, α6L9’S slices exhibited large increases in DA levels when compared to nonTg for a given stimulation type. Based on these data, we chose to compare 1P with 4P 30 Hz for subsequent experiments. When we calculated the decay time contant (tau) for 1P and 4P (30 HZ) peak [DA]o vs. time curves (Fig. 2A), there were several differences. For both 1P and 4P (30 HZ) stimulations, tau values for responses from α6L9’S slices significantly exceeded tau values for responses from nonTg slices (1P nonTg vs. α6L9’S, p<0.0001; 4P nonTg vs. α6L9’S, p<0.0001) (Fig. 2D). In α6L9’S slices, 4P (30 HZ) stimulation was associated with a significantly increased tau value compared to 1P stimulation (p=0.0012) (Fig. 2D). This was not the case for nonTg slices, where tau did not differ significantly when slices were stimulated with a single pulse or a burst of pulses (p=0.1952) (Fig. 2D).
Figure 2. Increased DA release from α6L9’S NAc.

A) Peak oxidative current vs. time is plotted for DA release responses from nonTg and α6L9’S NAc slices. Slices were stimulated with either 1 pulse (1P), or 4 pulses (4P) at the indicated stimulation frequency. The number of responses was: nonTg (1P, n=20; 4P 10 Hz, n=10; 4P 20 Hz, n=10; 4P 30 Hz, n=20; 4P 100 Hz, n=10), α6L9’S (1P, n=20; 4P 10 Hz, n=7; 4P 20 Hz, n=8; 4P 30 Hz, n=20; 4P 100 Hz, n=8).
B) Peak [DA]o versus stimulation frequency is shown for nonTg and α6L9’S NAc DA responses.
C) Relative DA signal (area under the peak oxidative current versus time curve) versus stimulation frequency is shown for nonTg and α6L9’S NAc DA release responses.
D) Extracellular DA levels over time are altered in α6L9’S NAc. For individual 1P and 4P (30 Hz) peak [DA]o vs. time responses in both nonTg and α6L9’S slices, decay tau values were derived by fitting the falling phase of the response to a single exponential decay function. ***p<0.001, **p<0.01
Extracellular DA levels measured using cyclic voltammetry are governed by both release and clearance, the latter occurring via both passive diffusion and active re-uptake via the DA transporter (DAT). We conducted several experiments to investigate the mechanism behind the increased DA levels seen in α6L9’S NAc slices. First, we asked whether differences in DA re-uptake between α6L9’S and nonTg mice could explain our results (Fig. 2A). We reasoned that if DA re-uptake were impaired in α6L9’S mice, a pharmacological blocker of DAT would have little effect on DA levels. In both nonTg and α6L9’S slices, addition of 2 μM GBR12909, a selective blocker of DAT, produced an increase in DA levels for some stimulations (Fig. 3A and B). We quantified these results by measuring the relative DA signal, where results from 1P control responses were set to 100%. There was a modest, GBR12909-induced increase in DA levels in nonTg and α6L9’S slices following 1P stimulation (nonTg 1P, p=0.0053; α6L9’S 1P, p=0.0375) (Fig. 3C). There was a non-significant trend towards increased DA levels following GBR12909 treatment for 4P stimulation in both nonTg and α6L9’S slices (nonTg 4P, p=0.054; α6L9’S, p=0.0696) (Fig. 3C). To verify that GBR12909 was in fact inhibiting DA re-uptake, we conucted a control experiment. Slices containing both NAc and dorsal striatum were prepared as for voltammetry, but were instead incubated in control ACSF or ACSF containing GBR12909 (2 μM). After 10 min of incubation, slices were extracted for western blot analysis designed to measure DARPP-32 phosphorylation, a DA-dependent signaling event (Walaas et al. 1983). We found an increase in phopshorylation of threonine 34 on DARPP-32, without a concomitant increase in total DARPP-32 protein levels, suggesting that GBR12909 did effectively inhibit DA re-uptake in our slices (Fig. 3D). Together, these results suggest that DA re-uptake is intact and ongoing in α6L9’S slices, making it unlikely that impaired DA re-uptake can explain the increased levels in α6L9’S NAc (Fig. 2A).
Figure 3. DA re-uptake is intact in α6L9’S NAc.

A) Peak oxidative current vs. time is shown for DA release responses from nonTg NAc slices before and after bath application of GBR12909 (2 μM). Responses following both 1P and 4P (30 Hz) stimulations were recorded. The number of responses was: 1P control, n=5; 1P GBR, n=5; 4P control, n=5; 4P GBR, n=5.
B) Peak oxidative current vs. time is shown for DA release responses from α6L9’S NAc slices before and after bath application of GBR12909 (2 μM). Responses following both 1P and 4P (30 Hz) stimulations were recorded. The number of responses was: 1P control, n=5; 1P GBR, n=5; 4P control, n=5; 4P GBR, n=5.
C) Relative DA signal values are shown for the 4 conditions X 2 genotypes shown in A) and B). The area under the peak oxidative current vs. time curve was derived for all conditions in A) and B), and data from nonTg and α6L9’S NAc were normalized to their respective 1P pre-drug control values. **p<0.01, *p<0.05
D) DARPP-32 western blot. Slices from nonTg mice containing dorsal striatum and NAc were treated with control ACSF or ACSF containing GBR12909 (2 μM) for 10 min. Tissue samples were prepared for western blot analysis, and blots were probed with the indicated antibodies.
Next, we determined whether DA levels in α6L9’S NAc slices required α6* nAChR activity. In contrast to nonTg NAc DA levels, which was mildly sensitive to α-conotoxin MII (αCtxMII) following 1P stimulation and not sensitive following 4P stimulation (Fig. 4A), α6L9’S evoked NAc DA levels were completely abolished following blockade of α6* nAChRs with αCtxMII (Fig. 4B). Quantification of these results was conducted as for Figure 3C, and shows the dramatic effect of α6* nAChR blockade on NAc DA levels (Fig. 4C). αCtxMII significantly reduced 1P-stimulated DA levels in both nonTg and α6L9’S NAc (nonTg 1P, p=0.0036; α6L9’S 1P, p<0.0001), but 4P levels were only sensitive in α6L9’S slices (nonTg 4P, p=0.5753; α6L9’S 4P, p=0.0327) (Fig. 4C). As a control, we conducted an identical experiment using mecamylamine, a broad-spectrum nAChR antagonist that should block all ongoing nAChR activation. NAc DA levels in nonTg slices were more sensitive to mecamylamine than to αCtxMII (Fig. 4D), as there was a significant reduction in DA levels following both 1P and 4P stimulation (nonTg 1p, p=0.005; nonTg 4P, p=0.0079) (Fig. 4F). Similar to αCtxMII (Fig. 4B), mecamylamine virtually abolished electrically-evoked DA levels in NAc from α6L9’S slices (α6L9’S 1P, p<0.0001; α6L9’S 4P, p=0.0334) (Fig. 4E and F).
Figure 4. Enhanced control of NAc DA release by α6* nAChRs in α6L9’S mice.

A) Peak oxidative current vs. time is shown for DA release responses from nonTg NAc slices before and after bath application of αCtxMII (100 nM). Responses following both 1P and 4P (30 Hz) stimulations were recorded. The number of responses was: 1P control, n=4; 1P αCtxMII, n=4; 4P control, n=4; 4P αCtxMII, n=4.
B) Peak oxidative current vs. time is shown for DA release responses from α6L9’S NAc slices before and after bath application of αCtxMII (100 nM). Responses following both 1P and 4P (30 Hz) stimulations were recorded. The number of responses was: 1P control, n=4; 1P αCtxMII, n=4; 4P control, n=4; 4P αCtxMII, n=4.
C) Relative DA signal values are shown for the 4 conditions X 2 genotypes shown in A) and B). The area under the peak oxidative current vs. time curve was derived for all conditions in A) and B), and data from nonTg and α6L9’S NAc were normalized to their respective 1P pre-drug control values. ***p<0.001, **p<0.01, *p<0.05
D) Peak oxidative current vs. time is shown for DA release responses from nonTg NAc slices before and after bath application of mecamylamine (10 μM). Responses following both 1P and 4P (30 Hz) stimulations were recorded. The number of responses was: 1P control, n=6; 1P αCtxMII, n=6; 4P control, n=6; 4P αCtxMII, n=6.
E) Peak oxidative current vs. time is shown for DA release responses from α6L9’S NAc slices before and after bath application of mecamylamine (10 μM). Responses following both 1P and 4P (30 Hz) stimulations were recorded. The number of responses was: 1P control, n=4; 1P αCtxMII, n=4; 4P control, n=4; 4P αCtxMII, n=4.
F) Relative DA signal values are shown for the 4 conditions X 2 genotypes shown in D) and E). The area under the peak oxidative current vs. time curve was derived for all conditions in D) and E), and data from nonTg and α6L9’S NAc were normalized to their respective 1P pre-drug control values. ***p<0.001, **p<0.01, *p<0.05
Our results using fast scan cyclic voltammetry show substantially increased evoked DA levels from NAc. Pharmacology experiments point to a specific effect on DA release rather than re-uptake, and this putative enhancement in release is more strongly controlled by α6* nAChRs in the mutant mice compared to nonTg mice. We next determined whether spontaneous DA release was also more strongly controlled by α6* nAChRs in α6L9’S mice. We prepared synaptosomes from striatal tissue, and we measured baseline DA release at rest and in response to blockade with αCtxMII. As we have previously done in α6L9’S mice (Cohen et al. 2012, Drenan et al. 2010, Drenan et al. 2008), synaptosomes were prepared from dorsal striatum (ST) and olfactory tubercle (OT), which is the ventral-most portion of the striatum in mice. In these assays, a significant fraction of baseline DA release from striatal synaptosomes requires external Ca2+ (Grady et al. 2002), suggesting ongoing nAChR activity mediates part of the spontaneous release. Interestingly, in OT spontaneous release was insensitive to αCtxMII in nonTg synaptosomes, but exhibited a significant decrease in response to αCtxMII in α6L9’S synaptosomes (nonTg OT, p=0.9708; α6L9’S OT, p=0.0006) (Fig. 5A). In ST, blockade of α6* nAChRs produced similar results (nonTg ST, p=0.5189; α6L9’S, p=0.0013) (Fig. 5B). Overall, these data are consistent with voltammetry data showing that α6* nAChRs exhibit greater control over DA release in α6L9’S NAc compared to nonTg mice.
Figure 5. α6-dependent spontaneous DA release from striatum in α6L9’S mice.
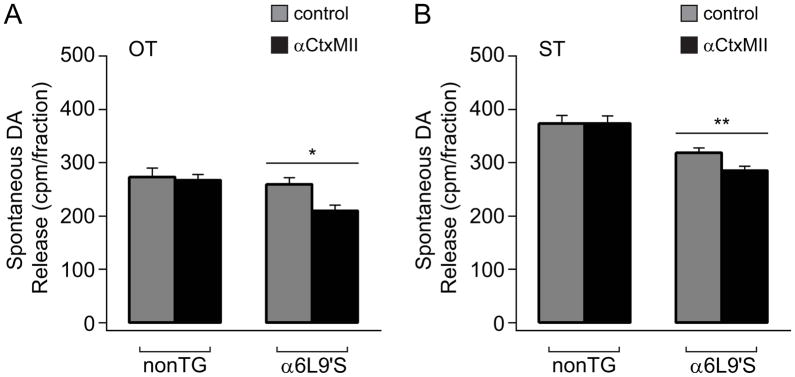
A) Values for baseline DA release (cpm/fraction) from olfactory tubercle (OT) synaptosomes are shown for nonTg (n=6) and α6L9’S (n=6) tissue preparations. Parallel samples (3–5) of synaptosomes from each preparation were incubated in control buffer or buffer with αCtxMII (50 nM). ***p<0.001
B) Values for baseline DA release (cpm/fraction) from dorsal striatum (ST) synaptosomes are shown for nonTg (n=6) and α6L9’S (n=6) tissue preparations. Parallel samples (3–5) of synaptosomes were incubated in control buffer or buffer with αCtxMII (50 nM). **p < 0.01
Having shown that α6* nAChR activity exhibits greater control over DA release in NAc in α6L9’S mice (Fig. 4 and 5), and after addressing the possibility that DA re-uptake is impaired in these mice (Fig. 3), we next determined whether DA synthesis and/or metabolism is altered in these animals. We used HPLC to measure the levels of a number of species in NAc tissue from a group of α6L9’S and nonTg mice. Compared to nonTg littermate control mice, levels of DA were elevated in α6L9’S NAc tissue (Fig. 6A). Similarly, levels of the DA metabolites 3,4-dihydroxyphenylacetic acid (DOPAC) (Fig. 6B) and homovanillic acid (HVA) (Fig. 6C) were also elevated in α6L9’S NAc tissue. We used levels of DA, DOPAC, and HVA to calculate DA turnover, a measure of DA metabolism. DA turnover did not differ in α6L9’S NAc compared to nonTg (Fig. 6G). To determine whether the increased DA in α6L9’S NAc was specific to DA, or generalized across other neuromodulators, we measured serotonin (5-HT) and norepinephrine (NE) in NAc from α6L9’S and nonTg mice. 5-HT (Fig. 6D) and NE (Fig. 6F) did not differ between the two genotypes, and neither did the 5-HT metabolite, 5-hydroxyindoleacetic acid (5-HIAA) (Fig. 6E). As expected, 5-HT turnover was similar in NAc from α6L9’S and nonTg mice. As a reference, a similar HPLC analysis was conducted on ST tissue from α6L9’S and nonTg mice. There was a similar increase in DA, DOPAC, and HVA in dorsal striatum in α6L9’S mice (Table 1).
Figure 6. Increased tissue DA content in α6L9’S NAc. NAc tissue was prepared from α6L9’S (n=7) and nonTg (n=4) mice, followed by analysis of the indicated chemical species via HPLC.

A) DA levels in NAc of α6L9’S and nonTg mice. *p<0.05
B) DOPAC levels in NAc of α6L9’S and nonTg mice. **p<0.01
C) HVA levels in NAc of α6L9’S and nonTg mice. ***p<0.001
D) 5-HT levels in NAc of α6L9’S and nonTg mice.
E) 5-HIAA levels in NAc of α6L9’S and nonTg mice.
F) NE levels in NAc of α6L9’S and nonTg mice.
G) DA turnover in each α6L9’S and nonTg NAc sample was calculated.
H) 5-HT turnover in each α6L9’S and nonTg NAc sample was calculated.
Table 1.
Neurotransmitter content in α6L9’S and nonTg NAc and ST.
| ST | NAc | |||||
|---|---|---|---|---|---|---|
| nonTg (n=4) | α6L9’S (n=7) | p value | nonTg (n=4) | α6L9’S (n=7) | p value | |
| DA | 116.7 ± 20.0 | 168.3 ± 8.2* | 0.0199 | 66.6 ± 19.0 | 105.2 ± 4.9* | 0.0322 |
| DOPAC | 5.6 ± 0.8 | 8.3 ± 0.4** | 0.0079 | 5.3 ± 1.3 | 9.3 ± 0.4** | 0.0051 |
| HVA | 10.2 ± 1.3 | 14.9 ± 0.8** | 0.0098 | 7.1 ± 1.2 | 13.0 ± 0.2*** | 0.0001 |
| DA turnover | 0.14 ± 0.01 | 0.14 ± 0.00 | 0.7459 | 0.14 ± 0.01 | 0.14 ± 0.00 | 0.7459 |
| 5-HT | 10.3 ± 1.1 | 10.3 0.6 | 0.9835 | 16.1 ± 1.9 | 16.8 ± 0.3 | 0.6137 |
| 5-HIAA | 2.9 ± 0.3 | 2.6 ± 0.2 | 0.3945 | 3.1 ± 0.4 | 3.1 ± 0.1 | 0.8603 |
| 5-HT turnover | 0.28 ± 0.01 | 0.25 ± 0.01* | 0.0338 | 0.20 ± 0.01 | 0.18 ± 0.01 | 0.3484 |
| NE | 2.2 ± 0.2 | 2.3 ± 0.1 | 0.3007 | 10.2 ± 2.8 | 8.4 ± 0.8 | 0.4685 |
p<0.05,
p<0.01,
p<0.001
Finally, we tested the hypothesis that increased tissue DA content in α6L9’S NAc is due to enhanced DA synthesis activity in α6L9’S striatum. In NAc and dorsal striatum tissue from α6L9’S and nonTg mice, we measured expression levels of tyrosine hydroxylase (TH), the rate-limiting enzyme in DA synthesis. A representative western blot (Fig. 7A), along with quantified results for blots in all animals in each group (Fig. 7B), reveal a significant increase in levels of TH in NAc in α6L9’S mice compared to nonTg littermates (p=0.0011). There was a similar increase in TH in dorsal striatal tissue from α6L9’S mice (p=0.0394) (Fig. 7B and D).
Figure 7. Increased expression of tyrosine hydroxylase (TH) in NAc and dorsal striatum of α6L9’S mice. Tissue was prepared as for HPLC, and was extracted for western blot analysis.

A) Representative western blot for TH in α6L9’S and nonTg NAc and ST tissue. β-tubulin was probed as a loading control.
B) Quantification of TH western blot results in NAc and ST. TH and β-tubulin blot intensity for each α6L9’S and nonTg sample was derived. TH was normalized to β-tubulin loading for each sample, and values for normalized TH expression is plotted for α6L9’S and nonTg NAc. Number of observations was: NAc (nonTg, n=3; α6L9’S, n=7), ST (nonTg, n=4; α6L9’S, n=7). **p<0.01, *p<0.05
Discussion
Based on behavioral phenotypes that α6L9’S mice exhibit, including locomotor hyperactivity (Drenan et al. 2008), altered wheel running behavior (Cohen et al. 2012), and increased sensitivity to ethanol in conditioned place preference assays (Powers et al. 2013), we hypothesized that there should be detectable differences in DA neurotransmission in NAc that may account for these phenotypes. Evoked DA levels are not only enhanced in α6L9’S NAc (Fig. 2), but are more strongly controlled by α6β2* nAChRs compared to nonTg mice (Fig. 4 and 5). Surprisingly, levels of DA and its metabolites were enhanced in NAc of α6L9’S mice (Fig. 6, Table 1), likely due to increased synthesis of DA stemming from increased expression of TH (Fig. 7), the rate-limiting enzyme in DA production.
Increased electrically-evoked DA levels in α6L9’S NAc is consistent with several previous findings in these mice. In a study using fast scan cyclic voltammetry, DA released from dorsal striatum was also enhanced (Drenan et al. 2010), as was nicotine- and ACh-stimulated DA release from synaptosomes prepared from dorsal and ventral striatum (Cohen et al. 2012, Drenan et al. 2008). Here we show that increased NAc DA levels is not due to a measurable impairment in DAT function, which is consistent with our previous work showing no difference between nonTg and α6L9’S DAT function in dorsal and ventral striatum using a synaptosome assay (Drenan et al. 2010). Interestingly, decay tau values for evoked DA levels were higher in both NAc (Fig. 2D) and dorsal striatum (Drenan et al. 2010) of α6L9’S mice.
NAc DA release is also strikingly sensitive to nAChR blockade in α6L9’S NAc compared to nonTg mice, and this blockade cannot be overcome by 4P (30 Hz) stimulation. These data are reminiscent of results obtained by McGehee and colleagues, who showed that κ opioid agonists, but not μ and δ opioid agonists, profoundly inhibited both single-pulse and burst-evoked DA release in NAc (Britt & McGehee 2008). Our results (Fig. 4) are also consistent with our previous findings in synaptosomes, which show that agonist-activated DA release is more sensitive to αCtxMII in α6L9’S tissue compared to nonTg, with a concomitant decrease in the αCtxMII-resistant component (Drenan et al. 2010, Drenan et al. 2008). nAChR-modulated DA release is thought to depend on Ca2+-entry into DA axons, and strong, burst stimulation of axons in WT tissue is often (Exley et al. 2007, Rice & Cragg 2004), though not always (Perez et al. 2010, Perez et al. 2009), able to overcome nAChR blockade-mediated reduction in DA release. In α6L9’S mouse DA axons, expression of the mutant receptor may cause or be associated with alterations in presynaptic Ca2+ dynamics. This putative change in presynaptic function may explain why burst (4P, 30 Hz) stimulation cannot overcome blockade of α6* nAChRs (Fig. 4). Future experiments should determine whether presynaptic Ca2+ dynamics have changed, and whether stronger electrical stimulation (greater pulse number and/or higher train frequency) of DA fibers can overcome nAChR inhibition.
In patch-clamp recordings from α6L9’S VTA DA neurons in brain slices, we reported the de novo appearance of a steady-state αCtxMII-sensitive membrane conductance (Drenan et al. 2008). In this study, we noted that spontaneous DA release from striatal synaptosomes has acquired sensitivity to αCtxMII in α6L9’S tissue compared to nonTg tissue. These phenomena could be mechanistically similar, caused either by 1) increased activation by circulating ACh in the tissue preparation or 2) spontaneous channel openings, which are occasionally seen in nAChRs harboring mutations in the leucine 9′ residue (Dash et al. 2012). Regardless of the biophysical mechanism, inadvertent activation of α6* nAChRs in α6L9’S mice could explain the spontaneous locomotor hyperactivity seen in these animals (Drenan et al. 2010, Drenan et al. 2008).
Enhanced spontaneous and/or activity-dependent NAc DA release in α6L9’S mice (Fig. 2 and 5) helps explain our recent findings implicating α6* nAChRs in the response to ethanol. Compared to nonTg littermate mice, α6L9’S mice show greater preference for low concentrations of ethanol, drink more ethanol in a binge-drinking paradigm, and exhibit ethanol place conditioning at doses of ethanol that are otherwise insufficient to condition a place preference in nonTg mice (Powers et al. 2013). Evidence is emerging suggesting that ethanol and nAChR activity are additive with respect to stimulation of VTA DA neurons and NAc DA release (Hendrickson et al. 2013, Doyon et al. 2013). Thus, concentrations of ethanol that are otherwise too low to stimulate DA release beyond a threshold sufficient to induce reward may, in α6L9’S mice, become sufficient when combined with enhanced NAc DA release. By this rationale and in conjunction with our GBR12909 results (Fig. 3), α6L9’S mice are predicted to have enhanced sensitivity to other drugs that stimulate DA release, such as psychostimulants and nicotine.
Enhanced DA release in dorsal striatum (Drenan et al. 2010) and NAc (Fig. 2) is partially explained by our results showing increased DA content in NAc and ST tissue from α6L9’S mice (Fig. 6, Table 1). Increased tissue DA content is commonly seen associated with enhanced electrically-evoked DA release (Cragg et al. 2000), though the opposite has also been noted as well (Zhuang et al. 2001). Although we noted a correlation between increased tissue DA content (Fig. 6) and increased DA release (Fig. 2), the magnitude of the enhanced release response far exceeded the increase in DA tissue content. Similar results were obtained by Cragg and colleagues, who demonstrated that small increases in tissue DA content were associated with large increases in electrically-evoked DA release in voltammetry experiments (Cragg et al. 2000). The modest but significant enhancement in TH expression in α6L9’S NAc (Fig. 7) parallels the magnitude of the increase in tissue DA content in these mice.
Here we show that selective enhancement of nAChR activity in DA cell bodies and/or axons in α6L9’S mice results in a standing elevation of TH protein in NAc and ST (Fig. 7). nAChR activity and/or nicotine treatment have long been known to enhance catecholamine biosynthesis, both in the periphery and in the central nervous system (Serova & Sabban 2002, Fossom et al. 1991, Slotkin et al. 1976). This important effect of nicotine is under-appreciated, and may contribute to some of the changes in DA transmission seen following chronic nicotine exposure in laboratory animals and/or human smokers. In rat, sub-chronic nicotine treatment increased TH protein in VTA neurons (Radcliffe et al. 2009). In cultured cells, nicotine exposure produces both acute and sustained increases in TH phosphorylation events that are known to enhance TH activity (Dunkley et al. 2004, Bobrovskaya et al. 2007). These data, combined with our results in this study, suggest that prolonged α6β2* nAChR activation in DA cell bodies and/or terminals could stimulate signal transduction events that promote TH activity. For example, prolonged depolarization of DA axons via ACh-activated hypersensitive α6* nAChRs in α6L9’S mice could promote TH phosphorylation by kinases such as ERK (Haycock et al. 1992), PKC (Haycock 1990), or CaMKII (Griffith & Schulman 1988). Altered desensitization in the mutant α6* channels could possibly account for this putative prolonged depolarization, as nAChR leucine 9′ mutations have been previously shown to alter desensitization (Revah et al. 1991). Further studies will be required to identify the mechanism that accounts for increased TH and DA synthesis in α6L9’S striatum. Regardless of its origins, this mechanism could enhance DA synthesis and activity-dependent DA release, thereby sensitizing aspects of DA transmission to cholinergic tone. This could be an important mechanism to consider as the field continues to develop α6-directed drugs for therapeutic applications. The fact that increased α6* nAChR activity promotes DA transmission could mean that full α6β2* agonists may have significant abuse liability. In contrast, α6β2* antagonists may lower DA synthesis.
Our results connecting increased α6β2* nAChR activity with enhanced activity-dependent DA release in dorsal striatum (Drenan et al. 2010) as well as increased tissue DA content in this area (Table 1) has important implications for movement control and Parkinson’s disease. α6β2* nAChR agonists, due to their ability to stimulate DA release in dorsal striatum (Grady et al. 2002, Salminen et al. 2004), have been proposed as a possible therapeutic tool to reverse the deficits in DA release caused by nigrostriatal damage in Parkinson’s disease (Quik & McIntosh 2006, Quik et al. 2008, Quik & Wonnacott 2011). Our results indicate that long-term activation of α6* nAChRs in striatal areas, in addition to acutely simulating DA release, may also enhance DA synthesis and thereby indirectly enhance release. Conversely, reduced α6β2* nAChR activity may be expected to reduce DA synthesis and activity-dependent release. Interestingly, α4α6β2β3 nAChRs are selectively vulnerable to nigrostriatal damage in rodent PD models as well as in the brains of PD patients (Bordia et al. 2007). Further, mice lacking α6 subunits (α6KO mice), though presenting no overt motor deficits, show reduced L-dopa-induced dyskinesias (Quik et al. 2012). Because this reduction in dyskinesias required weeks to develop, long-term mechanisms such as reduced DA synthesis in α6KO mice may be at play.
Collectively, our results indicate that activity of α6β2* nAChRs in ventral striatal areas is important for 1) acute, activity-dependent DA release and 2) DA biosynthesis. Enhanced α6β2*-mediated DA release likely explains the increased sensitivity of α6L9’S mice to the rewarding properties of ethanol and the ability of nicotine to elicit locomotor hyperactivity. Future experiments studying the sensitivity of α6L9’S mice to nicotine and psychostimulants will be important to complete.
Acknowledgments
This work was supported by National Institutes of Health grants DA030396 (to R.M.D.), DA012242, GM103801 and GM48677 (to J.M.M.), DA031289 (to D.H.B.), ES019879 (to J.R.C.). S.R.G. was supported by DA019375 to Henry A. Lester. R.M.D. was supported by a Ralph W. and Grace M. Showalter Research Trust award. We thank members of the Drenan lab for helpful discussion, and Dr. Changdeng Hu and his laboratory for technical assistance.
Footnotes
The authors report no conflict of interest.
References
- Akopian G, Crawford C, Beal MF, et al. Decreased striatal dopamine release underlies increased expression of long-term synaptic potentiation at corticostriatal synapses 24 h after 3-nitropropionic-acid-induced chemical hypoxia. J Neurosci. 2008;28:9585–9597. doi: 10.1523/JNEUROSCI.5698-07.2008. [DOI] [PMC free article] [PubMed] [Google Scholar]
- Azam L, Maskos U, Changeux JP, Dowell CD, Christensen S, De Biasi M, McIntosh JM. α-Conotoxin BuIA[T5A;P6O]: a novel ligand that discriminates between α6β4 and α6β2 nicotinic acetylcholine receptors and blocks nicotine-stimulated norepinephrine release. FASEB J. 2010;24:5113–5123. doi: 10.1096/fj.10-166272. [DOI] [PMC free article] [PubMed] [Google Scholar]
- Bobrovskaya L, Gilligan C, Bolster EK, Flaherty JJ, Dickson PW, Dunkley PR. Sustained phosphorylation of tyrosine hydroxylase at serine 40: a novel mechanism for maintenance of catecholamine synthesis. J Neurochem. 2007;100:479–489. doi: 10.1111/j.1471-4159.2006.04213.x. [DOI] [PubMed] [Google Scholar]
- Bordia T, Grady SR, McIntosh JM, Quik M. Nigrostriatal damage preferentially decreases a subpopulation of α6β2* nAChRs in mouse, monkey, and Parkinson’s disease striatum. Mol Pharmacol. 2007;72:52–61. doi: 10.1124/mol.107.035998. [DOI] [PubMed] [Google Scholar]
- Bradford MM. A rapid and sensitive method for the quantitation of microgram quantities of protein utilizing the principle of protein-dye binding. Anal Biochem. 1976;72:248–254. doi: 10.1006/abio.1976.9999. [DOI] [PubMed] [Google Scholar]
- Britt JP, McGehee DS. Presynaptic opioid and nicotinic receptor modulation of dopamine overflow in the nucleus accumbens. J Neurosci. 2008;28:1672–1681. doi: 10.1523/JNEUROSCI.4275-07.2008. [DOI] [PMC free article] [PubMed] [Google Scholar]
- Cachope R, Mateo Y, Mathur BN, Irving J, Wang HL, Morales M, Lovinger DM, Cheer JF. Selective activation of cholinergic interneurons enhances accumbal phasic dopamine release: setting the tone for reward processing. Cell Rep. 2012;2:33–41. doi: 10.1016/j.celrep.2012.05.011. [DOI] [PMC free article] [PubMed] [Google Scholar]
- Cohen BN, Mackey ED, Grady SR, et al. Nicotinic cholinergic mechanisms causing elevated dopamine release and abnormal locomotor behavior. Neuroscience. 2012;200:31–41. doi: 10.1016/j.neuroscience.2011.10.047. [DOI] [PMC free article] [PubMed] [Google Scholar]
- Corrigall WA, Coen KM, Adamson KL. Self-administered nicotine activates the mesolimbic dopamine system through the ventral tegmental area. Brain Res. 1994;653:278–284. doi: 10.1016/0006-8993(94)90401-4. [DOI] [PubMed] [Google Scholar]
- Cragg SJ. Variable dopamine release probability and short-term plasticity between functional domains of the primate striatum. J Neurosci. 2003;23:4378–4385. doi: 10.1523/JNEUROSCI.23-10-04378.2003. [DOI] [PMC free article] [PubMed] [Google Scholar]
- Cragg SJ, Hille CJ, Greenfield SA. Dopamine release and uptake dynamics within nonhuman primate striatum in vitro. J Neurosci. 2000;20:8209–8217. doi: 10.1523/JNEUROSCI.20-21-08209.2000. [DOI] [PMC free article] [PubMed] [Google Scholar]
- Dash B, Bhakta M, Chang Y, Lukas RJ. Modulation of recombinant, α2*, α3* or α4*-nicotinic acetylcholine receptor (nAChR) function by nAChR β3 subunits. J Neurochem. 2012;121:349–361. doi: 10.1111/j.1471-4159.2012.07685.x. [DOI] [PMC free article] [PubMed] [Google Scholar]
- Doyon WM, Thomas AM, Ostroumov A, Dong Y, Dani JA. Potential substrates for nicotine and alcohol interactions: A focus on the mesocorticolimbic dopamine system. Biochem Pharmacol. 2013 doi: 10.1016/j.bcp.2013.07.007. [DOI] [PMC free article] [PubMed] [Google Scholar]
- Drenan RM, Grady SR, Steele AD, McKinney S, Patzlaff NE, McIntosh JM, Marks MJ, Miwa JM, Lester HA. Cholinergic modulation of locomotion and striatal dopamine release is mediated by α6α4* nicotinic acetylcholine receptors. J Neurosci. 2010;30:9877–9889. doi: 10.1523/JNEUROSCI.2056-10.2010. [DOI] [PMC free article] [PubMed] [Google Scholar]
- Drenan RM, Grady SR, Whiteaker P, et al. In vivo activation of midbrain dopamine neurons via sensitized, high-affinity α6* nicotinic acetylcholine receptors. Neuron. 2008;60:123–136. doi: 10.1016/j.neuron.2008.09.009. [DOI] [PMC free article] [PubMed] [Google Scholar]
- Drenan RM, Lester HA. Insights into the neurobiology of the nicotinic cholinergic system and nicotine addiction from mice expressing nicotinic receptors harboring gain-of-function mutations. Pharmacol Rev. 2012;64:869–879. doi: 10.1124/pr.111.004671. [DOI] [PMC free article] [PubMed] [Google Scholar]
- Dunkley PR, Bobrovskaya L, Graham ME, von Nagy-Felsobuki EI, Dickson PW. Tyrosine hydroxylase phosphorylation: regulation and consequences. J Neurochem. 2004;91:1025–1043. doi: 10.1111/j.1471-4159.2004.02797.x. [DOI] [PubMed] [Google Scholar]
- Dwoskin LP, Wooters TE, Sumithran SP, et al. N,N′-Alkane-diyl-bis-3-picoliniums as nicotinic receptor antagonists: inhibition of nicotine-evoked dopamine release and hyperactivity. J Pharmacol Exp Ther. 2008;326:563–576. doi: 10.1124/jpet.108.136630. [DOI] [PMC free article] [PubMed] [Google Scholar]
- Engle SE, Broderick HJ, Drenan RM. Local application of drugs to study nicotinic acetylcholine receptor function in mouse brain slices. J Vis Exp. 2012:e50034. doi: 10.3791/50034. [DOI] [PMC free article] [PubMed] [Google Scholar]
- Engle SE, Shih PY, McIntosh JM, Drenan RM. α4α6β2* Nicotinic Acetylcholine Receptor Activation on Ventral Tegmental Area Dopamine Neurons Is Sufficient to Stimulate a Depolarizing Conductance and Enhance Surface AMPA Receptor Function. Mol Pharmacol. 2013;84:393–406. doi: 10.1124/mol.113.087346. [DOI] [PMC free article] [PubMed] [Google Scholar]
- Exley R, Clements MA, Hartung H, McIntosh JM, Cragg SJ. α6-Containing Nicotinic Acetylcholine Receptors Dominate the Nicotine Control of Dopamine Neurotransmission in Nucleus Accumbens. Neuropsychopharmacology. 2007;21:21. doi: 10.1038/sj.npp.1301617. [DOI] [PubMed] [Google Scholar]
- Exley R, Maubourguet N, David V, et al. Distinct contributions of nicotinic acetylcholine receptor subunit α4 and subunit α6 to the reinforcing effects of nicotine. Proc Natl Acad Sci U S A. 2011;108:7577–7582. doi: 10.1073/pnas.1103000108. [DOI] [PMC free article] [PubMed] [Google Scholar]
- Fossom LH, Sterling C, Tank AW. Activation of tyrosine hydroxylase by nicotine in rat adrenal gland. J Neurochem. 1991;57:2070–2077. doi: 10.1111/j.1471-4159.1991.tb06424.x. [DOI] [PubMed] [Google Scholar]
- Frahm S, Slimak MA, Ferrarese L, et al. Aversion to Nicotine Is Regulated by the Balanced Activity of β4 and α5 Nicotinic Receptor Subunits in the Medial Habenula. Neuron. 2011;70:522–535. doi: 10.1016/j.neuron.2011.04.013. [DOI] [PubMed] [Google Scholar]
- Grady SR, Murphy KL, Cao J, Marks MJ, McIntosh JM, Collins AC. Characterization of nicotinic agonist-induced [3H]dopamine release from synaptosomes prepared from four mouse brain regions. J Pharmacol Exp Ther. 2002;301:651–660. doi: 10.1124/jpet.301.2.651. [DOI] [PubMed] [Google Scholar]
- Griffith LC, Schulman H. The multifunctional Ca2+/calmodulin-dependent protein kinase mediates Ca2+-dependent phosphorylation of tyrosine hydroxylase. J Biol Chem. 1988;263:9542–9549. [PubMed] [Google Scholar]
- Haycock JW. Phosphorylation of tyrosine hydroxylase in situ at serine 8, 19, 31, and 40. J Biol Chem. 1990;265:11682–11691. [PubMed] [Google Scholar]
- Haycock JW, Ahn NG, Cobb MH, Krebs EG. ERK1 and ERK2, two microtubule-associated protein 2 kinases, mediate the phosphorylation of tyrosine hydroxylase at serine-31 in situ. Proc Natl Acad Sci U S A. 1992;89:2365–2369. doi: 10.1073/pnas.89.6.2365. [DOI] [PMC free article] [PubMed] [Google Scholar]
- Hendrickson LM, Guildford MJ, Tapper AR. Neuronal nicotinic acetylcholine receptors: common molecular substrates of nicotine and alcohol dependence. Front Psychiatry. 2013;4:29. doi: 10.3389/fpsyt.2013.00029. [DOI] [PMC free article] [PubMed] [Google Scholar]
- Larsson A, Jerlhag E, Svensson L, Soderpalm B, Engel JA. Is an alpha-conotoxin MII-sensitive mechanism involved in the neurochemical, stimulatory, and rewarding effects of ethanol? Alcohol. 2004;34:239–250. doi: 10.1016/j.alcohol.2004.10.002. [DOI] [PubMed] [Google Scholar]
- le Novere N, Zoli M, Lena C, Ferrari R, Picciotto MR, Merlo-Pich E, Changeux JP. Involvement of α6 nicotinic receptor subunit in nicotine-elicited locomotion, demonstrated by in vivo antisense oligonucleotide infusion. Neuroreport. 1999;10:2497–2501. doi: 10.1097/00001756-199908200-00012. [DOI] [PubMed] [Google Scholar]
- Lof E, Olausson P, deBejczy A, Stomberg R, McIntosh JM, Taylor JR, Soderpalm B. Nicotinic acetylcholine receptors in the ventral tegmental area mediate the dopamine activating and reinforcing properties of ethanol cues. Psychopharmacology (Berl) 2007;195:333–343. doi: 10.1007/s00213-007-0899-4. [DOI] [PubMed] [Google Scholar]
- Mackey ED, Engle SE, Kim MR, et al. α6* Nicotinic Acetylcholine Receptor Expression and Function in a Visual Salience Circuit. J Neurosci. 2012;32:10226–10237. doi: 10.1523/JNEUROSCI.0007-12.2012. [DOI] [PMC free article] [PubMed] [Google Scholar]
- Mameli-Engvall M, Evrard A, Pons S, Maskos U, Svensson TH, Changeux JP, Faure P. Hierarchical control of dopamine neuron-firing patterns by nicotinic receptors. Neuron. 2006;50:911–921. doi: 10.1016/j.neuron.2006.05.007. [DOI] [PubMed] [Google Scholar]
- McGranahan TM, Patzlaff NE, Grady SR, Heinemann SF, Booker TK. α4β2 nicotinic acetylcholine receptors on dopaminergic neurons mediate nicotine reward and anxiety relief. J Neurosci. 2011;31:10891–10902. doi: 10.1523/JNEUROSCI.0937-11.2011. [DOI] [PMC free article] [PubMed] [Google Scholar]
- Perez XA, Bordia T, McIntosh JM, Quik M. α6β2* and α4β2* nicotinic receptors both regulate dopamine signaling with increased nigrostriatal damage: relevance to Parkinson’s disease. Mol Pharmacol. 2010;78:971–980. doi: 10.1124/mol.110.067561. [DOI] [PMC free article] [PubMed] [Google Scholar]
- Perez XA, O’Leary KT, Parameswaran N, McIntosh JM, Quik M. Prominent role of α3/α6β2* nAChRs in regulating evoked dopamine release in primate putamen: effect of long-term nicotine treatment. Mol Pharmacol. 2009;75:938–946. doi: 10.1124/mol.108.053801. [DOI] [PMC free article] [PubMed] [Google Scholar]
- Picciotto MR, Zoli M, Rimondini R, Lena C, Marubio LM, Pich EM, Fuxe K, Changeux JP. Acetylcholine receptors containing the β2 subunit are involved in the reinforcing properties of nicotine. Nature. 1998;391:173–177. doi: 10.1038/34413. [DOI] [PubMed] [Google Scholar]
- Pons S, Fattore L, Cossu G, Tolu S, Porcu E, McIntosh JM, Changeux JP, Maskos U, Fratta W. Crucial role of α4 and α6 nicotinic acetylcholine receptor subunits from ventral tegmental area in systemic nicotine self-administration. J Neurosci. 2008;28:12318–12327. doi: 10.1523/JNEUROSCI.3918-08.2008. [DOI] [PMC free article] [PubMed] [Google Scholar]
- Powers MS, Broderick HJ, Drenan RM, Chester JA. Nicotinic acetylcholine receptors containing α6 subunits contribute to alcohol reward-related behaviours. Genes Brain Behav. 2013;12:543–553. doi: 10.1111/gbb.12042. [DOI] [PMC free article] [PubMed] [Google Scholar]
- Quik M, McIntosh JM. Striatal α6* nicotinic acetylcholine receptors: potential targets for Parkinson’s disease therapy. J Pharmacol Exp Ther. 2006;316:481–489. doi: 10.1124/jpet.105.094375. [DOI] [PubMed] [Google Scholar]
- Quik M, O’Leary K, Tanner CM. Nicotine and Parkinson’s disease: implications for therapy. Mov Disord. 2008;23:1641–1652. doi: 10.1002/mds.21900. [DOI] [PMC free article] [PubMed] [Google Scholar]
- Quik M, Park KM, Hrachova M, Mallela A, Huang LZ, McIntosh JM, Grady SR. Role for α6 nicotinic receptors in l-dopa-induced dyskinesias in parkinsonian mice. Neuropharmacology. 2012;63:450–459. doi: 10.1016/j.neuropharm.2012.04.029. [DOI] [PMC free article] [PubMed] [Google Scholar]
- Quik M, Wonnacott S. α6β2* and α4β2* nicotinic acetylcholine receptors as drug targets for Parkinson’s disease. Pharmacol Rev. 2011;63:938–966. doi: 10.1124/pr.110.003269. [DOI] [PMC free article] [PubMed] [Google Scholar]
- Radcliffe PM, Sterling CR, Tank AW. Induction of tyrosine hydroxylase mRNA by nicotine in rat midbrain is inhibited by mifepristone. J Neurochem. 2009;109:1272–1284. doi: 10.1111/j.1471-4159.2009.06056.x. [DOI] [PMC free article] [PubMed] [Google Scholar]
- Revah F, Bertrand D, Galzi JL, Devillers-Thiery A, Mulle C, Hussy N, Bertrand S, Ballivet M, Changeux JP. Mutations in the channel domain alter desensitization of a neuronal nicotinic receptor. Nature. 1991;353:846–849. doi: 10.1038/353846a0. [DOI] [PubMed] [Google Scholar]
- Rice ME, Cragg SJ. Nicotine amplifies reward-related dopamine signals in striatum. Nat Neurosci. 2004;7:583–584. doi: 10.1038/nn1244. [DOI] [PubMed] [Google Scholar]
- Salminen O, Drapeau JA, McIntosh JM, Collins AC, Marks MJ, Grady SR. Pharmacology of α-Conotoxin MII-Sensitive Subtypes of Nicotinic Acetylcholine Receptors Isolated by Breeding of Null Mutant Mice. Mol Pharmacol. 2007;71:1563–1571. doi: 10.1124/mol.106.031492. [DOI] [PubMed] [Google Scholar]
- Salminen O, Murphy KL, McIntosh JM, Drago J, Marks MJ, Collins AC, Grady SR. Subunit composition and pharmacology of two classes of striatal presynaptic nicotinic acetylcholine receptors mediating dopamine release in mice. Mol Pharmacol. 2004;65:1526–1535. doi: 10.1124/mol.65.6.1526. [DOI] [PubMed] [Google Scholar]
- Schulte A, Chow RH. A simple method for insulating carbon-fiber microelectrodes using anodic electrophoretic deposition of paint. Anal Chem. 1996;68:3054–3058. doi: 10.1021/ac960210n. [DOI] [PubMed] [Google Scholar]
- Serova L, Sabban EL. Involvement of alpha 7 nicotinic acetylcholine receptors in gene expression of dopamine biosynthetic enzymes in rat brain. J Pharmacol Exp Ther. 2002;303:896–903. doi: 10.1124/jpet.102.039198. [DOI] [PubMed] [Google Scholar]
- Slotkin TA, Seidler FJ, Lau C, Bartolome J, Schanberg SM. Effects of chronic chlorisondamine administration on the sympatho-adrenal axis. Biochem Pharmacol. 1976;25:1311–1315. doi: 10.1016/0006-2952(76)90095-2. [DOI] [PubMed] [Google Scholar]
- Smith PK, Krohn RI, Hermanson GT, et al. Measurement of protein using bicinchoninic acid. Anal Biochem. 1985;150:76–85. doi: 10.1016/0003-2697(85)90442-7. [DOI] [PubMed] [Google Scholar]
- Tapper AR, McKinney SL, Nashmi R, et al. Nicotine activation of α4* receptors: sufficient for reward, tolerance, and sensitization. Science. 2004;306:1029–1032. doi: 10.1126/science.1099420. [DOI] [PubMed] [Google Scholar]
- Threlfell S, Lalic T, Platt NJ, Jennings KA, Deisseroth K, Cragg SJ. Striatal dopamine release is triggered by synchronized activity in cholinergic interneurons. Neuron. 2012;75:58–64. doi: 10.1016/j.neuron.2012.04.038. [DOI] [PubMed] [Google Scholar]
- Walaas SI, Aswad DW, Greengard P. A dopamine- and cyclic AMP-regulated phosphoprotein enriched in dopamine-innervated brain regions. Nature. 1983;301:69–71. doi: 10.1038/301069a0. [DOI] [PubMed] [Google Scholar]
- Zhang T, Zhang L, Liang Y, Siapas AG, Zhou FM, Dani JA. Dopamine signaling differences in the nucleus accumbens and dorsal striatum exploited by nicotine. J Neurosci. 2009;29:4035–4043. doi: 10.1523/JNEUROSCI.0261-09.2009. [DOI] [PMC free article] [PubMed] [Google Scholar]
- Zhuang X, Oosting RS, Jones SR, Gainetdinov RR, Miller GW, Caron MG, Hen R. Hyperactivity and impaired response habituation in hyperdopaminergic mice. Proc Natl Acad Sci U S A. 2001;98:1982–1987. doi: 10.1073/pnas.98.4.1982. [DOI] [PMC free article] [PubMed] [Google Scholar]