

Abstract
Purpose
To collect diffusion tensor imaging (DTI) at multiple diffusion times Td in skeletal muscle in normal subjects and chronic exertional compartment syndrome (CECS) patients and analyze the data with the random permeable barrier model (RPBM) for biophysical specificity.
Materials and Methods
Using an IRB-approved HIPAA-compliant protocol, seven patients with clinical suspicion of CECS and eight healthy volunteers underwent DTI of the calf muscle in a Siemens MAGNETOM Verio 3-T scanner at rest and after treadmill exertion at 4 different diffusion times. Radial diffusion values λrad were computed for each of 7 different muscle compartments and analyzed with RPBM to produce estimates of free diffusivity D0, fiber diameter a, and permeability κ. Fiber diameter estimates were compared with measurements from literature autopsy reference for several compartments. Response factors (post/pre-exercise ratios) were computed and compared between normal controls and CECS patients using a mixed-model two-way analysis of variance.
Results
All subjects and muscle compartments showed nearly time-independent diffusion along and strongly time-dependent diffusion transverse to the muscle fibers. RPBM estimates of fiber diameter correlated well with corresponding autopsy reference. D0 showed significant (p<0.05) increases with exercise for volunteers, and a increased significantly (p<0.05) in volunteers. At the group level, response factors of all three parameters showed trends differentiating controls from CECS patients, with patients showing smaller diameter changes (p=0.07), and larger permeability increases (p=0.07) than controls.
Conclusions
Time-dependent diffusion measurements combined with appropriate tissue modeling can provide enhanced microstructural specificity for in vivo tissue characterization. In CECS patients, our results suggest that high-pressure interfiber edema elevates free diffusion and restricts exercise-induced fiber dilation. Such specificity may be useful in differentiating CECS from other disorders or in predicting its response to either physical therapy or fasciotomy.
Keywords: DTI, stimulated echo, chronic exertional compartment syndrome, skeletal muscle, exercise, time-dependent diffusion, random permeable barrier model
INTRODUCTION
Diffusion tensor imaging (DTI) provides quantitative markers of tissue microstructure and can be used as a probe in the evaluation of skeletal muscle disease [1–4]. In chronic exertional compartment syndrome (CECS) [5–7], muscle compartments retain fluid following exercise, leading to elevated pressure, hypoperfusion, pain, and ischemia. Since current standard diagnostic and therapeutic tools, including intracompartmental pressure measurements and fasciotomy, are invasive and inconsistently successful, noninvasive MRI markers present an attractive alternative. T2 signal increase is a known marker of post-exercise muscular edema [8–10], and recently long diffusion time DTI [11] showed that diffusion anisotropy changes occur in CECS.
Restricted or hindered diffusion is the core contrast mechanism for most clinical applications of diffusion-weighted MRI. So far, most implementations employ a single diffusion time, often driven by practical concerns of acquisition time, hardware limitations or signal-to-noise ratio. However, controlled variation of the diffusion time, and corresponding modulation of the degree of restricted diffusion, can provide enhanced specificity and quantification of such properties as pore size, shape, connectivity, and permeability [12].
The initial reduction of measured diffusion below its bulk value at short diffusion time is given by the ratio of the diffusion length to the confining length scale (or more generally, to the inverse surface-to-volume ratio) [13–15]. This short-time limit applies when the diffusion length is much smaller than the curvature radius and/or compartment size, which practically requires very short diffusion times, of the order of milliseconds for <10 μm pores. Correspondingly, the utility of this universal limit has been appreciated in high-gradient and/or large-pore studies in, e.g., water-saturated geological media [16], water-filled trabecular bone [17], fluid-filled bead packs [13], or gas diffusion in bead packs [18]. In clinical MRI systems, unfortunately, the short diffusion time regime is typically less accessible for probing mesoscopic architecture (~1–10 μm) in biological tissue, due to gradient strength limitations.
Very long diffusion times, on the other hand, are more widely feasible, especially in the clinic, and can maximize restricted diffusion contrast. However, the tortuosity encoded in this limit is not always microstructurally specific. Relating the asymptotic diffusion coefficient D∞ to the mesoscopic geometry of restrictions has remained a challenging problem over more than a century.
In this work, we propose that protocols employing intermediate diffusion times spanning and quantifying the transition between these regimes may potentially provide both sensitivity and enhanced quantification of mesoscopic structural complexity in vivo for certain tissues. Some examples exist within biological tissue characterization [19,20] and in clinical scanners. Hyperpolarized gas diffusion studies in the lung make specific use of diffusion time given the range of length scales available to gas phase nuclei [18,21–23]. Time-dependent diffusion results in ex vivo muscle tissue [24,25] showed clear reduction of radial diffusion with time in the time range of 30–800 ms, as compared with largely time-independent axial diffusion along the fiber direction. Time-dependent diffusion of metabolites within in vivo skeletal muscle has shed light on phosphate diffusion in normal muscle metabolism [26]. Several muscle studies in clinical MR scanners have begun to employ stimulated echo sequences at somewhat longer diffusion times (200–400 ms), both for adjusted relaxation weighting and higher structural sensitization [27–29]. A recent study demonstrated stronger differentiation of normal controls from CECS patients at long diffusion times (1000 ms) than at conventionally short ones (30 ms)[11]. The diffusion time range of 500–1000 ms is thus highly sensitive to structural confinement, primarily via the sarcolemma membrane.
Overall, maximizing structural sensitivity is only one part of a successful diagnostic tool; optimal results are expected when such data is combined with an appropriate mesoscopic model for the tissue of interest. The recently proposed random permeable barrier model (RPBM) [30] considers water diffusion hindered by a network of randomly oriented semi-permeable membranes, a pattern that is well-suited to the topology and axial symmetry of skeletal muscle (Figure 1, taken from Ref. [30] and [31]), as shown in its initial validation in ex vivo data [32] and in normal controls [29,33]. RPBM has been validated both analytically and in simulations over a wide range of parameters [30]. In the context of myofiber architecture, it allows analysis of transverse (or radial) diffusion at several diffusion times to estimate three parameters: free diffusion D0, fiber diameter a calculated from the surface-to-volume ratio S/V of the sarcolemma, and its permeability κ. In the present study, time-dependent diffusion data is collected and analyzed with RPBM in the calf muscles of normal control volunteers and suspected CECS patients, in order to better understand and illustrate the microscopic pathophysiology of CECS and contribute to the development of tools to guide appropriate therapy.
Figure 1.
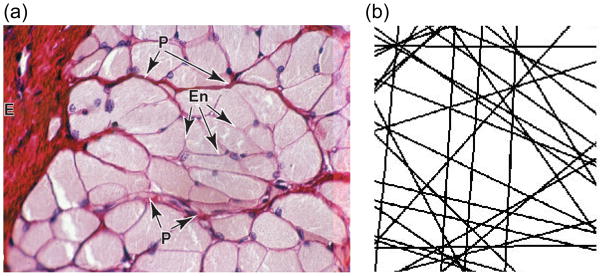
(a) Cross-sectional histology slide (from Ref. (31)) of skeletal muscle fibers, showing myofibers surrounded by thin endomysium (En). (b) Sketch of permeable barrier pattern (adapted from Ref. (30)) underlying the random permeable membrane model (RPBM), evoking the same topology of skeletal muscle.
METHODS
In this HIPAA-compliant study approved by the local institutional review board (IRB), seven patients (4 F, age 22±6 years, range 15 to 30 years; 3 M, age 24±10 years, range 18 to 36 years) with clinical suspicion of CECS, and eight healthy volunteers (2 F, age 29±1 years, range 28 to 29 years; 6 M, age 27±3 years, range 21 to 29 years) provided written informed consent and underwent diffusion tensor imaging in the lower-leg muscles in a wide-bore MAGNETOM Verio 3-T scanner (Siemens AG, Healthcare Sector, Erlangen, Germany) with a unilateral 15-channel knee coil. Subjects’ legs were not suspended, resting on the table and coil. A portion of these data at fixed diffusion times were previously reported [11]. DTI results were obtained both before and after at least 10 minutes of treadmill exercise challenge. Subjects came off the scanner table and jogged on a commercial exercise treadmill (Reebok S 9.80, Model#RBTL69608.0), at their own pace and resistance level, for 10 minutes or, in the case of patients, until pain onset, up to a maximum of 30 minutes. Subjects were then quickly repositioned on the scanner bed for the post-exercise scan. The average time between the last pre-exercise scan and the first post-exercise scan was 17.7± 5.0 minutes. The first and last DTI scans occurred 3.9 ± 1.9 minutes and 12.4 ± 6.7 minutes, respectively, following repositioning on the scanner table.
Axial DTI used a SPAIR fat-saturated stimulated-echo diffusion sequence with echo-planar imaging (EPI) readout (TR/TE = (10700−12400)/(42) ms, 64 × 64 × 10 matrix, 3 × 3 × 5 mm3 resolution, 6 diffusion directions, b = 0, 500 s/mm2, 3 averages) and adjustable mixing time TM. Four different effective diffusion times Td = TM + TE/2 of 30, 170, 520, and 1020 ms were acquired by varying TM. One patient and one volunteer had Td of 70 ms rather than 170 ms. One patient had TE of 31 ms for TM=150 ms and 1000 ms. The b-value of 500 s/mm2 was used for consistency with the literature for optimum muscle sensitivity [34–37].
The stimulated-echo diffusion preparation, a prototype vendor sequence, used monopolar gradients in the first and third intervals of the sequence, followed by an echo-planar imaging (EPI) readout [28,38], to enable long diffusion times and correspondingly large diffusion lengths up to (2DTd)1/2 ~ 50 μm for amplified microstructural sensitivity. Spoilers were included in the mixing time interval and, for the b=0 acquisition, in the 1st and 3rd intervals. For the b-value of 500 s/mm2 at the longest diffusion time (1020 ms), the diffusion gradient moment on one axis (59 mT/m ms) was close enough to those of unbalanced spoiler (17 mT/m ms) and slice-selective imaging gradients (8 mT/m ms) that the full diffusion-encoding matrix (“b-matrix”) was required in the diffusion tensor inversion to obtain quantitative accuracy [39–42]. The prototype vendor sequence software on the MAGNETOM Verio platform calculated the full b-matrix for both the nominally unweighted (b0) and diffusion-weighted images, as previously reported [11]. The sum of the diagonal b-matrix elements for the nominally unweighted (b0) images ranged from 3 s/mm2 at Td = 30 ms to 145 s/mm2 at Td = 1020 ms, illustrating the necessity for full b-matrix consideration.
Phantom validation
In order to validate the analysis procedure, DTI scans with the same imaging protocol described above were acquired in the Verio 3-T scanner with a range of mixing times TM (30 ms to 1000 ms) in a water phantom having isotropic, time-independent diffusion. The calculated b-matrices were employed in the DTI estimation of the water data. A rectangular region of interest (ROI) was placed on the DTI parametric maps, and mean values and standard deviations of all parameters (λ1, λ2, λ3. MD, FA) were collected for all diffusion times both with and without the b-matrix corrections. Mean values and standard deviations for ROIs in 10 slices were computed.
Human subjects
DTI data were processed offline (Igor Pro, Wavemetrics, Portland, OR, USA), incorporating the full b-matrices generated by the vendor software, to generate maps of MD, FA, and diffusion eigenvalues (λ1, λ2, λ3) for each diffusion time. Regions of interest (ROI) were manually segmented on axial b0 images, separately for pre- and post-exercise scans, enclosing entire muscle compartments: anterior tibialis (AT), extensor digitorum longus (EDL), peroneus longus (PL), posterior tibialis (PT), soleus (SOL), gastrocnemius medialis (GM), and gastrocnemius lateralis (GL). For each muscle compartment, mean DTI metrics were evaluated in each slice ROI, and the set of values for all slices were averaged as a representative value. The same ROIs were used to sample the same muscle compartments in each diffusion time dataset. Signal-to-noise ratio (SNR) of DWI at b = 0 and b = 500 s/mm2 were separately evaluated for each subject, exercise condition, and muscle compartment by dividing the mean signal intensity in each compartment ROI by the standard deviation of signal intensity in a region outside the leg, and averaging results from different slices, directions, and compartments in a given subject. Similarly, standard deviation across averages and diffusion directions, normalized to the mean signal intensity, was also calculated for each muscle compartment separately, and the results averaged for each subject to generate a normalized standard deviation (NSD).
From the ROI-sampled DTI data, radial diffusivity was calculated as λrad = (λ2 + λ3)/2 for each Td and muscle compartment, and its time dependence λrad(t) was fitted to the random permeable membrane model (RPBM) [30,33] to extract free diffusivity D0, the surface-to-volume ratio S/V from which we determine characteristic fiber diameter a, and myofiber membrane permeability κ. The RPBM analysis was performed with Matlab software (Mathworks, Inc., Natick, MA, USA), whereby the input for the non-linear least-squares fitting procedure is the RPBM time-dependent diffusion coefficient D(t). As D(t) has no closed form, it was derived from the closed-form expression of the RPBM frequency-dependent diffusion coefficient D(ω), Ref. [30].
| (1) |
using the numerical Fourier integration procedure outlined around Eq. (3) of Ref. [30] In Eq. (1) above, the effective volume fraction of membranes ζ = (D0/2κ d)(S/V) quantifies the membranes’ ability to hinder the diffusion in d=2 dimensions, with S/V the surface-to-volume ratio of the membranes. The parameter characterizes a dimensionless frequency, while τ = D0/(2κ)2 represents an effective time scale associated with transport through a single membrane [30]. The numerical integration yielding D(t) was performed in Matlab using the quad routine. Characteristic fiber diameters were obtained based on the fitted S/V value via an approximate relation a = 4V/S and compared with literature values from corresponding muscle groups from quantitative analysis of normal autopsy specimens [43].
Statistical analysis
For each muscle group of each subject a response factor ratio was computed for each parameter as the value post-exercise divided by the value pre-exercise. Unequal variance t tests were used to compare volunteers to the combined group of CECS-affected muscle and normal muscle groups among patients in terms of the mean response factor ratio and the pre- and post-exercise levels of each parameter for each muscle group. Pooling data from all muscle groups into a single overall analysis, mixed-model two-way analysis of variance was used to compare volunteers to patients in terms of the response factor ratio and the pre- and post-exercise levels of each parameter averaged over muscle groups. The model included muscle compartment as a fixed blocking factor and subject group as a fixed classification factor. For the mixed-model analysis of the response factor ratios, the dependent variable was the observed ratio minus unity. In this way, a test of the intercept assessed whether the response factor ratio was different from 1 and a significant group effect still implied that the groups were different in terms of the ratios on their original scale of measurement. To account for statistical dependencies among measures from the same subject, the correlation structure was modeled by assuming responses to be symmetrically correlated when acquired from the same subject and independent when derived from different subjects. The error variance was allowed to differ across comparison groups to remove the unnecessary assumption of variance homogeneity. All tests were conducted at the two-sided 5% comparison-wise significance level using SAS 9.3 (SAS Institute, Cary, NC, USA).
RESULTS
Water phantom
Water phantom DTI metrics as a function of mixing time with and without b-matrix correction are shown in Figure 2. Without correction, the water mean diffusivity shows artificial reduction with diffusion time, and fractional anisotropy artificially increases. With the correct b-matrices, the mean diffusivity is time-independent, and the FA is at a minimal level for all diffusion times.
Figure 2.

Diffusion coefficient of a water phantom measured with STEAM-DTI at variable diffusion time Td with (closed symbols) and without (open symbols) complete b-matrix correction.
Human subjects
Table 1 shows SNR and NSD results for the subjects in this study as a function of b-value, diffusion time, and exercise condition. SNR drops at higher diffusion time due to T1-weighting, but remains sufficiently high (~36 for a single DWI) even at b = 500 s/mm2, so that noise bias is negligible. NSD values are consistent with other studies [38]. Exercise, diffusion-weighting, and longer diffusion time all tend to increase NSD, but only slightly, suggesting a comparable noise statistics for all diffusion times in this study. Regionally, average NSD values were similar (within 17% of the mean) for all muscle compartments except the posterior tibialis (PT), whose average NSD values were 33% higher than the mean. This additional variance likely originates from pulsation of neurovascular bundles contained in the PT. However, the NSD values are not sufficiently elevated to merit exclusion of this compartment from the study.
Table 1.
Signal-to-noise ratio (SNR) and normalized standard deviation (NSD) for all muscle compartments evaluated in this study before/after exercise at two different diffusion times.
| b=0 s/mm2 (pre) | b=0 s/mm2 (post) | b=500 s/mm2 (pre) | b=500 s/mm2 (post) | |
|---|---|---|---|---|
| SNR (Td = 30 ms) | 84.7±18.5 | 85.9±14.1 | 51.3±10.8 | 49.3±8.1 |
| SNR (Td = 1.02 s) | 43.9±8.4 | 45.2±9.2 | 35.6±7.4 | 36.1±7.5 |
| NSD (Td = 30 ms) | 0.136±0.025 | 0.139±0.015 | 0.156±0.023 | 0.161±0.019 |
| NSD (Td = 1.02 s) | 0.148±0.028 | 0.154±0.019 | 0.166±0.026 | 0.173±0.019 |
Figure 3 shows exemplary b0 images and axial and radial diffusion maps at 4 different diffusion times in a healthy volunteer. The constant axial diffusion and the decrease in radial diffusion with diffusion time are evident. Figure 4 shows average axial and radial eigenvalues as a function of diffusion time for 4 different muscle compartments from the healthy volunteers in this study, along with reported values in normal controls in the same compartments from several literature studies. Diffusion times were defined by (a) one-half of the echo time TE for studies [1,36,37,44] employing a standard twice-refocused spin echo sequence, or (b) one-half TE plus the mixing time TM for studies ([11,27,28] and this study) employing a stimulated echo sequence. In each compartment, the global trend confirms the significant time dependence of the radial diffusion and the near time independence of the axial diffusion. For example, in the anterior tibialis (AT), axial diffusion (λ1) values from this study decrease by only 12% with diffusion time, while transverse diffusion (λ2, λ3) values and mean diffusivity (MD) decrease markedly with diffusion time by more than 30% of their short-time value. This enhanced structural sensitivity is particularly emphasized by the studies with longer diffusion times. While some variability is to be expected given the range of acquisition parameters (TR/TE, b-values) in the cited studies, the global trend remains evident in the combined dataset.
Figure 3.

Example unweighted (b0) images, axial diffusion (λ1) maps, and radial diffusion (λrad) maps for a healthy volunteer as a function of diffusion time Td. Axial diffusion remains relatively constant with diffusion time while radial diffusion sharply decreases due to myofiber restrictions.
Figure 4.

Volunteer calf DTI measurements in the anterior tibialis (AT), soleus (SOL), gastrocnemius medialis (GM), gastrocnemius lateralis (GL) muscle from a range of literature studies as a function of experimental diffusion time Td.
Time-dependent radial diffusion values and RPBM fits are shown in Figures 5a and 5b before and after exercise in a volunteer GM compartment and CECS patient GM compartment, respectively. These examples show the typical good fit quality found in this study (pre/post exercise R2 values of 0.9953/1.0000 for this volunteer and 0.9997/0.9998 for this patient). The volunteer case showed an increase in both D0 (5.8%) and a (19.7%), while the patient case featured an increase in D0 (7.7 %) and decrease in a (9.2%); these features are reflected in the qualitative shape of the time-dependent curve fits. Globally, model fitting was successful (i.e. R2 values ranging from 0.9808 to 1.0000) in all 15*7 = 105 muscle compartment fits except 3 GL cases which produced unphysical order of magnitude estimates and were excluded from the statistical analysis.
Figure 5.

Time-dependence and model fits of radial diffusion in (a) volunteer GM compartment and (b) CECS patient GM compartment.
The distribution of mean values of each pre-exercise RPBM parameter (D0, a, κ) in volunteers and patients across muscle compartments is shown in Figure 6a–c. Anterior muscle compartments (AT, EDL, PT, PL) tend to have larger free diffusivity D0 and smaller fiber diameter a than posterior compartments (SOL, GM, GL). Permeability κ is largely equivalent across all muscle groups, with the exception of larger values in GL. No significant control/patient differences between absolute RPBM parameters at the muscle compartment level were found. We found correlation of pre-exercise fiber diameters in several muscle compartments with estimates from autopsy literature [43], showing good qualitative agreement that posterior compartments (SOL, GM) have generally larger fiber diameter than anterior compartments (AT, PL) (Figure 6d). Quantitatively, the fiber diameter estimates from diffusion MR are generally less than those from autopsy analysis. This bias may originate from the conversion of surface-to-volume ratio (the native RPBM parameter) to fiber diameter via a = 4V/S, which may not be accurate for the two-dimensional geometry of random barriers (Figure 1). Also, while an intuitive estimate of size, the fiber diameter is somewhat ill-defined since myofiber cross-sections are not circular. In the future, comparison to a histological measurement of the S/V ratio may provide a more unbiased validation for the RPBM.
Figure 6.

Mean pre-exercise values of RPBM parameters (a) D0, (b) a, and (c) κ in separate muscle compartments in volunteers and CECS patients. Error bars reflect standard deviation within the subject group. (d) Correlation of fiber diameters in several muscle compartments derived from time-dependent diffusion MRI in this study to those obtained from autopsy reference (43). Error bars reflect standard deviation within the subject and compartment group.
Figure 7 and Table 2 show the subject group comparison of response factors of each RPBM parameter, as well as axial diffusion λ1 at Td = 1.02 s, including response factors from all muscle compartments; as normalized quantities, this collective consideration is dimensionally consistent albeit regionally nonspecific. Long-time λ1 increased significantly for both volunteers (3%, p<0.05) and patients (5%, p<0.05), and the λ1 response factors significantly differentiated volunteers from patients (p<0.05). D0 showed significant (p<0.05) change from baseline for controls, and significant fiber diameter increases (p<0.05) for volunteers. Quantitatively, free diffusion D0 increased by 5% in volunteers and 10% in CECS subjects. Fiber diameter a increased by 21% on average in volunteers, but changes negligibly (−3%) in patients. Permeability κ decreased slightly (−7%) in volunteers but increased by 54% in patients. The volunteer-vs.-patient group comparisons of fiber diameter a and permeability κ trended towards significant differences (p=0.07 in both cases).
Figure 7.

Comparison of response factors of (a) long time axial diffusion λ1 and model parameters (b) free diffusivity D0, (c) fiber diameter a, and (d) permeability κ between volunteers and CECS patients. Error bars reflect 95% confidence intervals.
Table 2.
Response factors and t-test comparisons for RPBM parameters and long-time axial diffusion. For each subject group, the p-value is given from a two-sided t-test within the mixed model to assess whether the response factor ratio for each parameter was significantly different from 1. The p-value testing for significant differences between volunteer and patient groups is also given for each parameter.
| Parameter | Volunteers | Patients | p (Vol vs. Pts) | ||
|---|---|---|---|---|---|
| λ1(1.02s) | 1.03 ± 0.03 | <0.001 | 1.05 ± 0.04 | <0.001 | 0.014 |
| D0 | 1.05 ± 0.09 | 0.0259 | 1.10 ± 0.12 | 0.0689 | 0.294 |
| a | 1.21 ± 0.55 | 0.0263 | 0.97 ± 0.29 | 0.7082 | 0.070 |
| κ | 0.93 ± 0.42 | 0.3368 | 1.54 ± 1.02 | 0.1799 | 0.074 |
Significant (p<0.05) results are shown in bold.
DISCUSSION
This study combines the collection of diffusion tensor metrics as a function of diffusion time with a biophysical model to produce structural metrics relevant to the target anatomy of skeletal muscle. The diffusion times required to interrogate the spatial scale of myofibers (30–50 μm) are several hundred milliseconds, which is accessible via stimulated-echo diffusion in clinical scanners. The stimulated-echo sequence is thus a useful module for providing DTI parametric maps with sufficient SNR for both image quality and quantification (see SNR values in Table 1) as well as the opportunity for more specific quantitative metrics. Likewise, fiber diameter estimates for individual compartments are in fairly good agreement with estimates from autopsy studies, as found previously [33], up to an overall scaling factor possibly related to transition from the surface-to-volume ratio to the fiber diameter, as discussed above. These results are an important demonstration of the quantitative potential associated with combining appropriately sensitized data with a biophysical model parametrized with the characteristics of the measured regime.
Beyond the scale estimations at baseline, the second element of this study addresses exercise response. As an interpretive summary, Figure 8 shows a hypothesized diagram of myofiber structural changes consistent with the RPBM parameter responses. In normal volunteers, myofibers dilate with exertion with little change in the extracellular (endomysium) space. In CECS patients, trapped interfascicular edema accumulates in the interfiber space, elevating pressure and prohibiting dilation, consistent with the negligible changes in fiber diameter a. This fluid accumulation also contributes to a higher free diffusivity D0 and possibly to higher apparent permeability κ due to the enlargement of a less confined compartment than the myofiber interior.
Figure 8.

Sketch of hypothesized muscle fiber configurations with pre- and post-exercise in volunteers or CECS patients.
While the changes following exertion may conceivably have multiple contributions [44–46], the RPBM model narrows the possibilities. Morphological dilation of myofibers (i.e. hypertrophy) is a well-known response to repeated mechanical loading, as has been observed in numerous studies of short- or long-term resistance training with quantitative histological analysis [47–50], particularly of type II fast-twitch fibers [51,52]. The biological processes driving this adaptation are complex, but typically involve production of more intrafiber contractile protein, requiring an enlargement of the sarcolemma. The current study evaluates acute response immediately after a single session of exercise, which may potentially involve various processes (temperature, edema, vascular changes, fiber structure). Elevated temperature likely plays a significant role. Water diffusion in muscle is known to increase by 2 %/°C [45]. Given the average increase of 3–5% in axial diffusion λ1 with exercise at long diffusion times (Table 2), it is likely that part (though not all) of the elevation in the transverse free diffusion D0 is due to temperature changes, especially in volunteers. Additionally, the RPBM modeling process and the group statistics of its parameters’ responses indicate a role of myofiber hypertrophy at the acute exercise response phase, mirroring and consistent with longer-term training changes. This observation is an example of the clarification brought about by appropriate biophysical modeling of time-dependent diffusion, which may not be as clear using single-time-point DTI [2,11,36,37,53,54]. Finally, the finding that CECS muscle groups do not dilate as pronouncedly as normal muscle, possibly due to the influence of high-pressure interfascicular edema [55], suggests diffusion MRI may differentiate CECS from other pathologies presenting with enhanced T2 signal intensity on conventional imaging.
As a complement to the interpretations above, discussion is warranted on the approximations inherent to the current form of RBPM and its application to the data in this study. Firstly, the single-compartment picture adopted in RPBM does not include an extracellular space (i.e. endomysium in skeletal muscle), which may have biased model estimates, since neither multi-compartment diffusion nor multi-compartment relaxation is considered, though both are known to be present in biological tissue, and may change independently with exercise. Given a fairly tight packing of myofibers in a bundle, we can view the “cells” in RPBM (Figure 1) as reflecting both intracellular and extracellular properties. This is an obvious oversimplification, because true extra-cellular space is topologically connected (one can travel across it without entering cells). In the limit of highly impermeable membranes, the RPBM would then strongly underestimate the overall tortuosity limit D∞. However, given that the effective “hindrance strength” of the membranes is not very large (ζ~1, i.e. permeability is not small), it is as probable for a water molecule to traverse cells as to travel around them within the extra-cellular space. Qualitatively, this means that whether the voids between cells are completely enclosed by membranes (as in RPBM) or are connected (as in reality), should not drastically affect model parameters. Similarly, within the single-compartment approximation, changes in the extracellular space may indirectly induce changes in apparent permeability κ, whose increase may be due to this change in the geometry rather than a change in the sarcolemma water transmission rate. In a related sense, a numerical study has not yet been performed to optimize the number and choice of measurements times or to analyze potential correlated errors between model parameters in the presence of random noise. Vascular effects are also not explicitly modeled. Given these issues, the exercise response phenomena represented in Figure 8 are at this point promising qualitative trends that would benefit from further quantitative verification. Finally, intracellular ultrastructure such as organelles and the sarcoplasmic reticulum are represented in RBPM within the ‘bulk’ hindered diffusivity D0, primarily because by the shortest diffusion time employed in this study (30 ms), water diffusion has fully explored their tortuosity and thus cannot fully quantify their scale. Thus, continued validation of the RBPM in physiological systems and clinically available sampling intervals is warranted to support its adoption as a clinical tool. Despite these important caveats, we postulate that the significant volume fraction of the fiber interior, the temporal regime accessible in clinical scanners, and the normalization of T2-relaxation effects from diffusion weighting, provide cogent justification for the use of RPBM for probing first-order microstructural values and alterations with exercise.
Beyond the approximations inherent to RPBM, this study had a number of limitations. The total number of subjects was small and the volunteer cohort was not number-, gender-, or age-matched, which may have contributed to the lack of significant differentiation at the individual compartment level. No eddy-current corrections were performed on the raw DW images prior to DTI processing. Our estimates of SNR were approximate but adequate for purposes of ensuring data fidelity. The DTI acquisitions did not use cardiac gating [38]. Regions of interest were prescribed directly onto the moderate resolution DW images, rather than transferred from those prescribed on co-registered higher resolution anatomical imaging. Parametric maps of DTI parameters were sampled at the ROI level for RPBM analysis, excluding interrogation of RPBM parameter intracompartmental heterogeneity. The RPBM does not include an extracellular space and could be generalized to incorporate one for a more accurate representation, albeit at a cost of acquiring more diffusion times to reliably determine more parameters. Finally, some variability existed in the timing of the exercise procedure, as previously noted [11] and indicated in the Methods section.
In conclusion, we have performed time-dependent DTI at 3T in the leg muscles of healthy volunteers and suspected CECS patients before and after exercise, and analyzed the results with a random permeable barrier model (RPBM). Model fitting detects the expected myofiber dilation in normal volunteer muscles, while this dilation is notably absent in CECS patients. Free diffusivity and apparent permeability metrics also show significantly different exercise response between the control and patient groups; increased interfiber fluid accumulation (muscular edema) may be a driving component of these observations. This study shows an example of quantitative specificity that is provided by the collection and analysis of time-dependent diffusion. In the case of CECS, this differentiation may help guide treatments that either relieve pressure directly (fasciotomy) or increase fiber integrity to modulate exchange. It is expected that analogous approaches may also provide useful biomarkers for other muscle diseases.
Acknowledgments
We thank Dr. Donald Rose MD, Dr. Laith Jazrawi MD, Dr. Robert Meislin MD, and Dr. Orrin Sherman MD (NYU Langone Medical Center) for referral of and consultation on the patients enrolled in this study.
Funding : NIH R21EB009435 (Sigmund)
ABBREVIATIONS
- DWI
diffusion weighted image
- DTI
diffusion tensor imaging
- CECS
chronic exertional compartment syndrome
- MRI
magnetic resonance imaging
- RPBM
random permeable barrier model
- S/V
surface-to-volume ratio
- EPI
echo-planar imaging
- ROI
region of interest
- AT
anterior tibialis
- EDL
extensor digitorum longus
- PL
peroneus longus
- PT
posterior tibialis
- SOL
soleus
- GM
gastrocnemius medialis
- GL
gastrocnemius lateralis
- TR
repetition time
- TE
echo time
- TM
mixing time
- Td
diffusion time
- SNR
signal-to-noise ratio
- NSD
normalized standard deviation
- MD
mean diffusivity
- FA
fractional anisotropy
- T2
transverse relaxation time
- T1
longitudinal relaxation time
- b0
unweighted diffusion image (b=0)
- λ1
primary diffusion eigenvalue, axial diffusivity, longitudinal diffusivity
- λ2
secondary diffusion eigenvalue
- λ3
tertiary diffusion eigenvalue
- λrad
radial diffusion
- D0
free diffusivity
- a
fiber diameter
- κ
permeability
- ζ
membrane volume fraction
- zω
dimensionless frequency
- τ
membrane transport time
References
- 1.Sinha S, Sinha U, Edgerton VR. In vivo diffusion tensor imaging of the human calf muscle. Journal of Magnetic Resonance Imaging. 2006;24(1):182–190. doi: 10.1002/jmri.20593. [DOI] [PubMed] [Google Scholar]
- 2.Galban CJ, Maderwald S, Uffmann K, de Greiff A, Ladd ME. Diffusive sensitivity to muscle architecture: a magnetic resonance diffusion tensor imaging study of the human calf. European Journal of Applied Physiology. 2004;93(3):253–262. doi: 10.1007/s00421-004-1186-2. [DOI] [PubMed] [Google Scholar]
- 3.Heemskerk AM, Drost MR, van Bochove GS, van Oosterhout MFM, Nicolay K, Strijkers GJ. DTI-based assessment of ischemia-reperfusion in mouse skeletal muscle. Magn Reson Med. 2006;56(2):272–281. doi: 10.1002/mrm.20953. [DOI] [PubMed] [Google Scholar]
- 4.Zaraiskaya T, Kumbhare D, Noseworthy MD. Diffusion tensor imaging in evaluation of human skeletal muscle injury. Journal of Magnetic Resonance Imaging. 2006;24(2):402–408. doi: 10.1002/jmri.20651. [DOI] [PubMed] [Google Scholar]
- 5.Blackman PG. A review of chronic exertional compartment syndrome in the lower leg. Med Sci Sports Exerc. 2000;32(3):S4–S10. doi: 10.1097/00005768-200003001-00002. [DOI] [PubMed] [Google Scholar]
- 6.Kiuru MJ, Mantysaari MJ, Pihlajamaki HK, Ahovuo JA. Evaluation of stress-related anterior lower leg pain with magnetic resonance imaging and intracompartmental pressure measurement. Milit Med. 2003;168(1):48–52. [PubMed] [Google Scholar]
- 7.Litwiller D, Amrami K, Dahm D, Smith J, Laskowski E, Stuart M, Felmlee J. Chronic exertional compartment syndrome of the lower extremities: improved screening using a novel dual birdcage coil and in-scanner exercise protocol. Skeletal Radiology. 2007;36(11):1067–1075. doi: 10.1007/s00256-007-0360-0. [DOI] [PubMed] [Google Scholar]
- 8.Andreisek G, White LM, Sussman MS, Langer DL, Patel C, Su JWS, Haider MA, Stainsby JA. T2*-Weighted and Arterial Spin Labeling MRI of Calf Muscles in Healthy Volunteers and Patients With Chronic Exertional Compartment Syndrome: Preliminary Experience. Am J Roentgenol. 2009;193(4):W327–W333. doi: 10.2214/AJR.08.1579. [DOI] [PubMed] [Google Scholar]
- 9.Saab G, Thompson RT, Marsh GD. Multicomponent T2 relaxation of in vivo skeletal muscle. Magn Reson Med. 1999;42(1):150–157. doi: 10.1002/(sici)1522-2594(199907)42:1<150::aid-mrm20>3.0.co;2-5. [DOI] [PubMed] [Google Scholar]
- 10.Ababneh Z, Beloeil H, Berde CB, Gambarota G, Maier SE, Mulkern RV. Biexponential parameterization of diffusion and T2 relaxation decay curves in a rat muscle edema model: decay curve components and water compartments. Magn Reson Med. 2005;54(3):524–531. doi: 10.1002/mrm.20610. [DOI] [PubMed] [Google Scholar]
- 11.Sigmund EE, Sui D, Ukpebor O, Baete S, Fieremans E, Babb JS, Mechlin M, Liu K, Kwon J, McGorty K, Hodnett PA, Bencardino J. Stimulated echo diffusion tensor imaging and SPAIR T2 -weighted imaging in chronic exertional compartment syndrome of the lower leg muscles. J Magn Reson Imaging. 2013;38(5):1073–1082. doi: 10.1002/jmri.24060. [DOI] [PMC free article] [PubMed] [Google Scholar]
- 12.Fordham EJ, Gibbs SJ, Hall LD. Partially restricted diffusion in a permeable sandstone: observations by stimulated echo PFG NMR. Magn Reson Imaging. 1994;12:279–284. doi: 10.1016/0730-725x(94)91536-9. [DOI] [PubMed] [Google Scholar]
- 13.Latour LL, Mitra PP, Kleinberg RL, Sotak CH. Time-dependent diffusion coefficient of fluids in porous media as a probe of surface-to-volume ratio. Journal of Magnetic Resonance Series A. 1993;101:342–346. [Google Scholar]
- 14.Sen PN, Schwartz LM, Mitra PP, Halperin BI. Surface relaxation and the long-time diffusion coefficient in porous media: Periodic geometries. Phys Rev B. 1994;49:215. doi: 10.1103/physrevb.49.215. [DOI] [PubMed] [Google Scholar]
- 15.Sen PN. Time-dependent diffusion coefficient as a probe of geometry. Concept Magn Reson A. 2004;23A(1):1–21. [Google Scholar]
- 16.Hurlimann MD, Helmer KG, Latour LL, Sotak CH. Restricted diffusion in sedimentary rocks. Determination of surface-to-volume ratio and surface relaxivity. J Magn Reson ser A. 1994;111:169–178. doi: 10.1016/0730-725x(94)91548-2. [DOI] [PubMed] [Google Scholar]
- 17.Sigmund EE, Cho H, Chen P, Byrnes S, Song Y-Q, Guo XE, Brown TR. Diffusion-based MR methods for bone structure and evolution. Magn Reson Med. 2008;59(1):28–39. doi: 10.1002/mrm.21281. [DOI] [PubMed] [Google Scholar]
- 18.Mair RW, Sen MN, Hurlimann MD, Patz S, Cory DG, Walsworth RL. The narrow pulse approximation and long length scale determination in xenon gas diffusion NMR studies of model porous media. Journal of Magnetic Resonance. 2002;156(2):202–212. doi: 10.1006/jmre.2002.2540. [DOI] [PubMed] [Google Scholar]
- 19.Helmer KG, Dardzinski BJ, Sotak CH. The application of porous-media theory to the investigation of time-dependent diffusion in in vivo systems. NMR Biomed. 1995;8:297–306. doi: 10.1002/nbm.1940080705. [DOI] [PubMed] [Google Scholar]
- 20.Latour LL, Svoboda K, Mitra PP, Sotak CH. Time-dependent diffusion of water in a biological model system. Proc Natl Acad Sci U S A. 1994;91(4):1229–1233. doi: 10.1073/pnas.91.4.1229. [DOI] [PMC free article] [PubMed] [Google Scholar]
- 21.Wang CB, Miller GW, Altes TA, de Lange EE, Cates GD, Mugler JP. Time dependence of He-3 diffusion in the human lung: Measurement in the long-time regime using stimulated echoes. Magn Reson Med. 2006;56(2):296–309. doi: 10.1002/mrm.20944. [DOI] [PubMed] [Google Scholar]
- 22.Peled S, Tseng CH, Sodickson AA, Mair RW, Walsworth RL, Cory DG. Single-shot diffusion measurement in laser-polarized Gas. J Magn Reson. 1999;140:320–324. doi: 10.1006/jmre.1999.1850. [DOI] [PMC free article] [PubMed] [Google Scholar]
- 23.Woods JC, Choong CK, Yablonskiy DA, Bentley J, Wong J, Pierce JA, Cooper JD, Macklem PT, Conradi MS, Hogg JC. Hyperpolarized He-3 diffusion MRI and histology in pulmonary emphysema. Magn Reson Med. 2006;56(6):1293–1300. doi: 10.1002/mrm.21076. [DOI] [PMC free article] [PubMed] [Google Scholar]
- 24.Kim S, Chi-Fishman G, Barnett AS, Pierpaoli C. Dependence on diffusion time of apparent diffusion tensor of ex vivo calf tongue and heart. Magn Reson Med. 2005;54(6):1387–1396. doi: 10.1002/mrm.20676. [DOI] [PubMed] [Google Scholar]
- 25.Tanner JE. Self diffusion of water in frog muscle. Biophysical Journal. 1979;28(1):107–116. doi: 10.1016/S0006-3495(79)85162-0. [DOI] [PMC free article] [PubMed] [Google Scholar]
- 26.Gabr RE, El-Sharkawy AM, Schar M, Weiss RG, Bottomley PA. High-energy phosphate transfer in human muscle: diffusion of phosphocreatine. Am J Physiol Cell Physiol. 2011;301(1):C234–241. doi: 10.1152/ajpcell.00500.2010. [DOI] [PMC free article] [PubMed] [Google Scholar]
- 27.Schwenzer NF, Steidle G, Martirosian P, Schraml C, Springer F, Claussen CD, Schick F. Diffusion tensor imaging of the human calf muscle: distinct changes in fractional anisotropy and mean diffusion due to passive muscle shortening and stretching. Nmr in Biomedicine. 2009;22(10):1047–1053. doi: 10.1002/nbm.1409. [DOI] [PubMed] [Google Scholar]
- 28.Steidle G, Schick F. Echoplanar diffusion tensor imaging of the lower leg musculature using eddy current nulled stimulated echo preparation. Magn Reson Med. 2006;55(3):541–548. doi: 10.1002/mrm.20780. [DOI] [PubMed] [Google Scholar]
- 29.Fieremans E, Lemberskiy G, Jensen JH, Novikov DS. Observation of Muscle Fiber Diameter Increase with Exercise Using Time-Dependent Diffusion. Proceedings of Scientific Meeting of International Society of Magnetic Resonance in Medicine; 2013; Salt Lake City. p. 489. [Google Scholar]
- 30.Novikov DS, Fieremans E, Jensen JH, Helpern JA. Random walks with barriers. Nat Phys. 2011;7(6):508–514. doi: 10.1038/nphys1936. [DOI] [PMC free article] [PubMed] [Google Scholar]
- 31.Mescher AL. Junqueira’s Basic Histology. China: McGraw-Hill Companies, Inc; 2013. [Google Scholar]
- 32.Novikov DS, Fieremans E, Jensen JH, Helpern JA. Characterizing microstructure of living tissues with time-dependent diffusion. 2012. Volume 2012arXiv1210.3014N: arXiv. [Google Scholar]
- 33.Fieremans E, Novikov DS, Sigmund EE, Liu K, Jensen JH, Helpern JA. In Vivo Measurement of Membrane Permeability and Fiber size in Calf Muscle Using Time-dependent DWI. Proceedings of Scientific Meeting, International Society for Magnetic Resonance in Medicine; 2011; Montreal. p. 1153. [Google Scholar]
- 34.Heemskerk AM, Sinha TK, Wilson KJ, Ding Z, Damon BM. Repeatability of DTI-based skeletal muscle fiber tracking. NMR Biomed. 2010;23(3):294–303. doi: 10.1002/nbm.1463. [DOI] [PMC free article] [PubMed] [Google Scholar]
- 35.Sinha S, Sinha U. Reproducibility analysis of diffusion tensor indices and fiber architecture of human calf muscles in vivo at 1. 5 Tesla in neutral and plantarflexed ankle positions at rest. J Magn Reson Imaging. 2011;34(1):107–119. doi: 10.1002/jmri.22596. [DOI] [PMC free article] [PubMed] [Google Scholar]
- 36.Deux JF, Malzy P, Paragios N, Bassez G, Luciani A, Zerbib P, Roudot-Thoraval F, Vignaud A, Kobeiter H, Rahmouni A. Assessment of calf muscle contraction by diffusion tensor imaging. European Radiology. 2008;18(10):2303–2310. doi: 10.1007/s00330-008-1012-z. [DOI] [PubMed] [Google Scholar]
- 37.Karampinos DC, King KF, Sutton BP, Georgiadis JG. Myofiber ellipticity as an explanation for transverse asymmetry of skeletal muscle diffusion MRI in vivo signal. Ann Biomed Eng. 2009;37(12):2532–2546. doi: 10.1007/s10439-009-9783-1. [DOI] [PMC free article] [PubMed] [Google Scholar]
- 38.Karampinos DC, Banerjee S, King KF, Link TM, Majumdar S. Considerations in high-resolution skeletal muscle diffusion tensor imaging using single-shot echo planar imaging with stimulated-echo preparation and sensitivity encoding. NMR Biomed. 2012;25(5):766–778. doi: 10.1002/nbm.1791. [DOI] [PMC free article] [PubMed] [Google Scholar]
- 39.Basser PJ, Mattiello J, Lebihan D. Estimation of the Effective Self-Diffusion Tensor from the Nmr Spin-Echo. Journal of Magnetic Resonance Series B. 1994;103(3):247–254. doi: 10.1006/jmrb.1994.1037. [DOI] [PubMed] [Google Scholar]
- 40.Mattiello J, Basser PJ, LeBihan D. The b matrix in diffusion tensor echo-planar imaging. Magn Reson Med. 1997;37(2):292–300. doi: 10.1002/mrm.1910370226. [DOI] [PubMed] [Google Scholar]
- 41.Kingsley PB. Introduction to diffusion tensor imaging mathematics: Part II. Anisotropy, diffusion-weighting factors, and gradient encoding schemes. Concept Magn Reson A. 2006;28A(2):123–154. [Google Scholar]
- 42.Haacke EM, Brown RW, Thompson MR, Venkatesan R. Magnetic Resonance Imaging: Physical Principles and Sequence Design. New York: Wiley; 1999. [Google Scholar]
- 43.Polgar J, Johnson MA, Weightma D, Appleton D. DATA ON FIBER SIZE IN 36 HUMAN MUSCLES - AUTOPSY STUDY. J Neurol Sci. 1973;19(3):307–318. doi: 10.1016/0022-510x(73)90094-4. [DOI] [PubMed] [Google Scholar]
- 44.Yanagisawa O, Kurihara T, Kobayashi N, Fukubayashi T. Strenuous resistance exercise effects on magnetic resonance diffusion parameters and muscle-tendon function in human skeletal muscle. J Magn Reson Imaging. 2011;34(4):887–894. doi: 10.1002/jmri.22668. [DOI] [PubMed] [Google Scholar]
- 45.Morvan D, Leroy-Willig A. Simultaneous measurements of diffusion and transverse relaxation in exercising skeletal muscle. Magn Reson Imaging. 1995;13(7):943–948. doi: 10.1016/0730-725x(95)02006-f. [DOI] [PubMed] [Google Scholar]
- 46.Okamoto Y, Kunimatsu A, Kono T, Nasu K, Sonobe J, Minami M. Changes in MR diffusion properties during active muscle contraction in the calf. Magn Reson Med Sci. 2010;9(1):1–8. doi: 10.2463/mrms.9.1. [DOI] [PubMed] [Google Scholar]
- 47.Hakkinen K, Pakarinen A, Kraemer WJ, Hakkinen A, Valkeinen H, Alen M. Selective muscle hypertrophy, changes in EMG and force, and serum hormones during strength training in older women. J Appl Physiol. 2001;91(2):569–580. doi: 10.1152/jappl.2001.91.2.569. [DOI] [PubMed] [Google Scholar]
- 48.Ivey FM, Tracy BL, Lemmer JT, NessAiver M, Metter EJ, Fozard JL, Hurley BF. Effects of strength training and detraining on muscle quality: age and gender comparisons. J Gerontol A Biol Sci Med Sci. 2000;55(3):B152–157. doi: 10.1093/gerona/55.3.b152. discussion B158–159. [DOI] [PubMed] [Google Scholar]
- 49.Mero AA, Hulmi JJ, Salmijarvi H, Katajavuori M, Haverinen M, Holviala J, Ridanpaa T, Hakkinen K, Kovanen V, Ahtiainen JP, Selanne H. Resistance training induced increase in muscle fiber size in young and older men. Eur J Appl Physiol. 2013;113(3):641–650. doi: 10.1007/s00421-012-2466-x. [DOI] [PubMed] [Google Scholar]
- 50.Sinha-Hikim I, Artaza J, Woodhouse L, Gonzalez-Cadavid N, Singh AB, Lee MI, Storer TW, Casaburi R, Shen R, Bhasin S. Testosterone-induced increase in muscle size in healthy young men is associated with muscle fiber hypertrophy. Am J Physiol Endocrinol Metab. 2002;283(1):E154–164. doi: 10.1152/ajpendo.00502.2001. [DOI] [PubMed] [Google Scholar]
- 51.Lundberg IE, Nader GA. Molecular effects of exercise in patients with inflammatory rheumatic disease. Nat Clin Pract Rheumatol. 2008;4(11):597–604. doi: 10.1038/ncprheum0929. [DOI] [PubMed] [Google Scholar]
- 52.Dastmalchi M, Alexanderson H, Loell I, Stahlberg M, Borg K, Lundberg IE, Esbjornsson M. Effect of physical training on the proportion of slow-twitch type I muscle fibers, a novel nonimmune-mediated mechanism for muscle impairment in polymyositis or dermatomyositis. Arthritis Rheum. 2007;57(7):1303–1310. doi: 10.1002/art.22996. [DOI] [PubMed] [Google Scholar]
- 53.Hatakenaka M, Matsuo Y, Setoguchi T, Yabuuchi H, Okafuji T, Kamitani T, Nishikawa K, Honda H. Alteration of proton diffusivity associated with passive muscle extension and contraction. J Magn Reson Imaging. 2008;27(4):932–937. doi: 10.1002/jmri.21302. [DOI] [PubMed] [Google Scholar]
- 54.Heemskerk AM, Sinha TK, Wilson KJ, Damon BM. Change in water diffusion properties with altered muscle architecture. Proceedings of Scientific Meeting, International Society for Magnetic Resonance in Medicine; 2008; Toronto. p. 1787. [Google Scholar]
- 55.Rominger MB, Lukosch CJ, Bachmann GF. MR imaging of compartment syndrome of the lower leg: a case control study. European Radiology. 2004;14(8):1432–1439. doi: 10.1007/s00330-004-2305-5. [DOI] [PubMed] [Google Scholar]