

Abstract
Efforts to identify lupus-associated causal variants in the FAM167A/BLK locus on 8p21 are hampered by highly associated noncausal variants. In this report, we used a trans-population mapping and sequencing strategy to identify a common variant (rs922483) in the proximal BLK promoter and a tri-allelic variant (rs1382568) in the upstream alternative BLK promoter as putative causal variants for association with systemic lupus erythematosus. The risk allele (T) at rs922483 reduced proximal promoter activity and modulated alternative promoter usage. Allelic differences at rs1382568 resulted in altered promoter activity in B progenitor cell lines. Thus, our results demonstrated that both lupus-associated functional variants contribute to the autoimmune disease association by modulating transcription of BLK in B cells and thus potentially altering immune responses.
Introduction
The gene structures of BLK (MIM 191305), a member of the src-family tyrosine kinases, have been described in B cells previously.1 More recently, the BLK-deficiency-induced underdevelopment of IL-17-producing γδ T cells has implicated a critical role of expression-altering BLK variants in the pathogenesis of autoimmune diseases.2 Studies with Blk-deficient mice suggest that BLK influences both B and T cell development and proliferation.2,3 This locus is associated with multiple autoimmune diseases, including systemic lupus erythematosus (SLE [MIM 152700]), systemic sclerosis (MIM 181750), rheumatoid arthritis (MIM 180300) and Sjögren’s syndrome (MIM 270150).4–11 Analyses of expression in transformed B cell lines demonstrate that risk-conferring variants within FAM167A (MIM 610085) and BLK are associated with altered mRNA expression of both FAM167A and BLK; however, the causal alleles and mechanisms remain undefined.7
Like other genes with TATA-less promoters, the genomic DNA upstream of exon 1 of BLK has two transcription start sites and promoters that drive BLK transcription: a ubiquitous proximal promoter (P1) and a B-lymphocyte-specific promoter (P2).1 Recent evidence suggests that immature B cells from individuals carrying lupus risk alleles have lower amounts of BLK than such cells from individuals without lupus risk alleles.12
In this study, we leveraged the difference in linkage disequilibrium (LD) structure across populations to examine the FAM167A/BLK locus in a multiethnic population of SLE cases and controls and then used focused resequencing to identify additional lupus-associated variants. Functional assessment revealed the molecular mechanism impacted by the variant alleles. Using this approach, we successfully identified two functional variants that regulate transcription from the promoters in a cell-type- and developmental-stage-specific fashion.
Subjects and Methods
Study Subjects
Approval by the institutional review boards of the Oklahoma Medical Research Foundation and the collaborators’ institutions was obtained prior to sample collection. All study participants provided written consent at the time of sample collection. De-identified genomic DNA samples from individuals with SLE and control subjects were analyzed from 6,658 unrelated individuals (3,980 individuals of European ancestry [EA], 1,272 of Asian ancestry [AS], and 1,406 of African American ancestry [AA]) and 6,550 unrelated controls (3,546 EA, 1,270 of AS, and 1,734 AA) (Table 1). These samples were obtained through the Lupus Family Registry and Repository (LFRR) as part of the Oklahoma Rheumatic Disease Research and Cores Center (ORDRCC) and through collaborators from 24 additional study sites. Collaborators and the sources of all case and control individuals used in these studies are shown in Table S1 in the Supplemental Data available online.
Table 1.
Demographics of SLE Populations Studied
| Ancestry |
Affected Individuals |
Control Individuals |
||||
|---|---|---|---|---|---|---|
| Male | Female | Total | Male | Female | Total | |
| European | 344 | 3,617 | 3,980 | 1,181 | 2,365 | 3,546 |
| African American | 109 | 1,297 | 1,406 | 5,45 | 1,189 | 1,734 |
| East Asian | 101 | 1,171 | 1,272 | 1,158 | 1,112 | 1,270 |
For resequencing experiments, deidentified genomic DNA samples from individuals with SLE and controls were obtained from the Autoimmune Biomarkers Collaborative Network (ABCoN) of the New York Cancer Project (NYCP) (191 EA SLE individuals and 96 EA controls) courtesy of Dr. Gregersen for the discovery cohort (Table S2). All individuals with SLE met classification criteria13 (American College of Rheumatology). All samples were independent. Only one randomly selected SLE sample was included if multiple affected individuals were available from a multiplex lupus pedigree. DNA was obtained from blood samples.
Genotyping and Quality Control
All samples were genotyped as a part of a joint effort of more than 40 investigators from around the world. These investigators contributed samples, funding, and hypotheses used for designing a custom, highly multiplexed Illumina-bead-based array method on a BeadStation system.14 Select SNPs were also assayed for genotype confirmation via TaqMan methods (Applied Biosystems). Genotyping facilities are located at the Oklahoma Medical Research Foundation, and data were sent to a central data center at Wake Forest Medical Center for quality control. These data were then distributed back to the investigators who had requested specific SNPs for final analysis and publication.
Genotype data were only used from samples with a call rate greater than 90% of the SNPs screened (98.05% of the samples). For analyses, only genotype data from SNPs with a call frequency greater than 90% in the samples tested and an Illumina GenTrain score greater than 0.7 (96.74% of all SNPs screened) were used. In addition, at least one previously genotyped sample was randomly placed on each assay plate and used for tracking samples through the genotyping process. More information on Illumina genotyping can be found at the Illumina website (Web Resources section).
Correction for Population Stratification
Following best practices in genome-wide association studies, we used all of the genotype data from all SNPs that passed quality control, including the published set of ancestry-informative makers (AIMs),15 and computed the principal components and admixture estimates. Regions of known extended LD were removed. The combination of 12,000 SNPs, including published sets of AIMs and the principal-component analysis computed across all ethnicities, generated principal components that separated ethnicities. To minimize the inflation of the test statistics, we included population-specific principal components in the logistic regression models as covariates.15,16 Population clustering based upon the three-dimensional plot of principal component 1 (PC1), PC2, and PC3 of the final samples used in these studies is presented (Figure S1).
Imputation-Based Association Analysis
Initially, we genotyped 372 SNPs within the FAM167A/BLK region (11,033,737–11,618,107 bp, hg19), and after performing quality control (HWE > 0.001 in controls and minor allele frequency [MAF] > 0.01), we had 329 SNPs in AA samples, 259 SNPs in EA samples, and 201 SNPs in AS available for imputation. To investigate the new variants in the FAM167A/BLK region, we used the 1000 Genomes project17 as a reference panel for imputation to estimate missing genotypes. After quality control measures (HWE > 0.001 in controls and MAF > 0.01) for the 1000 Genomes project reference panel, which contains 11,528 SNPs within the FAM167A/BLK region, we used 246 AA samples with 4,813 SNPs, 381 EA samples with 2,508 SNPs, and 286 AS samples with 1,847 SNPs for imputation. Imputation was carried out with MACH,17,18 which provided a quantitative assessment of estimate uncertainty (Rsq). All imputed SNPs were filtered with the quality controls (HWE > 0.001, MAF > 0.01, and Rsq > 0.6), and 2,137 SNPs in AA samples, 1,199 SNPs in EA samples, and 738 SNPs in AS samples were used for further analysis. At each SNP, p value, odds ratio (OR), and 95% confidence interval (CI) were calculated with gPLINK.19 We calculated allelic association results (Table 2 and Table S3) to account for imputation uncertainty with mach2 dat;20 genotyped and imputed SNPs with p values ≤ 0.05 from at least one population are shown.
Table 2.
Association- and Conditional-Analysis Results for Significantly Associated Peak Genotyped and Imputed SNPs
| Chr. | dsSNP | BP (build37) | Allele1/Allele2 |
European Americana |
Asianb |
African Americanc |
|||||||||||||
|---|---|---|---|---|---|---|---|---|---|---|---|---|---|---|---|---|---|---|---|
| Freq_Allele1 (Case/Control)d | eAdj. p | OR (95% CI) | r2Peak | fpcondon rs998683 | Freq_Allele1 (Case/Control) | Adj. p | OR (95% CI) | r2Peak | pcondon rs1478901 | Freq_Allele1 (Case/Control) | Adj. p | OR (95% CI) | r2Peak | pcondon rs2736345 | pcondon rs922483 | ||||
| 8 | rs2409780 | 11,337,587 | T/C | 0.699/0.752 | 3.20 × 10⁻¹³ | 0.77 (0.71–0.82) | 0.93 | 0.97 | 0.189/0.267 | 2.10 × 10⁻¹¹ | 0.64 (0.56–0.73) | 0.85 | 0.29 | 0.822/0.865 | 3.913 × 10−06 | 0.73 (0.63–0.83) | 0.474 | 0.020 | 0.100 |
| 8 | rs1564267g | 11,337,887 | A/G | 0.154/0.167 | 3.54 × 10−02 | 0.91 (0.83–1) | 0.08 | 0.91 | 0.166/0.237 | 3.11 × 10⁻¹⁰ | 0.64 (0.56–0.74) | 0.72 | 0.38 | 0.429/0.462 | 0.01079 | 0.88 (0.8–0.97) | 0.070 | 0.127 | 0.353 |
| 8 | rs2618444 | 11,338,370 | A/C | 0.699/0.752 | 3.06 × 10⁻¹³ | 0.77 (0.71–0.82) | 0.93 | 0.97 | 0.189/0.267 | 2.30 × 10⁻¹¹ | 0.64 (0.56–0.73) | 0.85 | 0.29 | 0.823/0.865 | 0.00000411 | 0.73 (0.63–0.84) | 0.475 | 0.019 | 0.095 |
| 8 | rs62489069 | 11,338,383 | A/G | 0.67/0.72 | 1.81 × 10⁻¹¹ | 0.79 (0.73–0.85) | 0.80 | 0.97 | 0.168/0.238 | 3.82 × 10⁻¹⁰ | 0.64 (0.56–0.74) | 0.72 | 0.36 | 0.752/0.791 | 0.000237 | 0.8 (0.71–0.9) | 0.238 | 0.061 | 0.166 |
| 8 | rs35393613 | 11,338,466 | C/T | 0.67/0.72 | 1.78 × 10⁻¹¹ | 0.79 (0.73–0.85) | 0.80 | 0.96 | 0.168/0.238 | 5.26 × 10⁻¹⁰ | 0.64 (0.56–0.74) | 0.72 | 0.40 | 0.776/0.813 | 0.0004116 | 0.8 (0.71–0.91) | 0.289 | 0.068 | 0.184 |
| 8 | rs1531577 | 11,338,561 | T/C | 0.712/0.694 | 1.49 × 10−02 | 1.09 (1.02–1.17) | 0.16 | 0.57 | 0.835/0.766 | 3.50 × 10⁻¹⁰ | 1.56 (1.35–1.8) | 0.73 | 0.29 | 0.834/0.805 | 0.004446 | 1.2 (1.06–1.37) | 0.077 | 0.343 | 0.150 |
| 8 | rs2061831 | 11,339,882 | T/C | 0.699/0.752 | 2.42 × 10⁻¹³ | 0.76 (0.71–0.82) | 0.94 | 0.87 | 0.188/0.265 | 5.40 × 10⁻¹¹ | 0.64 (0.56–0.74) | 0.87 | 0.26 | 0.823/0.865 | 4.401 × 10−06 | 0.73 (0.63–0.84) | 0.478 | 0.021 | 0.116 |
| 8 | rs2736332 | 11,339,965 | C/G | 0.326/0.271 | 1.52 × 10⁻¹³ | 1.3 (1.21–1.4) | 0.82 | 0.31 | 0.813/0.735 | 2.93 × 10⁻¹¹ | 1.57 (1.37–1.79) | 0.87 | 0.19 | 0.599/0.563 | 0.005471 | 1.16 (1.04–1.28) | 0.253 | 0.724 | 0.895 |
| 8 | rs7812879a | 11,340,181 | G/A | 0.856/0.843 | 3.35 × 10−02 | 1.1 (1.01–1.2) | 0.07 | 0.82 | 0.836/0.766 | 4.78 × 10⁻¹⁰ | 1.55 (1.35–1.79) | 0.73 | 0.33 | 0.8/0.775 | 0.01928 | 1.15 (1.02–1.3) | 0.094 | 0.166 | 0.515 |
| 8 | rs2254891g | 11,341,129 | C/G | 0.712/0.694 | 1.29 × 10−02 | 1.09 (1.02–1.17) | 0.16 | 0.58 | 0.826/0.759 | 2.31 × 10−09 | 1.52 (1.32–1.75) | 0.76 | 0.68 | 0.848/0.828 | 0.02776 | 1.16 (1.01–1.33) | 0.061 | 0.665 | 0.359 |
| 8 | rs2736336 | 11,341,870 | G/T | 0.699/0.752 | 2.19 × 10⁻¹³ | 0.76 (0.71–0.82) | 0.94 | 1.00 | 0.197/0.272 | 4.19 × 10⁻¹⁰ | 0.65 (0.56–0.75) | 0.90 | 0.87 | 0.794/0.838 | 4.237 × 10−06 | 0.74 (0.65–0.84) | 0.348 | 0.034 | 0.096 |
| 8 | rs2736337 | 11,341,880 | T/C | 0.699/0.752 | 2.24 × 10⁻¹³ | 0.76 (0.71–0.82) | 0.94 | 0.98 | 0.197/0.272 | 3.96 × 10⁻¹⁰ | 0.65 (0.56–0.75) | 0.89 | 0.78 | 0.795/0.84 | 2.178 × 10−06 | 0.73 (0.64–0.83) | 0.325 | 0.024 | 0.069 |
| 8 | rs2736338 | 11,341,883 | A/C | 0.699/0.752 | 2.23 × 10⁻¹³ | 0.76 (0.71–0.82) | 0.94 | 0.98 | 0.197/0.272 | 4.00 × 10⁻¹⁰ | 0.65 (0.56–0.75) | 0.90 | 1.00 | 0.795/0.84 | 0.00000218 | 0.73 (0.64–0.83) | 0.325 | 0.024 | 0.069 |
| 8 | rs2254660 | 11,342,986 | G/C | 0.859/0.848 | 6.63 × 10−02 | 1.09 (0.99–1.19) | 0.07 | 0.99 | 0.829/0.759 | 9.49 × 10⁻¹⁰ | 1.54 (1.33–1.77) | 0.78 | 0.60 | 0.894/0.876 | 0.03329 | 1.19 (1.01–1.4) | 0.030 | 0.411 | 0.217 |
| 8 | rs2254546 | 11,343,680 | G/A | 0.855/0.843 | 3.37 × 10−02 | 1.1 (1.01–1.2) | 0.07 | 0.82 | 0.828/0.759 | 1.04 × 10−09 | 1.54 (1.33–1.77) | 0.78 | 0.66 | 0.876/0.858 | 0.03353 | 1.17 (1.01–1.36) | 0.045 | 0.609 | 0.336 |
| 8 | chr11343717 | 11,343,717 | A/G | −/− | - | - | - | - | −/− | - | - | - | - | 0.979/0.97 | 0.03673 | 1.4 (1.01–1.94) | 0.014 | 0.159 | 0.118 |
| 8 | rs2736340g | 11,343,973 | G/A | 0.7/0.753 | 2.09 × 10⁻¹³ | 0.76 (0.71–0.82) | 0.94 | 0.89 | 0.188/0.265 | 9.16 × 10⁻¹¹ | 0.65 (0.56–0.74) | 0.87 | 0.31 | 0.824/0.866 | 5.323 × 10−06 | 0.73 (0.64–0.84) | 0.481 | 0.024 | 0.129 |
| 8 | rs2618473g | 11,344,127 | G/A | 0.69/0.743 | 3.25 × 10⁻¹³ | 0.77 (0.71–0.83) | 0.89 | 0.79 | 0.189/0.265 | 8.64 × 10⁻¹¹ | 0.65 (0.56–0.74) | 0.87 | 0.32 | 0.552/0.582 | 0.01564 | 0.88 (0.8–0.98) | 0.033 | 0.478 | 0.258 |
| 8 | rs4840565g | 11,345,545 | G/C | 0.33/0.278 | 8.07 × 10⁻¹² | 1.27 (1.19–1.37) | 0.81 | 0.98 | 0.823/0.754 | 1.84 × 10−09 | 1.52 (1.32–1.75) | 0.81 | 0.88 | 0.36/0.312 | 0.00008384 | 1.23 (1.11–1.36) | 0.529 | 0.192 | 0.431 |
| 8 | rs2736342g | 11,347,289 | A/C | 0.49/0.448 | 3.67 × 10−07 | 1.18 (1.11–1.26) | 0.39 | 0.68 | −/− | - | - | - | - | 0.556/0.523 | 0.00846 | 1.14 (1.03–1.26) | 0.315 | 0.868 | 0.930 |
| 8 | rs1478900g | 11,347,660 | A/G | 0.854/0.844 | 6.64 × 10−02 | 1.09 (0.99–1.19) | 0.07 | 0.96 | 0.807/0.736 | 1.15 × 10−09 | 1.51 (1.32–1.73) | 0.89 | 0.30 | 0.874/0.857 | 0.04142 | 1.16 (1–1.35) | 0.042 | 0.607 | 0.343 |
| 8 | rs1478901g | 11,347,833 | C/G | 0.701/0.754 | 2.92 × 10⁻¹³ | 0.77 (0.71–0.82) | 0.95 | 0.99 | 0.208/0.29 | 1.32 × 10⁻¹¹ | 0.64 (0.56–0.73) | 1.00 | - | 0.822/0.864 | 0.00000525 | 0.73 (0.64–0.84) | 0.477 | 0.039 | 0.140 |
| 8 | chr11348647 | 11,348,647 | C/A | −/− | - | - | - | - | −/− | - | - | - | - | 0.982/0.987 | 0.02851 | 0.61 (0.39–0.96) | 0.034 | 0.529 | 0.530 |
| 8 | rs9693589 | 11,348,961 | G/A | 0.701/0.754 | 2.96 × 10⁻¹³ | 0.77 (0.71–0.82) | 0.95 | 1.00 | 0.212/0.291 | 4.15 × 10⁻¹¹ | 0.65 (0.57–0.74) | 0.94 | collinear | 0.824/0.866 | 5.801 × 10−06 | 0.73 (0.64–0.84) | 0.487 | 0.024 | 0.116 |
| 8 | rs13277113g | 11,349,186 | G/A | 0.701/0.754 | 2.98 × 10⁻¹³ | 0.77 (0.71–0.82) | 0.95 | 1.00 | 0.212/0.291 | 4.28 × 10⁻¹¹ | 0.65 (0.57–0.74) | 0.94 | collinear | 0.824/0.866 | 5.739 × 10−06 | 0.73 (0.64–0.84) | 0.487 | 0.024 | 0.116 |
| 8 | rs9694294g | 11,350,721 | C/G | 0.855/0.843 | 4.22 × 10−02 | 1.1 (1–1.2) | 0.07 | 0.93 | 0.817/0.747 | 8.79 × 10⁻¹⁰ | 1.52 (1.33–1.75) | 0.77 | 0.66 | 0.839/0.812 | 0.004564 | 1.21 (1.06–1.38) | 0.077 | 0.369 | 0.182 |
| 8 | rs1478902g | 11,350,774 | A/C | −/− | - | - | - | - | −/− | - | - | - | - | 0.984/0.977 | 0.04526 | 1.44 (0.99–2.08) | 0.016 | 0.176 | 0.142 |
| 8 | rs4840568g | 11,351,019 | G/A | 0.675/0.73 | 1.46 × 10⁻¹³ | 0.77 (0.71–0.83) | 0.83 | 0.27 | 0.208/0.287 | 5.67 × 10⁻¹¹ | 0.65 (0.57–0.74) | 0.91 | collinear | 0.634/0.665 | 0.0106 | 0.87 (0.79–0.97) | 0.162 | 0.246 | 0.597 |
| 8 | rs922483g | 11,351,912 | A/G | 0.344/0.291 | 5.27 × 10⁻¹² | 1.27 (1.19–1.36) | 0.76 | 0.43 | 0.807/0.735 | 1.06 × 10−09 | 1.51 (1.32–1.73) | 0.83 | 0.98 | 0.308/0.252 | 1.151 × 10−06 | 1.31 (1.17–1.47) | 1.000 | 0.069 | - |
| 8 | chr11351937 | 11,351,937 | G/T | −/− | - | - | - | - | −/− | - | - | - | - | 0.984/0.977 | 0.04802 | 1.44 (0.99–2.09) | 0.016 | 0.196 | 0.158 |
| 8 | rs2250788g | 11,352,056 | G/A | 0.855/0.843 | 3.83 × 10−02 | 1.1 (1–1.2) | 0.07 | 0.89 | 0.818/0.747 | 8.27 × 10⁻¹⁰ | 1.53 (1.33–1.75) | 0.76 | 0.56 | 0.843/0.818 | 0.009211 | 1.19 (1.04–1.37) | 0.084 | 0.376 | 0.222 |
| 8 | rs13272061g | 11,352,261 | C/A | 0.5/0.459 | 6.15 × 10−07 | 1.18 (1.1–1.26) | 0.37 | 0.59 | −/− | - | - | - | - | 0.862/0.844 | 0.04183 | 1.15 (1–1.33) | 0.071 | 0.711 | 0.450 |
| 8 | rs2736345g | 11,352,485 | G/A | 0.355/0.301 | 1.08 × 10⁻¹² | 1.28 (1.19–1.37) | 0.81 | 0.41 | 0.817/0.745 | 4.83 × 10⁻¹⁰ | 1.53 (1.34–1.76) | 0.77 | 0.46 | 0.414/0.355 | 1.486 × 10−06 | 1.28 (1.15–1.42) | 0.626 | - | 0.152 |
| 8 | rs2618476g | 11,352,541 | A/G | 0.689/0.744 | 6.21 × 10⁻¹⁴ | 0.76 (0.71–0.82) | 1.00 | collinear | 0.196/0.276 | 1.78 × 10⁻¹¹ | 0.64 (0.56–0.73) | 0.86 | 0.15 | 0.824/0.863 | 0.00001892 | 0.75 (0.65–0.86) | 0.476 | 0.048 | 0.122 |
| 8 | rs998683g | 11,353,000 | G/A | 0.689/0.745 | 5.22 × 10⁻¹⁴ | 0.76 (0.71–0.82) | 1.00 | - | 0.208/0.286 | 1.18 × 10⁻¹⁰ | 0.66 (0.58–0.75) | 0.90 | 0.82 | 0.824/0.864 | 0.00001517 | 0.74 (0.65–0.85) | 0.472 | 0.044 | 0.111 |
3,980 case individuals and 3,546 control individuals.
1,271 case individuals and 1,270 control individuals.
1,406 case individuals and 1,734 control individuals.
Freq = frequency.
Adj. p = p value adjusted for imputation uncertainty.
pcond = p value when conditioned on SNP.
Genotyped SNP.
For each ethnic population, we used WHAP19 to calculate pair-wise conditional analysis for each pair of SNPs (the most significant SNP plus each other SNP) and identify the independent effects for each SNP. We assessed whether the joint effect is explained by a single SNP. If a haplotype was significant and remained significant after we conditioned on a SNP, then that SNP did not independently account for the association. However, if the p value was no longer significant after we conditioned on a SNP, then we considered that SNP to be the source of the association.
Resequencing of FAM167A/BLK Exons and the Upstream Promoter Region
Resequencing was performed on 191 individuals with SLE and 96 controls from ABCoN, as detailed above (Table S2). All 13 exons and the 2.5 kb upstream promoter sequence were resequenced with whole-genome amplified genomic DNA (Cat#150045, QIAGEN). Primers for resequencing were designed to target the 13 exon regions and 2.5 kb upstream promoter region. PCR amplification was performed on genomic DNA via high-fidelity Taq polymerase according to standard protocols. PCR product purity and size were assessed on 2% agarose gels. Sanger sequencing was performed per the manufacture’s protocol. Sequence trace files were manually analyzed for variations.
Haplotype Analysis
We used the expectation-maximization algorithm in the WHAP program19 to estimate haplotype frequencies. WHAP directly calculates likelihood estimates, likelihood ratios, and p values by taking into account the information loss due to haplotype-phase uncertainty and missing genotypes. Association between inferred haplotypes and SLE was tested with an omnibus test. We used both conditional analysis and global haplotype analysis to disentangle the correlation structure in which SNPs are truly associated with phenotype. To test which of the associated SNPs were causal and which were significantly associated by LD, we performed haplotype conditional analysis on each SNP. If the global haplotype association disappeared, then the specific SNP on which we had conditioned accounted for the whole association.
Nuclear Extract Preparation
Nuclear extracts from the human Jurkat T cell line, RS4;11 pro-B cell line, Nalm-6 and Reh pre-B cell lines, Ramos immature B cell line, and Daudi mature B cell line (American Type Tissue Culture Collection) were obtained. Cells were maintained in RPMI with 10% heat-inactivated fetal bovine serum, L-glutamine (2 mM), and penicillin and streptomycin (100 units/ml). Nuclear protein extracts were prepared from cells, dialyzed against a buffer composed of 20 mM HEPES, 20% glycerol, 0.1M potassium chloride, and 0.2 mM EDTA (pH 7.9), and used in nuclear binding assays (Figures S2 and S3).21
Electrophoretic Mobility-Shift Assay
A forward and reverse 21 base pair synthetic oligonucleotide from the BLK promoter flanking the rs922483 polymorphism was purchased from Integrated DNA Technologies. All oligos were purified with polyacrylamide gel electrophoresis. Probes carrying the risk allele (T) and nonrisk allele (C) were generated, and pairs of one forward and one reverse oligonucleotide were mixed in equal molar ratios, heated, and then allowed to anneal to generate the 21 bp, double-stranded probes. T4 polynucleotide kinase (Invitrogen) was used for labeling the end of each DNA probe with (γ-32P) adenosine triphosphate (Amersham). The nuclear extracts prepared as discussed above were incubated for 25 min at 37°C with labeled probes in binding buffer (1 μg poly(dI-dC), 20 mM HEPES, 10% glycerol, 100 mM KCl, and 0.2 mM EDTA [pH 7.9]). DNA-protein complexes were resolved on denaturing 5% acrylamide gels. For supershift assays, varying concentrations of anti-pol II antibody (clone 8A7 and clone H-224, Santa Cruz) were added to the DNA-protein complexes; this was followed by incubation for 15 min prior to resolution on denaturing 5% acrylamide gels (Figure S3).
Luciferase Reporter Assay
We amplified the upstream sequence (−2,256 to +55 bp) of BLK by using genomic DNA from individuals with nonrisk haplotypes. PCR products were cloned into pCR2.1-TOPO vector (Invitrogen, Cat# K4500-01) and subcloned into pGL4 luciferase reporter vectors (Promega, Cat# E6651, Madison, WI). The construct carrying the nonrisk haplotype was used as a template for mutagenesis (Stratagene) to create other allelic haplotypes.
An internal control reporter vector, pRL-TK, containing Renilla luciferase driven by the thymidine kinase promoter was simultaneously transfected with our experimental vectors as a control for assay-to-assay variability. The Renilla luciferase activity expressed by the internal control vector was used for normalization of transfection efficiency. One to 5 μg of each vector was transfected into the Jurkat (1 × 10⁶/sample in triplicate), RS4;11 (2 × 10⁶/sample in triplicate), Nalm-6 (3 × 10⁶/sample in triplicate), Ramos (3 × 10⁶/sample in triplicate), and Daudi (5 × 10⁶/sample in triplicate) cell lines. Cells were then incubated at 37°C for 16 hr. Luciferase activity was measured with the Dual-Luciferase Reporter Assay System (Promega, Cat# E1960). Luciferase activity was normalized through division of BLK risk or nonrisk construct reporter activity by the reporter activity of the pRL-TK construct. The mean and standard error of measurement were calculated on the basis of the normalized luciferase activities and used for further analysis.
Results
Trans-Population Association Testing Identified rs922483 as the Predominant SLE-Associated Causal Variant
To identify the causal variants responsible for the association of FAM167A/BLK with SLE, we genotyped 372 SNPs selected from the phase II HapMap in the region spanning 584.37 kb (11,033,737–11,618,107 bp, hg19) in chromosomal region 8p21 in three ethnic populations. After applying quality-control measures and adjusting for admixture within and across populations (Figure S1), we analyzed a total of 6,658 independent cases and 6,550 independent controls (Table 1 and Table S1).
To enrich the genotyped data set for nongenotyped SNPs, we imputed variants located between 11,033,737 bp and 11,618,107 bp (hg19) by using population-specific reference panels derived from the 1000 Genomes Project.22 SNP-association results for each population are shown or listed in Figures 1A–1C, Table 2, and Table S3). Considering the correlated variants that had r2 > 0.6 with the peak associated SNP in each population, we observed 30 SNPs demonstrating association in the AS population (peak SNP rs1478901, p = 1.32 × 10⁻¹¹, OR = 0.64, 95% CI = 0.56–0.73) and 20 SNPs demonstrating association in the EA population (peak SNP rs998683, p = 5.22 × 10⁻¹⁴, OR = 0.76, 95% CI = 0.71–0.82) (Table 2). However, we observed only two associated SNPs (SNP rs2736345, p = 1.49 × 10⁻⁶, OR = 1.28, 95% CI = 1.15-1.42 and peak SNP rs922483, p = 1.15 × 10⁻⁶, OR = 1.31, 95% CI = 1.17–1.47) in the AA population because of the reduced LD in this region. Both variants identified in the AA population are within the subset of variants that were identified in the EA and AS samples as having r2 > 0.6 relative to the peak SNPs, suggesting that the same causal variants are present in all three populations. Conditional association tests performed within each population validated rs998683, rs1478901, and rs922483 as the main SLE-associated variant for EA, AS, and AA, respectively (Table 2). Thus, rs922483 is likely to be the predominant SLE-associated variant.
Figure 1.
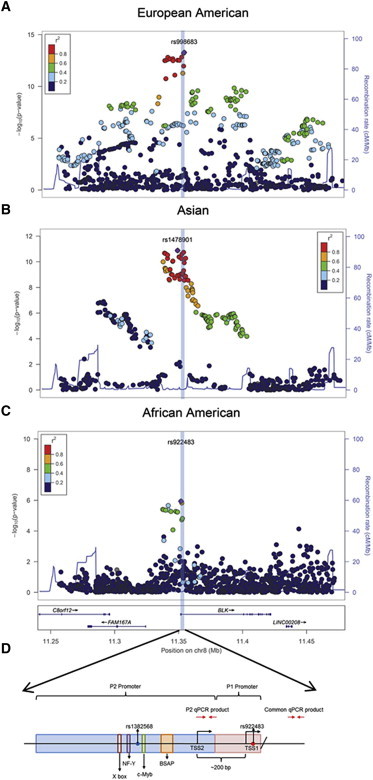
Genetic Association of SNPs in and around the FAM167A/BLK Gene Locus in SLE-Affected Individuals
SNPs in and around the FAM167A/BLK gene locus in individuals with SLE with (A) European ancestry, (B) Asian ancestry (C), and African American ancestry are shown. All SNPs with an r2 > 0.6 (correlation with previously reported peak SNP rs13277113) are displayed. The solid blue line represents recombination rates across the region. The most significantly associated SNP in each population is colored purple, and the SNP number is indicated. (D) A schematic with key features of the BLK proximal promoter is shown. Probe P2 and P1 represent the 100 bp probe flanking the candidate variants, rs1382568 and rs922483. P2 and common qPCR products represent the products from luciferase gene-specific reverse transcription using product-specific primers (represented by red arrows).
We concluded that, of the common associated variants, rs922483 was the stronger functional candidate given that it is located near a putative transcript initiator (INR) site23 (Figure S4) in a region predicted to bind RNA polymerase II (RNAPII), and its association with SLE remained significant when conditioned on rs2736345 (Table 2).
Resequencing Identified an Additional SLE-Associated triallelic SNP, rs1382568, Located within the B-Cell-Specific Promoter
To ensure identification of other uncommon and multi-allelic genetic variation in this region, we resequenced all 13 BLK exons and the 2.5 kb upstream promoter regions in 191 EA SLE individuals and 96 EA controls from the Autoimmune Biomarkers Collaborative Network (ABCoN) and the New York Cancer Project (NYCP), respectively. Although no additional nongenotyped or nonimputed biallelic variants were detected, an SLE-associated tri-allelic variant, rs1382568 (A/G/C), that is highly correlated with the variant (rs922483) identified in our trans-population association study was identified (Table 3 and Table S3).
Table 3.
Analysis Results of Variations Identified in Resequencing within the Noncoding Region of BLK
| Genomic Location | Nucleotide Change | dbSNP | Associated Allele | Case, Control Ratio Counts (191, 96) | OR (95% CI) | p Value | r2(with rs13277113) |
|---|---|---|---|---|---|---|---|
| 11,349,576 | C>A | rs2251056 | A | 321:61, 150:42 | 1.47 (0.95–2.28) | 0.0819 | 0.066 |
| 11,350,515 | C>T | rs76610494 | T | 8:374, 1:191 | 4.10 (0.51–32.92) | 0.1522 | 0.006 |
| 11,350,678 | T>C | rs2736344 | C | 329:53, 149:43 | 1.79 (1.15–2.80) | 0.0098 | 0.072 |
| 11,350,721 | C>G | rs9694294 | G | 323:59, 149:43 | 1.58 (1.02–2.45) | 0.0398 | 0.078 |
| 11,350,899 | T>C | rs1382567 | T | 199:183, 93:99 | 1.16 (0.82–1.64) | 0.4083 | 0.335 |
| 11,351,019 | G>A | rs4840568 | A | 125:257, 41:151 | 1.79 (1.29–2.69) | 0.0046 | 0.852 |
| 11,351,220 | A>C | rs1382568a | C | 121:261, 38:154 | 1.88 (1.24–2.85) | 0.0027 | 0.889 |
| 11,351,220 | A>G | rs1382568a | A | 200:182, 94:98 | 1.15 (0.81–1.62) | 0.4423 | 0.331 |
| 11,351,912 | C>T | rs922483 | T | 137:245, 43:149 | 1.94 (1.30–2.89) | 0.001 | 0.741 |
| 11,352,056 | A>G | rs2250788 | G | 320:62, 148:44 | 1.53 (0.99–2.37) | 0.0514 | 0.059 |
| 11,366,671 | C>T | rs115856097 | C | 274:108, 128:64 | 1.27 (0.87–1.84) | 0.2117 | 0.037 |
| 11,367,037 | G>C | rs4629826 | G | 358:24, 176:16 | 1.36 (0.70–2.62) | 0.3626 | 0.018 |
| 11,367,042 | C>T | rs76154097 | T | 55:327, 23:169 | 1.24 (0.73–2.08) | 0.4249 | 0.038 |
| 11,367,092 | T>C | rs2409782 | C | 91:291, 45:147 | 1.02 (0.68–1.54) | 0.9186 | 0.001 |
| 11,415,571 | A>G | rs4841557 | A | 158:222, 63:129 | 1.46 (1.01–2.10) | 0.042 | 0.187 |
| 11,415,596 | C>T | rs4841558 | C | 157:223, 63:129 | 1.44 (1.00–2.08) | 0.0484 | 0.181 |
| 11,418,385 | G>A | rs1042695 | A | 145:237, 59:133 | 1.38 (0.95–2.00) | 0.0878 | 0.179 |
| 11,418,765 | G>A | rs368588162 | A | 335:45, 157:35 | 1.66 (1.03–2.68) | 0.0375 | 0.019 |
| 11,418,766 | G>A | rs62490888 | G | 340:42, 157:35 | 1.81 (1.11–2.94) | 0.0164 | 0.015 |
| 11,418,772 | C>T | rs4841561 | T | 146:234, 59:133 | 1.41 (0.97–2.04) | 0.07 | 0.177 |
| 11,421,383 | C>T | rs10097015 | T | 160:222, 68:122 | 1.29 (0.90–1.85) | 0.1608 | 0.161 |
| 11,421,793 | C>T | rs1042689 | T | 144:238, 62:130 | 1.27 (0.88–1.83) | 0.2028 | 0.161 |
| 11,422,045 | G>A | rs1042701 | G | 213:169, 98:94 | 1.21 (0.86–1.71) | 0.2845 | 0.2 |
| 11,422,130 | T>C | rs7843987 | T | 212:170, 100:92 | 1.15 (0.81–1.62) | 0.4385 | 0.219 |
The two SNPs shown in italics (rs1382568∗ and rs922483) showed association with the loci identified from the GWAS (rs13277113, OR 1.39, p = 1 × 10⁻¹⁰, ref.1) with r2 > 0.5; ars1382568 is a tri-allelic SNP (A/C/G); the C allele was identified as a risk allele.
To confirm the association of these two variants, we used data obtained for these two SNPs from additional resequencing efforts on 960 subjects (710 affected individuals and 250 control individuals). Association analysis results from these data demonstrate that both C and A alleles at rs1382568 individually contributed to the increased SLE risk when compared to the G allele (OR 1.70, p = 4 × 10⁻³; and OR 2.53, p = 6.66 × 10⁻⁴, respectively). Association analysis using the combined C/A risk allele at rs1382568 had an OR = 1.90 and p = 6.66 × 10⁻⁴. This tri-allelic variant is located within the alternative BLK promoter (P2)1 (Figure 1D). These data, and previously published results demonstrating that endogenous BLK expression varies with B cell developmental stage,24 led us to hypothesize that the SLE-associated P2 variant might contribute to disease risk by promoting functional effects in B cells at discrete stages of development. We functionally characterized both variants (rs1382568 and rs922483) in B cell lines that phenotypically represent different stages of B cell development.
Both Risk Alleles at rs922483 (T) and rs1382568 (C) Alter BLK Transcription
To investigate the impact of the SLE-associated promoter variants on BLK transcription, we cloned the BLK promoter region (−2256 to +55 bp) into a firefly luciferase reporter vector and performed site-directed mutagenesis to generate all six possible haplotype combinations of the rs1382568 (P2) and rs922483 (P1) variants. B lymphoma cell lines with distinct phenotypes representing various B cell developmental stages were transfected with the reporter constructs. RS4;11 and Nalm-6 cell lines are representative of early stages of B cell development (pre- and pro-B cells), whereas Ramos and Daudi lines represent more mature B cells. The allelic effects of both BLK promoter variants were also tested in Jurkat cells, which are phenotypically similar to mature T cells. Endogenous BLK protein expression in each of these lines was confirmed to be as previously described (Figure S2).1,12
Because of the small numbers of SLE-affected individuals carrying both risk alleles P1 and P2, we utilized in vitro assays to better isolate the influence of the P1 variant on BLK promoter activity. We assessed the average of luciferase activities of all P1-risk-allele- (T)-containing vectors, including T(P1)-C(P2), T(P1)-A(P2), and T(P1)-G(P2), as well as all P1-nonrisk-allele-containing vectors. The risk allele (T) at the P1 variant resulted in reductions of normalized luciferase expression in mature B (35%, Daudi) and mature T (32%, Jurkat) cell lines regardless of the allele at the P2 variant (p value < 0.05) (Figure 2A). The effect of the risk allele at the P1 variant on BLK-promoter-driven transcription was less pronounced in RS4;11 (pro-B) and Nalm-6 (pre-B) cells. Nuclear-factor binding assays demonstrated that the allelic variants at the P1 site altered nuclear-factor recruitment to the P1 promoter (Figure S3A), most likely as a result of changes in either the recruitment or the affinity of binding of the complement of nuclear factors and RNA-polymerase-complex components to this region of the BLK promoter, as suggested by a super-shift binding assay (Figure S3B). However, the complex nature of nuclear-factor binding to this site hampered our ability to define the exact molecular interaction affected by the nucleotide variation at this site.
Figure 2.
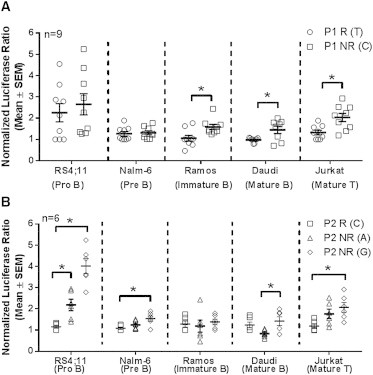
Both P1 and P2 Variants Affect BLK-Promoter-Driven Transcriptional Activity
Mean and standard error of measure (SEM) are displayed in the center, and probability density functions are represented by the sides. The effect of P1 variant with either risk or nonrisk P2 haplotype on overall luciferase expression (A) and the transcriptional activity in cell lines transfected with reporter vectors carrying one of the three SLE-associated P2 variants with a nonrisk P1 (B) is shown. Nine transfections of each vector carrying the P1 allele being compared were performed in each model cell line (n = 9), and triplicates were assessed for luciferase activity to give normalized means for each transfection. P1 risk [R(T)] and nonrisk [NR(C)] variants are compared (mean ± SEM). P2 variants of each allele (G, A, or C) were assessed in six experiments. Normalized luciferase ratio = (normalized luciferase activity of the haplotype)/(normalized luciferase activity of the T allele at P1 − the luciferase activity of the C allele at P2). The normalized luciferase activity for the haplotype = luciferase activity of BLK:pGL4/luciferase activity of TK:pRL. ∗p < 0.05 in a paired t test. Means ± SEM are shown.
In order to explore the effect of P2, we compared the averaged luciferase activities from all vectors containing the P2 risk allele (C) with other vectors containing the P2 risk allele (C). We observed the most significant allelic effect at the P2 site in early B cells (RS4;11 and Nalm-6), where risk alleles A or C at the P2 site reduced luciferase expression in comparison to the nonrisk allele (G) at this variant (p value < 0.05) (Figure 2B). However, the impact of the P2 variant became insignificant when this variant was transfected into more mature B cell lines. Nuclear-factor binding assays showed that the risk allele (C) reduced the binding affinity of multiple nuclear-factor complexes to the probe containing the P2 allelic variant (Figure S3C).
The results from these assays demonstrate that the lupus-associated risk alleles at both the P1 site (rs922483) and the P2 site (rs1382568) reduce the transcriptional activity of the BLK promoter in vitro. However, the effect of the risk allele at the P1 site most significantly affects BLK transcription in more mature B cells, whereas the effects of the risk alleles at the P2 site most significantly affect BLK transcription in more immature B cells.
P1 Variant Modulates Promoter Usage
Genes such as BLK that have multiple TSSs (transcription start sites) represent a class of genes in which changes in gene expression might be attributed to polymorphisms at multiple promoter sites. Selection of promoter use can vary on the basis of the organization of specific nuclear-factor binding sites and/or the epigenetic conformation of the genomic DNA in the promoters surrounding these TSSs. In addition, the organization of the promoters and/or TSSs and the dynamics of the transcription initiation and elongation steps of the RNA polymerase from each promoter influence which transcripts predominate within a cell. Differential promoter and TSS usage has been elegantly demonstrated in the regulation of expression of the human c-myc gene (MIM 190080).25 In this case, a preferred downstream promoter normally impedes (attenuates) the transcription initiated from the upstream promoter. However, inhibition of binding of the transcriptional machinery (e.g., RNA polymerase complex) prevents transcription initiation at the downstream c-myc promoter, removing attenuation of the upstream promoter and resulting in the upstream promoter’s becoming the preferred promoter.
To determine whether such a mechanism controls BLK promoter selection and whether lupus-disease-associated variants in the BLK promoter P1 site can alter this mechanism, we used a transcript-specific luciferase reporter RT-qPCR assay to quantitate the percentage of the total BLK reporter transcripts in the B cell panel representing various cell stages of development. The usage of P2 and TSS2 was significantly higher in a majority of the B cell lines than in the mature T (Jurkat) cell line (p < 0.05) (Figure 3). This finding is consistent with the observations made by Lin et.al.,1 who showed that the P2 promoter is primarily used by B cells. The risk allele (T) at the P1 variant reduced the P1 and TSS1 contribution to the overall BLK-luciferase-reporter transcript levels in all cells, independent of the P2 variant (p < 0.05) (Figure 2A). However, the usage of P2 and TSS2 was increased by 21% and 12% in the immature B cell lines (RS4;11 and Nalm-6, respectively) in the presence of a risk-allele (T) at the P1 variant (Figure 3). These results suggest that lupus-associated risk alleles at the P1 variant decrease the effective initiation of the BLK-reporter transcription from P1 and TSS1. This might lower the attenuation of P2 and TSS2 in early B cells, presumably by a mechanism similar to that observed with the c-myc gene. These findings provide mechanistic insights as to how multiple disease-associated variants in different promoters can have a collective effect modulating expression of disease-associated genes.
Figure 3.
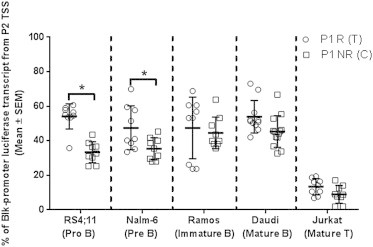
P1 Variant Altered Promoter Usage in RS4;11 and Nalm-6 Cell Lines
Percentages of the total BLK promoter-luciferase derived transcripts initiated from the P2 were determined using gene-specific RT-qPCR 16 hr post-transfection. ∗p-value < 0.05 using paired t test. Mean ± SEM are shown.
Discussion
Previous studies have linked multiple genetic variants at many loci with the development of autoimmune disease.26–31 Genetic variants found at the FAM167A/BLK locus are associated with multiple autoimmune diseases, including SLE, systemic sclerosis, rheumatoid arthritis, and Sjögren’s syndrome.4–11 Although risk-conferring variants within FAM167A/BLK have been shown to be associated with altered mRNA expression of both FAM167A and BLK,7 the causal allele or alleles remain undefined as a result of the strong association between potential causal alleles and noncausal variants. Using the trans-population mapping and sequencing strategy, we focused on two common associated variants (rs922483 and rs1382568) located within the two promoter regions of BLK for additional functional analysis.
Previously published data defined the two BLK promoters and TSSs as a ubiquitously expressed TSS1 and a B cell-specific TSS2 located approximately 400 bp upstream of the ubiquitous promoter.1 Because both candidate lupus-associated variants were located in functionally important loci of the BLK promoter, we hypothesized that they might alter unique aspects of BLK transcriptional regulation. The rs922483 SNP resides in the ubiquitous P1 and TSS1 site within a putative initiator of transcription (INR) site.23 The other lupus-associated variant, rs1382568, is located in an upstream P2 region that is highly enriched for several B-cell-specific nuclear-factor binding sites. Because rs922483 and rs1382568 have a high degree of association with SLE and are located in key regions of promoters, our results confirm the possibility that these variants contribute to disease development through regulation of BLK promoter activity.
We used reporter assays and nuclear-factor binding in B cell lines with phenotypes representative of different developmental stages to study the effects of variants on promoter activity. We cannot exclude the possibility that fresh B cells might behave differently; it is possible that primary lymphocytes might have different expression levels and activity levels of transcription factors and that these different levels might result in altered BLK transcription not observed in cell lines. However, our data directly compared the effects of promoter alleles within various types of developmental stages of B cell lines characterized to represent different stages of B cell development to give a clearer picture of BLK transcription in early B cell development. Isolating sufficient numbers of primary progenitor B cells with all haplotypes would be prohibitive. Despite its limitations, this reporter assay allowed assessment of both the allelic and haplotype effects of these variants on BLK promoter activity within multiple representative cell types.
Our results demonstrated that both variants play a role in regulating BLK transcription. Risk alleles at these sites most likely alter the affinity and/or specificity of binding of critical nuclear factors and their interactions with RNA polymerase II subunits. Our results indicate that the degree of impact of a particular risk allele on BLK transcription depends both upon cell type and, in the cases of B cells, upon the developmental stage. This is consistent with observations made by Simpfendorfer et.al. in primary cells, where they reported that a risk allele at rs922483 (P1 variant) led to an overall reduction in BLK mRNA expression in T cells from human peripheral-blood and umbilical-cord B cells.12 Although the transcription of BLK was affected by the variant in early B and T cells, BLK protein level was only significantly reduced in umbilical-cord B cells.12
On the basis of our results and the previously published information, we propose a molecular mechanistic model depicting the cell-type- and developmental-stage-specific effect of both lupus-associated variants on the overall BLK promoter activity (Figure 4A). In this model, the P1 promoter is the predominant promoter. When the RNA polymerase II complex binds and initiates transcription from this promoter, the P2 B-cell-specific promoter is stochastically inhibited or P2-initiated transcription is prematurely terminated by RNA polymerase complexes bound to the P1 site. Because P1 is the only active promoter in non-B cells, a switch to a risk allele at the P1 site alone will lead to a significant reduction in overall BLK promoter activity.
Figure 4.
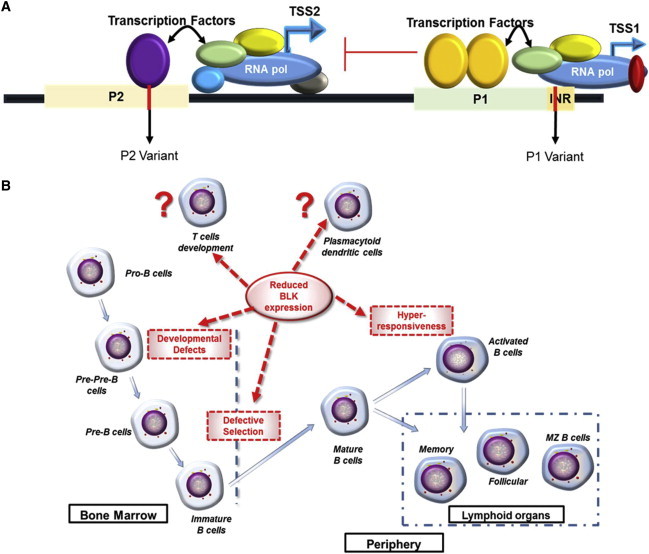
Proposed Molecular Model of Transcriptional Control of BLK Expression
A proposed model depicting how the lupus-associated risk alleles at the P1 and P2 sites alter BLK transcription (A) and a proposed model representing ways in which BLK might affect B cell development and control of autoimmune responses (B) are shown.
Alternatively, in B cells, production of BLK transcripts would be derived from both the P1 and TSS1 site and the P2 and TSS2 site. In mature B cells, P1 and TSS1 remain the preferred promoters, possibly as a result of nuclear factors and chromatin conformation at that site, which favor high-affinity RNA polymerase II binding and transcription from P1 and TSS1. When a lupus risk allele is present at the P1 site, possibly lowering the affinity of nuclear factor binding or efficiency of RNA polymerase transcription initiation, the obstruction and attenuation of P2 initiated transcription would be diminished resulting in more P2 derived transcripts. In this environment, an additional risk allele at the P2 site would result in altered nuclear-factor binding and RNA-polymerase-complex binding and initiation of transcription from this promoter. From this model, one would predict that the most dramatic decrease in BLK expression in immature B cells would occur when risk alleles were found at both the P1 and P2 sites and that this would result in increased risk for developing lupus.
Information accumulated from this and other studies is beginning to shape our overall understanding of how variations in BLK transcription expression and BLK protein levels contribute to development and/or progression of lupus.2,3,12,32 The emerging picture suggests that the variation of BLK expression is likely to result in varying functional consequences at different stages of B cell development and in different cell types (Figure 4B). Reduction in BLK expression by risk haplotypes could directly affect B lymphocyte development and/or impair functional responses in B cells early in development. Indeed, several previously published results indicate that the knockout of one allele of Blk leads to increased splenic marginal zone and peritoneal B1 B cells in older mice,3 suggesting a regulatory role for BLK. Because BLK is capable of interacting with both pre-B cell receptors and mature B cell receptors, it could play a critical role in regulating B cell selection and immune responses. Recently, BLK has also been shown to enhance BANK1 (MIM 610292) and PLCγ1 (MIM 172420) interactions upon BCR activation to modulate B cell responses.33 Other lupus-associated risk alleles in coding SNPs of BLK have been shown to result in reduced BLK protein stability.10 In addition, BLK deficiency can impair early T cell development as well as the development of IL-17-producing γδ T cells.2 Although there has been a suggestion that BLK is also an important signal transduction molecule in plasmacytoid dendritic cells (pDCs), further investigations are necessary for the evaluation of the association between BLK-related alterations in pDCs and autoimmune diseases.34 Our results indicate that BLK risk alleles alter BLK promoter activity and might thus contribute to autoreactive or regulatory cell responses.
Consortia
Members of the BIOLUPUS Network are as follows: Sandra D’Alfonso (Italy), Rafaella Scorza (Italy), Gian Domenico Sebastiani (Italy), Mario Galeazzi (Italy), Johan Frostegård (Sweden), Bernard Lawerys and Fredric Houssieu (Belgium), Peter Junker and Helle Laustrup (Denmark), Marc Bijl and Cees Kallenberg (Holland), Emoke Endreffy (Hungary), Carlos Vasconcelos and Berta Martins da Silva (Portugal), Ana Suarez (Spain), Iñigo Rúa-Figueroa (Spain), and Norberto Ortego-Centeno (Spain) and Enrique de Ramon Garrido (Spain).
Acknowledgments
The authors declare the following competing financial interests: H.S., T.W.B., and R.R.G. are full-time employees of Genentech. We thank all individuals who participated in this study and the research assistants, coordinators, and physicians who helped in the recruitment of subjects. We thank Peter K. Gregersen for providing genotyping controls and cases and controls from the ABCoN and NYCP collections. We thank the members of the BIOLUPUS Network (see consortium section) for providing samples used in this study. We thank Mary C. Comeau; Miranda C. Marion; Paula S. Ramos; Adam Adler; Stuart Glenn, and Mai Li Zhu for assistance in genotyping, quality-control analyses, and clinical-data management; J. Donald Capra for critical reading of the manuscript; Julie M. Robertson for scientific editing; and the staff of the Oklahoma Rheumatic Disease Resources Cores Center for collecting and maintaining the samples. The content of this publication is solely the responsibility of the authors and does not necessarily represent the official views of the NIH or any other funding organization. Specific NIH grant numbers and other funding information can be found in the supplemental materials.
Supplemental Data
Web Resources
The URLs for data presented herein are as follows:
Applied Biosystems, http://www.appliedbiosystems.com
Illumina, http://www.illumina.com/
Lupus Family Registry and Repository (LFRR), http://omrf.ouhsc.edu/lupus
Online Mendelian Inheritance in Man (OMIM), http://www.omim.org
References
- 1.Lin Y.H., Shin E.J., Campbell M.J., Niederhuber J.E. Transcription of the blk gene in human B lymphocytes is controlled by two promoters. J. Biol. Chem. 1995;270:25968–25975. doi: 10.1074/jbc.270.43.25968. [DOI] [PubMed] [Google Scholar]
- 2.Laird R.M., Laky K., Hayes S.M. Unexpected role for the B cell-specific Src family kinase B lymphoid kinase in the development of IL-17-producing γδ T cells. J. Immunol. 2010;185:6518–6527. doi: 10.4049/jimmunol.1002766. [DOI] [PMC free article] [PubMed] [Google Scholar]
- 3.Samuelson E.M., Laird R.M., Maue A.C., Rochford R., Hayes S.M. Blk haploinsufficiency impairs the development, but enhances the functional responses, of MZ B cells. Immunol. Cell Biol. 2012;90:620–629. doi: 10.1038/icb.2011.76. [DOI] [PMC free article] [PubMed] [Google Scholar]
- 4.Tsuchiya N., Ito I., Kawasaki A. Association of IRF5, STAT4 and BLK with systemic lupus erythematosus and other rheumatic diseases. Nihon Rinsho Meneki Gakkai Kaishi. 2010;33:57–65. doi: 10.2177/jsci.33.57. [DOI] [PubMed] [Google Scholar]
- 5.Zhang Z., Zhu K.J., Xu Q., Zhang X.J., Sun L.D., Zheng H.F., Han J.W., Quan C., Zhang S.Q., Cai L.Q. The association of the BLK gene with SLE was replicated in Chinese Han. Arch. Dermatol. Res. 2010;302:619–624. doi: 10.1007/s00403-010-1029-4. [DOI] [PubMed] [Google Scholar]
- 6.Gourh P., Agarwal S.K., Martin E., Divecha D., Rueda B., Bunting H., Assassi S., Paz G., Shete S., McNearney T. Association of the C8orf13-BLK region with systemic sclerosis in North-American and European populations. J. Autoimmun. 2010;34:155–162. doi: 10.1016/j.jaut.2009.08.014. [DOI] [PMC free article] [PubMed] [Google Scholar]
- 7.Hom G., Graham R.R., Modrek B., Taylor K.E., Ortmann W., Garnier S., Lee A.T., Chung S.A., Ferreira R.C., Pant P.V. Association of systemic lupus erythematosus with C8orf13-BLK and ITGAM-ITGAX. N. Engl. J. Med. 2008;358:900–909. doi: 10.1056/NEJMoa0707865. [DOI] [PubMed] [Google Scholar]
- 8.Han J.W., Zheng H.F., Cui Y., Sun L.D., Ye D.Q., Hu Z., Xu J.H., Cai Z.M., Huang W., Zhao G.P. Genome-wide association study in a Chinese Han population identifies nine new susceptibility loci for systemic lupus erythematosus. Nat. Genet. 2009;41:1234–1237. doi: 10.1038/ng.472. [DOI] [PubMed] [Google Scholar]
- 9.Yin H., Borghi M.O., Delgado-Vega A.M., Tincani A., Meroni P.L., Alarcón-Riquelme M.E. Association of STAT4 and BLK, but not BANK1 or IRF5, with primary antiphospholipid syndrome. Arthritis Rheum. 2009;60:2468–2471. doi: 10.1002/art.24701. [DOI] [PubMed] [Google Scholar]
- 10.Delgado-Vega A.M., Dozmorov M.G., Quirós M.B., Wu Y.Y., Martínez-García B., Kozyrev S.V., Frostegård J., Truedsson L., de Ramón E., González-Escribano M.F. Fine mapping and conditional analysis identify a new mutation in the autoimmunity susceptibility gene BLK that leads to reduced half-life of the BLK protein. Ann. Rheum. Dis. 2012;71:1219–1226. doi: 10.1136/annrheumdis-2011-200987. [DOI] [PMC free article] [PubMed] [Google Scholar]
- 11.Lessard C.J., Li H., Adrianto I., Ice J.A., Rasmussen A., Grundahl K.M., Kelly J.A., Dozmorov M.G., Miceli-Richard C., Bowman S., UK Primary Sjögren’s Syndrome Registry Variants at multiple loci implicated in both innate and adaptive immune responses are associated with Sjögren’s syndrome. Nat. Genet. 2013;45:1284–1292. doi: 10.1038/ng.2792. [DOI] [PMC free article] [PubMed] [Google Scholar]
- 12.Simpfendorfer K.R., Olsson L.M., Manjarrez Orduño N., Khalili H., Simeone A.M., Katz M.S., Lee A.T., Diamond B., Gregersen P.K. The autoimmunity-associated BLK haplotype exhibits cis-regulatory effects on mRNA and protein expression that are prominently observed in B cells early in development. Hum. Mol. Genet. 2012;21:3918–3925. doi: 10.1093/hmg/dds220. [DOI] [PMC free article] [PubMed] [Google Scholar]
- 13.Hochberg M.C. Updating the American College of Rheumatology revised criteria for the classification of systemic lupus erythematosus. Arthritis Rheum. 1997;40:1725. doi: 10.1002/art.1780400928. [DOI] [PubMed] [Google Scholar]
- 14.Lessard C.J., Adrianto I., Ice J.A., Wiley G.B., Kelly J.A., Glenn S.B., Adler A.J., Li H., Rasmussen A., Williams A.H., BIOLUPUS Network. GENLES Network Identification of IRF8, TMEM39A, and IKZF3-ZPBP2 as susceptibility loci for systemic lupus erythematosus in a large-scale multiracial replication study. Am. J. Hum. Genet. 2012;90:648–660. doi: 10.1016/j.ajhg.2012.02.023. [DOI] [PMC free article] [PubMed] [Google Scholar]
- 15.Price A.L., Butler J., Patterson N., Capelli C., Pascali V.L., Scarnicci F., Ruiz-Linares A., Groop L., Saetta A.A., Korkolopoulou P. Discerning the ancestry of European Americans in genetic association studies. PLoS Genet. 2008;4:e236. doi: 10.1371/journal.pgen.0030236. [DOI] [PMC free article] [PubMed] [Google Scholar]
- 16.Zielger A., Konig I.R. Wiley-Blackwell; Federal Republic of Germany: 2010. A statistical approach to genetic epidemiology: concepts and applications. [Google Scholar]
- 17.Li Y., Willer C.J., Ding J., Scheet P., Abecasis G.R. MaCH: using sequence and genotype data to estimate haplotypes and unobserved genotypes. Genet. Epidemiol. 2010;34:816–834. doi: 10.1002/gepi.20533. [DOI] [PMC free article] [PubMed] [Google Scholar]
- 18.Scheet P., Stephens M. A fast and flexible statistical model for large-scale population genotype data: applications to inferring missing genotypes and haplotypic phase. Am. J. Hum. Genet. 2006;78:629–644. doi: 10.1086/502802. [DOI] [PMC free article] [PubMed] [Google Scholar]
- 19.Purcell S., Daly M.J., Sham P.C. WHAP: haplotype-based association analysis. Bioinformatics. 2007;23:255–256. doi: 10.1093/bioinformatics/btl580. [DOI] [PubMed] [Google Scholar]
- 20.Li Y., Willer C., Sanna S., Abecasis G. Genotype imputation. Annu. Rev. Genomics Hum. Genet. 2009;10:387–406. doi: 10.1146/annurev.genom.9.081307.164242. [DOI] [PMC free article] [PubMed] [Google Scholar]
- 21.Dignam J.D., Lebovitz R.M., Roeder R.G. Accurate transcription initiation by RNA polymerase II in a soluble extract from isolated mammalian nuclei. Nucleic Acids Res. 1983;11:1475–1489. doi: 10.1093/nar/11.5.1475. [DOI] [PMC free article] [PubMed] [Google Scholar]
- 22.Abecasis G.R., Auton A., Brooks L.D., DePristo M.A., Durbin R.M., Handsaker R.E., Kang H.M., Marth G.T., McVean G.A., 1000 Genomes Project Consortium An integrated map of genetic variation from 1,092 human genomes. Nature. 2012;491:56–65. doi: 10.1038/nature11632. [DOI] [PMC free article] [PubMed] [Google Scholar]
- 23.Yarden G., Elfakess R., Gazit K., Dikstein R. Characterization of sINR, a strict version of the Initiator core promoter element. Nucleic Acids Res. 2009;37:4234–4246. doi: 10.1093/nar/gkp315. [DOI] [PMC free article] [PubMed] [Google Scholar]
- 24.Akerblad P., Sigvardsson M. Early B cell factor is an activator of the B lymphoid kinase promoter in early B cell development. J. Immunol. 1999;163:5453–5461. [PubMed] [Google Scholar]
- 25.Meulia T., Krumm A., Spencer C., Groudine M. Sequences in the human c-myc P2 promoter affect the elongation and premature termination of transcripts initiated from the upstream P1 promoter. Mol. Cell. Biol. 1992;12:4590–4600. doi: 10.1128/mcb.12.10.4590. [DOI] [PMC free article] [PubMed] [Google Scholar]
- 26.Goris A., Liston A. The immunogenetic architecture of autoimmune disease. Cold Spring Harb. Perspect. Biol. 2012;4:a007260. doi: 10.1101/cshperspect.a007260. [DOI] [PMC free article] [PubMed] [Google Scholar]
- 27.Wiebolt J., Koeleman B.P., van Haeften T.W. Endocrine autoimmune disease: genetics become complex. Eur. J. Clin. Invest. 2010;40:1144–1155. doi: 10.1111/j.1365-2362.2010.02366.x. [DOI] [PubMed] [Google Scholar]
- 28.Rullo O.J., Tsao B.P. Recent insights into the genetic basis of systemic lupus erythematosus. Ann. Rheum. Dis. 2013;72(Suppl 2):ii56–ii61. doi: 10.1136/annrheumdis-2012-202351. [DOI] [PMC free article] [PubMed] [Google Scholar]
- 29.Perricone C., Ceccarelli F., Valesini G. An overview on the genetic of rheumatoid arthritis: a never-ending story. Autoimmun. Rev. 2011;10:599–608. doi: 10.1016/j.autrev.2011.04.021. [DOI] [PubMed] [Google Scholar]
- 30.Ice J.A., Li H., Adrianto I., Lin P.C., Kelly J.A., Montgomery C.G., Lessard C.J., Moser K.L. Genetics of Sjögren’s syndrome in the genome-wide association era. J. Autoimmun. 2012;39:57–63. doi: 10.1016/j.jaut.2012.01.008. [DOI] [PMC free article] [PubMed] [Google Scholar]
- 31.Hoffjan S., Akkad D.A. The genetics of multiple sclerosis: an update 2010. Mol. Cell. Probes. 2010;24:237–243. doi: 10.1016/j.mcp.2010.04.006. [DOI] [PubMed] [Google Scholar]
- 32.Kozyrev S.V., Bernal-Quirós M., Alarcón-Riquelme M.E., Castillejo-López C. The dual effect of the lupus-associated polymorphism rs10516487 on BANK1 gene expression and protein localization. Genes Immun. 2012;13:129–138. doi: 10.1038/gene.2011.62. [DOI] [PMC free article] [PubMed] [Google Scholar]
- 33.Bernal-Quirós M., Wu Y.Y., Alarcón-Riquelme M.E., Castillejo-López C. BANK1 and BLK act through phospholipase C gamma 2 in B-cell signaling. PLoS ONE. 2013;8:e59842. doi: 10.1371/journal.pone.0059842. [DOI] [PMC free article] [PubMed] [Google Scholar]
- 34.Cao W., Zhang L., Rosen D.B., Bover L., Watanabe G., Bao M., Lanier L.L., Liu Y.J. BDCA2/Fc epsilon RI gamma complex signals through a novel BCR-like pathway in human plasmacytoid dendritic cells. PLoS Biol. 2007;5:e248. doi: 10.1371/journal.pbio.0050248. [DOI] [PMC free article] [PubMed] [Google Scholar]
Associated Data
This section collects any data citations, data availability statements, or supplementary materials included in this article.