

Abstract
Most cognitive theories of reading and spelling posit modality-specific representations of letter shapes, spoken letter names, and motor plans as well as abstract, amodal letter representations that serve to unify the various modality-specific formats. However, fundamental questions remain regarding the very existence of abstract letter representations, the neuro-topography of the different types of letter representations, and the degree of cortical selectivity for orthographic information. We directly test quantitative models of the similarity/dissimilarity structure of distributed neural representations of letters using Multivariate Pattern Analysis-Representational Similarity Analysis (MVPA-RSA) searchlight methods to analyze the BOLD response recorded from single letter viewing. These analyses reveal a left hemisphere ventral temporal region selectively tuned to abstract letter representations as well as substrates tuned to modality-specific (visual, phonological and motoric) representations of letters. The approaches applied in this research address various shortcoming of previous studies that have investigated these questions and, therefore, the findings we report serve to advance our understanding of the nature and format of the representations that occur within the various sub- regions of the large-scale networks used in reading and spelling.
Keywords: Letter representation, Abstract letter identity, Reading and spelling networks, Multivariate Pattern Analysis (MVPA), Representational Similarity Analysis (RSA), Visual Word Form Area (VWFA)
1. INTRODUCTION
Reading and spelling, as relatively recent additions to the human skill repertoire, presumably make use of evolutionarily older neural circuitry in order to represent the letter shapes, letter names and motor plans that are necessary for reading and writing. Consistent with this, extensive functional neuroimaging research has identified large-scale networks within visual, language and motor areas of the brain that are reliably recruited for reading and spelling. However, despite considerable consistency in the findings at a general level, there is far less consensus regarding how the component processes and representations are specifically instantiated within these networks. Various approaches have been taken for investigating these more detailed questions, each with specific strengths and weaknesses, as we discuss below. In the research we report on here, we directly address the question of the representational format of the neural codes used in reading by applying an MVPA-RSA searchlight analysis to fMRI data collected from subjects viewing single letters. We use this approach to identify the neurotopographic distribution of the multiple codes of letters: abstract letter identities, visual letter shapes, letter names and motor programs for writing letter shapes. The findings of this research allow us to address long-standing cognitive science questions regarding the types of representations used in reading as well as neuroscience questions regarding the neural instantiation of these representations.
Multivariate Pattern Analysis (MVPA) (Kriegeskorte et al., 2008) is based on the premise that the informational content of neural representations is distributed across a population of neuronal units and, therefore, that stimuli that are representationally similar will generate similar response patterns across the neuronal units within a relevant brain region. The most common applications of MVPA involve the use of classification algorithms (Kriegeskorte, 2011) to determine if the patterns of responses within some brain region contain sufficient information to distinguish between two (or more) classes of stimuli (e.g., words vs. false fonts). However, instead of MVPA classification, in this work we use an MVPA Representational Similarity Analysis (MVPA-RSA) approach to model testing and comparison. This approach allows a comparison, within neural regions, of the observed similarity/dissimilarity structure of the voxel response patterns (e.g., to letter stimuli) with different quantitative models of the patterns that would be predicted if a region were sensitive to a specific type of representation (e.g., for letters: abstract, visual, phonological, or motoric). Furthermore, we specifically use a searchlight approach rather than the region of interest (ROI) approach that previously has been commonly used, even with RSA. We do so because the searchlight approach allows for model testing in a topographically neutral manner as a searchlight volume systematically examines large swathes of the brain.
Most functional neuroimaging research on orthographic processing has used words and other types of letter and letter-like strings as stimuli and has been directed at questions regarding the orthographic specificity of left ventral temporal-occipital cortex (e.g. Baker et al., 2007; Dehaene and Cohen, 2011), the unit-size of orthographic representations in this region (e.g., words or sub-lexical units) (Nestor et al., 2012; Glezer et al.; Vinckier et al., 2007) or at questions concerning the format of orthographic representations within this area (Polk & Farah, 2002; Dehaene et al., 2001, 2004). In our work we do not address the “unit size” question, focusing instead on the question of representational format and content, without limiting ourselves to the ventral temporal-occipital region.
As we discuss below, the use of word and word-like stimuli raises specific interpretational challenges and so, to circumvent some of these, we use single letters as stimuli. A key advantage to single letter stimuli is that the multiple representations of letters are well-defined, dissociable and provide clear predictions for an RSA approach. Specifically, letters have characteristic visual shapes, spoken names and motor plans and these feature dimensions are dissociable in the sense that letters with similar visual shapes (e.g., A/R) may have different sounding names and motor plans, etc. In addition, many theories of reading and spelling posit abstract letter representations (ALIs) (Jackson and Coltheart, 2001; Brunsdon et al., 2006) that serve to unify and mediate between the different cases, fonts and modality-specific formats, such that E, e, E and /i/ all correspond to precisely the same abstract representation (Fig. 1). For these reasons, an MVPA-RSA investigation of neural responses to single letters is well-suited to addressing questions of representational format. The prediction is that if there are regions specifically tuned to abstract letter identities, letter shapes, names or motor plans they should produce similar neural responses for letters that are similar along one of these dimensions but not for letters that are similar along others. For example, in an area that specifically encodes visual letter shapes, the pattern of responses across voxels should be correlated when participants view letters with similar shapes (A/R) but not when they view visually dissimilar letters (A/S), nor when they view letters with only phonologically similar names (B/P) or similar motor plans (T/L). The same logic extends to the other modality-specific representational types. With respect to abstract letter identities (ALIs), the prediction is that neural substrates encoding these representations should respond similarly to letters that have the same identity despite differing in case and visual appearance (A/a). The further key prediction is that substrates that selectively encode ALIs should be insensitive to similarities between letters in terms of their visual-spatial, letter-name or motoric features.
Figure 1. The multiple formats of letter representation.

Visual-Spatial letter representations are case-specific representations that are invariant across different fonts. Letter-Name representations correspond to the names of letters, while Motoric representations correspond to the basic motor sequences required to produce letter shapes. Abstract Letter Identities (ALIs) are amodal, abstract representations that lack visual form (they are font and case invariant), phonological content, or motor features. ALIs mediate translation between modality-specific formats. Word reading is based on ALIs that are accessed in response to processing specific visual letter shapes and are then used to search memory for the stored orthographic representations of familiar word forms.
Theories of reading (e.g., Grainger et al., 2008) often distinguish between low-level representations of visual features of letters, high-level representations of letter shapes and abstract letter identities (ALIs) (Fig. 1). Low-level visual-feature representations correspond to those involved in visual processing more generally and would include representations computed in primary and early visual areas. At this level, the same letter in a different font (e.g., A/ A) would be represented differently. In contrast, at the level of visual-shape representations, the underlying shape/geometry of a letter is represented, in a manner comparable to what is sometimes referred to in the visual object processing literature as a “structural description” (Miozzo and Caramazza, 1998). At this level, letters in different fonts (A/ A) would share a representation but different allographs of a letter (A/a), would not. A further distinction is made by reading theories that assume that letter-shape representations are recoded into abstract letter identities (Jackson and Coltheart, 2001) that are used to search memory for stored orthographic representations of familiar word forms. Because ALIs are abstract (font and case invariant) A and a would be represented in the same way. ALIs allow readers to easily recognize words in unfamiliar fonts or case ( PeAc H). Of these three letter representation types, ALIs are the most controversial, both in terms of their existence and also with regard to their neural instantiation. Alternatives to ALI-mediated views posit that reading is based on either visual representations of letters alone or on visual exemplars of previously experienced words and letters (Tenpenny, 1995; for example, see Plaut et al., 2011 for a model of letter representation that does not include ALI’s). In fact, the contrast between the ALI vs. visually mediated views of reading is a clear example of the larger, long-standing and contentious debate between the abstractionist and grounded cognition (or semantic and episodic) views of human knowledge representation (Tulving, 1983; Barsalou, 2008).
Considerable behavioral (Besner et al., 1984; Kinoshita and Kaplan, 2008), neuropsychological (Coltheart, 1981) and neuroimaging (Dehaene et al., 2004; Polk and Farah, 2002) evidence has been put forward in support of ALIs. With regard to neural substrates, neuroimaging research has generally localized ALIs to the posterior, inferior temporal lobe (Dehaene et al., 2004). This is consistent with the mid-fusiform localization of the Visual Word Form Area (VWFA) assumed by many to be an orthographic processing area critical for word reading (Cohen et al., 2000; Tsapkini and Rapp, 2010). However, the attribution of ALIs to this brain area remains highly debated (Price and Devlin, 2003; Burgund and Edwards, 2008; Wong et al., 2009; Barton et al., 2010b, 2010a). Critically, as we review next, previous studies arguing for ALIs have not controlled for the possibility that effects attributed to ALIs might instead originate from modality-specific (visual, phonological, motor) or semantic representations of the word or letter stimuli used in these studies.
Some studies examining the nature of orthographic representations have reported similar neural responses or priming effects for orthographic stimuli presented in different fonts (Nestor et al., 2012;; Qiao et al., 2010; Gauthier et al., 2000). However, while similar responses to different-font stimuli indicate that the recruited neural representations are indeed more abstract than low-level visual feature representations, the similar responses may have originated from visual letter-shape representations rather than from ALI representations. Thus, the finding of similar cross-font responses does not necessarily implicate ALIs. Other studies have specifically manipulated letter case in order to examine issues of representational format. For example, some studies have shown that activity in the left mid-fusiform was comparable for uniform-case and mixed-case words and pseudowords (APPLE/aPpLe) (Polk and Farah, 2002; but see Kronbichler et al., 2009), or have shown priming effects for words presented in different cases (RADIO/radio) (Dehaene et al., 2001). While these findings can certainly be explained as arising at the level of ALIs, such conclusions would be premature without ruling out alternative accounts. For example, most of these studies did not control for the visual similarity between cross-case letter pairs (P/p; O/o, etc.) leaving open the possibility that the reported cross-case effects originated at some level of visual representation. While this specific possibility was addressed by Dehaene, et al. (2004) who reported cross-case word priming even for words with dissimilar cross-case letters (RAGE/rage), neither this study, nor any others, have controlled for the possibility that priming effects could have originated in the phonological letter-name representations shared by cross-case pairs. Furthermore, given that most of these studies have used word stimuli, another possible source of response similarity/priming effects could be the semantic representations of the word stimuli (i.e., RAGE/rage share a common semantic representation). A recent study specifically considered the possibility of a semantic source of priming effects and found priming for orthographically similar words in the VWFA region, but did not find priming for semantically similar words (Devlin et al., 2004). However, although a semantic source of the effects was ruled out in this particular study, the phonological similarity of the orthographically similar word (and pseudoword) pairs was not considered, nor is it clear that visual similarity between the orthographically similar word pairs was either. Other studies, by using single letter stimuli, largely eliminated a semantic locus of cross-case priming effects (Kinoshita and Kaplan, 2008). However, none of the single-letter studies controlled for the letter-name or motor similarity of letter primes and targets. Finally, although rarely discussed, the potential relevance of motor similarity between letters needs to be considered given that a number of studies have found that viewing letters may result in activation of information related to producing letter shapes (James and Gauthier, 2006; Longcamp et al., 2003; James and Atwood, 2009).
In sum, while a number of previous findings are consistent with the notion that abstract letter identities are represented in the left mid-fusiform/inferior temporal region, no study has considered all key alternative accounts, thus weakening their conclusions regarding the representation and localization of ALIs. The goal of this research is to infer the representational content of brain regions using the event-related fMRI BOLD response recorded from participants viewing single upper or lower case letters (A, a, B, b, D, d, etc.) in the context of performing a go/no go symbol (~, ?, %, &) detection task. For data analysis, we deployed a searchlight variant of MVPA-RSA (based on Kriegeskorte et al., 2008) that allowed us to evaluate the extent to which the representational similarity structure of the BOLD response for voxels within each searchlight volume corresponded to the similarity structure predicted for a volume that is sensitive to ALI, visual-spatial, letter-name or motoric similarity (Fig. 2). Our choice of stimuli (single letters), task (symbol detection) and data analysis approach (MVPA-RSA model comparison) largely eliminate the interpretative ambiguities associated with previous research on this topic.
Figure 2. Depiction of the four basic steps of the MVPA-RSA Searchlight Analysis.
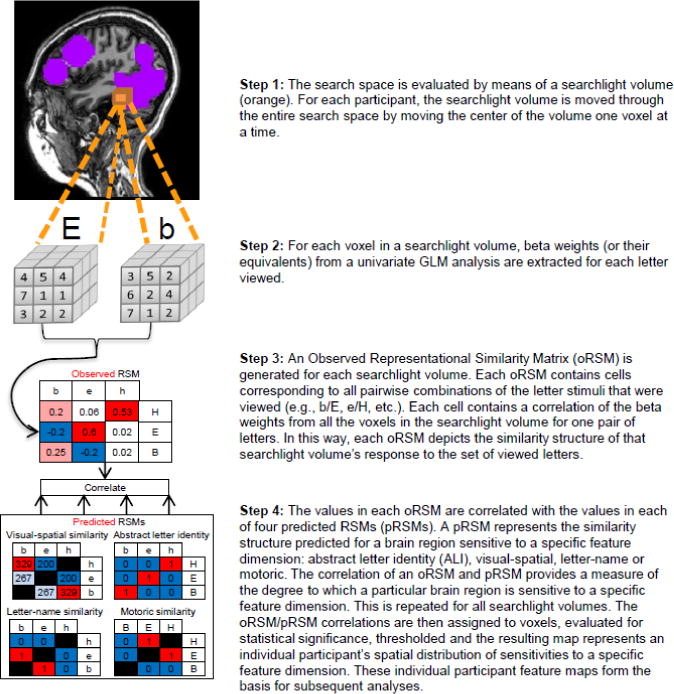
BOLD response was measured while participants viewed single (upper and lower case) letters during a symbol detection task. The search space for the analysis, depicted in purple, was derived from a functionally localized orthographic processing network.
2. METHODS
2.1. Participants
Nine right-handed individuals (5 women), ages 18–26 were students at Johns Hopkins University with no history of reading/spelling disabilities. They received payment for participation and gave written informed consent as required by the Johns Hopkins University Institutional Review Board.
2.2. Experimental procedures
Two experimental tasks were administered within one session. A Symbol Detection Task was presented for the first 6 runs followed by an Orthographic Localizer Task for two runs (Rapp and Lipka, 2011). E-Prime 2.0 software (Psychology Software Tools, Pittsburgh, PA) was used for stimulus presentation.
Stimuli for the Symbol Detection Task were lower and upper case forms of 12 letters (Aa, Bb, Dd, Ee, Ff, Hh, Kk, Oo, Pp, Rr, Tt, Uu) and 4 non-letter symbols (~, ?, %, &) (88 point Ariel font). Each stimulus appeared between two parallel lines centered on the screen; this “frame” remained on the screen throughout the experiment for better discrimination of letter stimuli that differed primarily in relative size or position (e.g., P/p). Each trial consisted of: fixation dot (200ms), stimulus (300ms) and a post-stimulus period (3500ms). Each letter stimulus was presented 12 times over the 6 runs. Participants were instructed to press response buttons with both hands when they saw a non-letter symbol. There were also “frame” trials identical to the letter/symbol trials except that no character was presented. Each run (5 minutes, 36 seconds) had 48 letter trials, 8 symbol trials and 28 frame trials, pseudo-randomly ordered. Task performance was highly accurate (error rate 0–8%, median = 2%).
In the Orthographic Localizer Task participants passively viewed: monomorphemic words, randomly generated consonant strings or a black and white checkerboard rectangle. Alphabetic stimuli (3–6 letters) appeared in lowercase and each trial consisted of: central fixation cross (550m) and a visual stimulus (200ms). Presentation was blocked by stimulus type (28 trials/block). Two runs were administered, each consisting of 6 pseudorandomly ordered stimulus blocks. Participants were instructed to view stimuli attentively.
2.3. Imaging Parameters
MRI data were acquired using a 3.0-T Philips Intera Scanner. Whole-brain T2-weighted gradient-echo EPIs were acquired with an eight-channel SENSE (Invivio) parallel imaging head coil in 29 ascending 4× 4mm slices with 1mm gap. (TR = 2 seconds for the Symbol Detection Task and 1.5 for the Orthographic Localizer Task. Echo time = 30msec, flip angle = 65°, field of view = 240 by 240mm, matrix =128 by 128mm). Structural images were acquired using an MP-Rage T1-weighted sequence yielding images with 1mm isotropic voxels (Repetition time = 8.036msec, echo time = 3.8msec, flip angle = 8°).
2.4. fMRI Data Processing
Data preprocessing was identical for both tasks, using Brain-Voyager QX 2.3 software (Maastricht, Netherlands). Functional images were aligned to the run preceding the structural scan and were corrected for slice time (slice scan time correction, ascending) and motion (trilinear 3D motion correction with sinc interpolation). A temporal high-pass filter removed components occurring fewer than three cycles per run (high-pass GLM-Fourier 3 cosines) and linear trend removal corrected for scanner drift. Images were resampled to 3mm3 voxels. For the Symbol Detection Task, no spatial smoothing was applied during pre-processing and normalization to Talairach coordinates was carried out only for data analysis that combined results across participants (Kriegeskorte et al., 2008). For the Orthographic Localizer Task, no spatial smoothing was applied and individual functional data were normalized to Talairach space.
For the Symbol Detection Task, a GLM analysis was used in an event-related design with 25 experiment-related regressors: one for each of the 24 letter stimuli and one for all symbol trials. Additionally included were: 1 linear-trend regressor, 6 head-motion parameter time-course regressors, 6 fourier-based non-linear trend regressors (up to three cycles per run for sine and cosine) and 1 confound regressor representing run number. The experimental regressors were created by convolving a Boynton hemodynamic response function with a boxcar function corresponding to the time-course for each regressor. The symbol regressor included the 4000 msec time-period of each symbol trial to capture BOLD signal associated with the motor responses produced on these trials. The letter regressors corresponded to the 300ms time periods during which the corresponding letters were displayed. Time points corresponding to the 200ms time periods when the fixation was presented as well as those corresponding to the display of the frame alone (frame trials + post-stimulus periods within letter and frame trials) were not modeled and served as the implicit baseline. The linear model expressed the fit to the fMRI data as percent signal change, resulting in beta-weight maps. Mean normalization was carried out for each voxel by subtracting that voxel’s mean beta-weight (across the 24 letter regressors) from each of the individual 24 letter regressor beta-weights for the voxel. These mean normalized beta-weight maps were used as the activation estimates for the MVPA-RSA.
For the Orthographic Localizer Task, data from 8/9 participants were analyzed (one participant had difficulty staying awake during this passive task). A fixed-effects GLM was applied using the following regressors: one for word blocks, one for consonant-string blocks, one linear-trend regressor, 6 head-motion parameter time-course regressors, 6 fourier-based non-linear trend regressors and 1 confound regressor representing run number. Time points corresponding to checkerboard blocks were not included and served as the implicit baseline. The Orthographic Processing Network was identified as all voxels for which words + consonant strings > baseline (Bonferroni correction, p<0.05).
2.5. MVPA-RSA Searchlight Analysis
Analyses were carried out in MATLAB (Math Works) and NeuroElf (http://NeuroElf.net/) was used to integrate Brain Voyager and MATLAB.
2.5.1. Search space
A bilaterally symmetric search-space was generated for each participant from the activation peaks of the group Orthographic Processing Network. These were first converted to coordinates in native space for each participant (Brain Voyager, Talairach to ACPC function) and then dilated to create spheres with 32 mm diameters that were reflected across the mid-sagittal plane.
2.5.2. Observed RSMs (oRSM) (Fig. 2 Steps 1, 2, & 3)
A searchlight method (Kriegeskorte et al., 2006) was applied such that the entire search-space was evaluated by moving the center of searchlight volume (a sphere with a diameter of 3 functional voxels, total number of voxels = 7) one voxel at a time. Only searchlight volumes with all voxels within the search space were considered. The total number of searchlight volumes ranged from 11,620 to 16,222 across participants, with an average of 13,865 oRSMS per participant. To characterize the similarity structure of each searchlight volume’s BOLD response to the stimulus set, an oRSM was generated for each volume. Each oRSM consisted of a matrix of correlation values, with the cells of the matrix corresponding to the Pearson correlations of all the beta-weight -values within the searchlight volume for all pairwise combinations of the 24 letter stimuli, 12 upper case +12 lower case letters. For example, the [bA] cell corresponded to the correlation of the beta-weight -values of the 7 voxels in the searchlight volume generated in response to viewing [b] with the beta-weight values for those same voxels generated in response to viewing [A]. Each matrix was triangular (due to symmetry across the diagonal) and the cells in the diagonal were excluded as their predicted correlation values would necessarily equal 1.
2.5.3. Predicted Representational Similarity Matrices (pRSM) (Fig. 2 Step 4)
A pRSM corresponds to the ideal (predicted) similarity matrix for a region sensitive to a specific feature dimension. Four pRSMs were constructed, one for each feature dimension: ALI, visual, letter-name and motoric. For the ALI pRSM, the predicted letter-pair similarity/dissimilarity is straightforward: cross-case pairs are predicted to produce the same responses across voxels (correlation=1) while all other pairs are predicted to generate uncorrelated responses (correlation=0). The letter-name pRSM was developed empirically from a letter-name confusability matrix that reported the perceptual confusions of participants asked to identify letter names that were aurally presented in noise (Hull, 1973). The number of confusions for each letter pair was binarized with 1 assigned to letter pairs for which the number of confusions was equal to or greater than the mean number of confusions across all letter pairs included in the Hull (1973) study; all other pairs were assigned 0. It is important to note that there can be no auditory confusability data for cross-case letter identity pairs as they share the same name and, therefore, we assigned these pairs a value of 1 in the letter-name pRSM. Values for the visual pRSM were based on the subjective similarity of letter pairs, derived empirically from Boles and Clifford (1989), a study in which participants were asked to rate the similarity (1 dissimilar; 5 most similar) of each visually presented letter pair. Presumably, subjective visual similarity judgments of this sort capture both high and low level aspects of visual similarity. The subjective visual similarity pRSM consisted of the mean similarity judgment values in each of the cells of the matrix reported by Boles and Clifford (1989). The motoric pRSM was derived from a written stroke-feature similarity metric developed by Rapp & Caramazza (1997) and then validated against written letter confusions produced by individuals with acquired dysgraphia. In the Rapp & Caramazza (1997) work, letter-pairs were categorized as either being motorically similar or dissimilar and, on this basis, were assigned a 1 or 0 respectively in the pRSM. Since motor similarity measures were validated only for letter-pairs of the same case, cross-case letter pairs were omitted from the motoric pRSM (although, as will be noted later, they were included in the regression analysis).
2.5.4. Sensitivity Analyses
The goal of these analyses was to identify brain regions sensitive to each feature dimension. As we describe in detail below, we first carried out single subject analyses to identify feature-sensitive regions in individual participants. We then carried out group analyses directed at identifying regions that exhibited consistent feature-sensitivity across participants.
To generate Participant Feature Sensitivity Maps, every participant’s oRSM was correlated (Pearson) with each of the four pRSMs. The correlation values were converted to p-values via a MATLAB (Math Works) correlation function and the resulting p values were converted to z-scores and then were assigned to the center voxels of the searchlight volumes from which the z-scores were derived. This process generated z-scores for all voxels that served as searchlight volume centers, yielding four z-score maps for each participant, with each map representing a participant’s sensitivity to a specific feature dimension.
For each feature dimension, we then formed a group sensitivity map by first smoothing (2 FWHM) and normalizing the participant sensitivity maps into Talairach space. We then combined the maps across the participants and performed a t-test over the participant sensitivity z-values at each voxel, generating a Group Feature Sensitivity Map. The t-values at each voxel for each Group Feature Sensitivity map were subjected to an FDR correction (q<0.05) for multiple comparisons.
2.5.5. Selectivity Analysis
The goal of these analyses was to identify neural regions that were selectively responsive to one feature dimension only. We evaluated selectivity with 3 analyses: (1) An ANOVA Selectivity Comparison Analysis that identified voxels with greater responsivity to one feature dimension compared to the other three; (2) A Permutation Selectivity Analysis that evaluated the number of participants with feature-selective responses at each voxel and (3) A Regression Analysis that determined the relative contributions of each feature dimension to the similarity structure of each oRSM.
(1) ANOVA Selectivity Comparison Analysis
The Participant Feature Sensitivity Maps for each of the 4 feature dimensions were smoothed (2 FWHM) and normalized to Talaraich space. At each voxel, ANOVA was used to evaluate if the z-values from the 9 participants on one of the feature dimensions were greater than the values associated with the other 3 feature dimensions. Four planned comparisons were implemented at each voxel—one for each feature dimension contrasted with the other three. The F-values from each comparison formed 4 Selectivity Comparison Maps. Each Selectivity Comparison Map was corrected for multiple comparisons using Brain Voyager’s Clustersize Thresholder Plugin (voxelwise threshold: p<0.05; clustersize p<0.05).
(2) Permutation Selectivity Analysis
Using the Participant Feature Sensitivity Maps, for each participant and for each feature dimension, we first identified all voxels with uncorrected, voxelwise p < 0.05 on only one of the four feature dimensions. We refer to these as feature-selective voxels and refer to the maps that identify these voxels as Participant Feature Selectivity Maps. Second, the Participant Feature Selectivity Maps were normalized in to Talairach space and combined across participants by calculating, for each voxel, the number of subjects demonstrating feature selectivity. This process yielded four Group Feature Selectivity Maps that report, for each voxel, the number of participants for whom the voxel was selective for a specific feature dimension. We applied a threshold to each of these maps to identify only those voxels at which all 9 participants showed selectivity. Finally, the clusters formed by this thresholded Group Feature Selectivity Maps were evaluated for statistical significance using a permutation simulation that was based on randomly generated pseudo Participant Feature Sensitivity Maps. The Pseudo Participant Feature Sensitivity Maps were generated by scrambling the labels of the actual participant beta-maps (e.g. the beta values associated with the letter H regressor were labeled as letter d, etc.). They were then analyzed in precisely the same manner as the actual data were. The searchlight analysis described earlier in the section on oRSM’s was applied to the randomized data sets yielding, for each voxel, a correlation between the pseudo pRSMs and the actual oRSM. These correlations were then converted to z-scores, to form Pseudo Participant Feature Sensitivity Maps. The Pseudo Participant Feature Sensitivity Maps were evaluated for selectivity voxels, yielding Pseudo Participant Feature Selectivity Maps. Following this, Pseudo Group Feature Selectivity Maps were obtained by combining the Pseudo Individual Feature-Selectivity Maps for each feature dimension. We then identified voxels where all 9 participants showed selectivity for only one feature dimension and, for each thresholded map, we recorded the size of the largest cluster of voxels. This process was repeated 1000 times, providing a distribution of 1000 clustersizes for each pseudo feature dimension. Following the logic of Nichols and Holmes (2002), the cluster size threshold to be applied to the actual Group Feature Selectivity Maps was selected from these distributions such that fewer than 5% of the Pseudo Group Selectivity Maps contained a cluster greater than the threshold cluster size. Note that this method of evaluating significance reproduces–with randomly permuted data sets–precisely the same analysis procedure that was carried with the actual data sets. This distribution-free simulation approach allows for an estimate of chance that is unbiased and does not employ statistical assumptions at any point in the data analysis stream that were not also used in the analysis of the actual data sets.
3) Feature Dimensions Regression Analysis
For each participant, each oRSM was evaluated in a regression analysis that included 4 regressors that corresponded to the ALI, letter-name, subjective visual similarity, and motoric1 pRSMs, and a constant. In order to compute standardized regression coefficients, each oRSM and pRSM was standardized to have mean of 0 and standard deviation of 1 before entering the regression. The regression analysis was carried out using MATLAB’s REGRESS function. Each regression analysis produced 4 β values, one for each feature dimension. For each participant, a Participant Feature Beta-Map was formed for each feature dimension by assigning, for each oRSM, that regressor’s β value to the central voxel of the searchlight region over which the oRSM was computed. The Participant Feature Beta-Maps were then spatially normalized to Talariach space, smoothed (2 FWHM) and combined across participants. For each feature and at each voxel, a Group Feature Regression Map was computed by performing a t-test over the β-values for that feature across the 9 participants. The t-values for each Group Feature Regression Map were evaluated for statistical significance following correction for multiple comparisons using Brain Voyager’s Clustersize Thresholder Plugin (voxelwise threshold: p<0.1; clustersize p<0.05).
2.6. Comparison with reading (and spelling) networks
To evaluate the degree to which the feature-selective regions identified in the sensitivity/selectivity analyses described just above overlapped with neural areas involved in word reading we used data from the Orthographic Localizer task to identify the Word Reading Network identified for the same participants. A random effects GLM was used to identify all the voxels for which words > checkerboard baseline (uncorrected voxelwise p < 0.025; clusterwise corrected p < 0.05). Note that the consonant string regressor was not included as the goal was to specifically identify the word reading network.
3. RESULTS
3.1. Search space and observed and predicted RSMs (oRSMs and pRSMs)
The search space was generated from the functionally localized Orthographic Processing Network, consisting of voxels for which the group activity for words + consonant strings > baseline. For each participant, this group network was transformed into native space, dilated and reflected across the mid-sagittal plane to create a bilaterally symmetric search space with an average, across participants, of 16,539 functional voxels (range: 14,267–18,636). The resulting region covered: the occipital lobes, the temporal lobes (except the anterior poles), the angular gyri, and the inferior and middle frontal gyri (Fig. 2).
For each participant, each oRSM consisted of the pairwise Pearson correlations of the beta-weights of the voxels within a given searchlight volume for all pairwise combinations of the 24 stimulus letters. The average number of oRSMs per participant was 13,865 (range: 11,620–16,222).
For comparison with the oRSMs, four Predicted Representational Similarity Matrices (pRSMs) were created in order to represent the predicted pairwise similarity that would be expected for areas sensitive to visual, letter-name, motoric or abstract identity features and, in this way, they served as quantitative models of similarity (and dissimilarity) for each of the four feature dimensions. The four pRSMs that were generated were of similar sizes, with number of cells ranging from 138 to 276.
3.2. Sensitivity Analyses: Identifying feature-sensitive substrates
The Participant Feature Sensitivity Maps depict, for each participant, the results of testing the similarity structure of the neural responses in each searchlight region against the response structure that would be predicted for each feature dimension by correlating every oRSM with each of the four pRSMs. This process yielded four z-maps for each participant, each representing sensitivity to a specific feature dimension across the search space, which were then combined into Group Feature Sensitivity Maps with t-values at each voxel. Table 1 reports, for each feature dimension, the voxels that surpassed an FDR corrected threshold (q<0.05) and Figure 3 depicts the neurotopographic distribution of t values (t=0 to +4) for each of the feature dimensions.
Table 1. Feature-Sensitive Clusters.
For each of the feature-sensitive clusters identified, information regarding cluster size, neuroanatomical location, Talairach and MNI coordinates of the peak voxels, as well as the t-value at the peak. MNI coordinates were calculated using NeuroElf (http://NeuroElf.net/). Clusters were identified, correcting for multiple comparisons, by applying an FDR threshold of q<0.05 and a cluster size threshold of at least 2 functional voxels.
| Feature dimension | Anatomical label | Peak Coordinate TAL | Peak Coordinate MNI | # of voxels | t value at peak | ||||
|---|---|---|---|---|---|---|---|---|---|
|
| |||||||||
| X | Y | Z | X | Y | Z | Functional Voxels | T(8) | ||
| Abstract Letter Identity | R. Post. IFG | 33 | 11 | 19 | 33 | 10 | 21 | 2 | 7.39 |
| R. Mid Fus. | 33 | −49 | −9 | 33 | −50 | −14 | 9 | 5.68 | |
| L. Post. Lingual | −11 | −67 | −11 | −11 | −68 | −17 | 4 | 4.98 | |
| L. MOG | −18 | −88 | −2 | −18 | −91 | −8 | 4 | 5.32 | |
| L. Ant. MOG | −27 | −72 | −1 | −27 | −74 | −5 | 21 | 6.7 | |
| L. IPS | −26 | −67 | 40 | −26 | −71 | 40 | 3 | 5.39 | |
| L. Mid Fus. | −30 | −58 | −11 | −30 | −59 | −17 | 2 | 7.04 | |
| L. MFG | −42 | 14 | 43 | −42 | 12 | 47 | 3 | 5.25 | |
|
| |||||||||
| Letter-Name Similarity | L. Post. MTG | −44 | −55 | −1 | −44 | −57 | −4 | 4 | 5.63 |
|
| |||||||||
| Visual-Spatial Similarity | R. MOG | 36 | −76 | 1 | 36 | −78 | −3 | 21 | 5.89 |
| R. Occ. Pole | 16 | −88 | 1 | 16 | −91 | −4 | 55 | 6.54 | |
| L. Post. Precuneus | −14 | −61 | 25 | −14 | −64 | 24 | 3 | 4.59 | |
| L. OTS | −42 | −54 | −10 | −42 | −55 | −15 | 11 | 6.99 | |
|
| |||||||||
| Motoric Similarity | L. IPS | −20 | −56 | 25 | −20 | −59 | 24 | 9 | 7.89 |
Figure 3. Unthresholded Group Feature Sensitivity Maps depicting brain regions sensitive to each feature dimension.
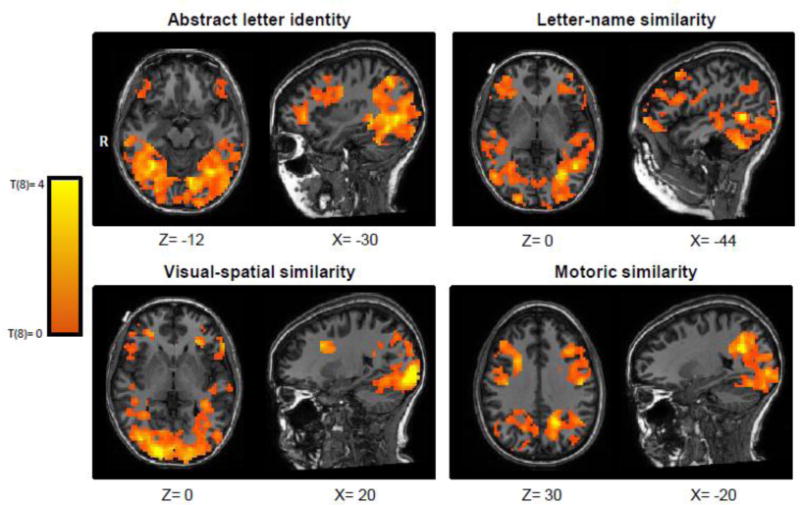
Each Group Feature Sensitivity Map was obtained from combining Individual Sensitivity maps (after Talairch normalization and Gaussian smoothing at 2 FWHM) and then carrying out a one-way, two-tailed, t-test at each voxel. These unthresholded t-maps depict the topography of feature-sensitivity for each of the four feature dimensions. Significant clusters after FDR correction are reported in Table 1.
The overall neurotopographic distribution of feature sensitivities depicted in Figure 3 show differences between the different feature dimensions. For example, sensitivity to ALI is more anteriorly distributed than is visual-spatial sensitivity. Motoric sensitivity is weighted more heavily along the dorsal pathway than ventral, with visual-spatial sensitivity showing the opposite distribution. Letter-name sensitivity is more superiorly distributed in the posterior brain than is ALI. These general trends are, unsurprisingly, reflected in the statistically significant findings obtained for each feature dimension. For abstract letter identity, 8 statistically significant clusters of voxels were identified. Importantly, there was a set of four clusters that extended anteriorly from the left posterior middle occipital gyrus (peak coordinate: −18,−88,−3) along the lingual gyrus and terminating on the left middle fusiform gyrus (−30, −58, −11). Additionally there were ALI sensitive voxels in the right mid fusiform gyrus (33, −49, −9), the right posterior inferior frontal gyrus (33, 11, 19), the left intraparietal sulcus (−26, −67, 40) and the left middle frontal gyrus (−42, 14, 43). For visual similarity, there were four clusters of feature-sensitive voxels—two located in the right posterior occipital lobe (16, −88, 1) and (36, −76, 1), one cluster in the left posterior precuneus (−14, −61, 25), and one in the left occipital temporal sulcus (−42, −54, −10). With regard to letter-name similarity, significant voxels were identified in the left posterior middle temporal gyrus (−44, −55, −1). Finally, voxels significantly sensitive to the motoric feature dimension were identified in the left intraparietal sulcus (−20, −56, 25).
3.3. Selectivity Analyses: Identifying feature-selective neural substrates
The selectivity analyses were directed at identifying regions responsive to one dimension of letter similarity to the exclusion of all the others. Three different analyses were used to assess selectivity for each feature dimension.
(1) The ANOVA Selectivity Comparison Analysis identified voxels where the z-scores corresponding to the oRSM-pRSM correlations for one feature dimension were greater than those of the other 3 feature dimensions. Table 2 (see also Figure 4) reports the clusters significantly selective for each feature dimension; significance was assessed by applying a clustersize threshold (voxelwise threshold p<0.05; clustersize threshold p<0.05). Subpeaks within these clusters were identified as the peak voxels of clusters (of at least 3 functional voxels) that survived a voxelwise threshold of p<0.01. This analysis identified 3 ALI-selective clusters. One cluster (277 voxels) extended from the left posterior middle occipital gyrus to the middle fusiform gyrus along the lingual gyrus. There were 2 subpeaks associated with this cluster; one in the left lingual gyrus (−9, −64, − 8), and the other in the left mid fusiform gyrus bordering the collateral sulcus (−30, −57, −10). Another cluster (143 voxels) was centered in the right superior temporal gyrus (59, −40, 10). A third cluster (131 voxels) extended from one subpeak in right retrosplenial cortex (26, −55, 13) to a second subpeak in the right intraparietal sulcus (23, −72, 30). With regard to visual feature selectivity, a cluster was identified in the right hemisphere, extending from the occipital pole, straddling the calcarine sulcus and extending anteriorly into the middle and inferior occipital gyri (272 voxels). This cluster contained two subpeaks, one on the right occipital pole (18, −88, 2) and one in the right middle occipital gyrus (29, −70, −2). The ANOVA Selectivity Comparison Analysis found no clusters that were significantly selective for the letter name or motoric feature dimensions.
Table 2. Feature-selective clusters identified in the ANOVA Selectivity Comparison Analysis.
For each of the significant feature-selective clusters identified, information regarding cluster size, neuroanatomical location, Talairach and MNI coordinates of the peak voxels, the f-value at the peak voxel and cluster boundaries in Talairach coordinates. MNI coordinates were calculated using NeuroElf (http://NeuroElf.net/). Reported clusters were corrected for multiple comparisons (voxelwise uncorrected, p<0.05; cluster size corrected, p<0.05). Subpeaks are reported in italics.
| Feature dimension | Anatomical label | Peak Coordinate TAL | Peak Coordinate MNI | F value at peak | # of voxels | Range (TAL) | ||||||
|---|---|---|---|---|---|---|---|---|---|---|---|---|
|
| ||||||||||||
| X | Y | Z | X | Y | Z | F(3,32) | Functional Voxels | X-Range | Y-Range | Z-Range | ||
| Abstract Letter Identity | R. STG | 59 | −40 | 10 | 60 | −42 | 9 | 16.5 | 143 | 45 to 68 | −51 to −25 | −1 to 22 |
| R. RSC | 26 | −55 | 13 | 26 | −57 | 11 | 8.61 | 131 | 9 to 32 | −78 to −49 | 2 to 40 | |
| R. IPS | 23 | −72 | 30 | 23 | −76 | 29 | 7.89 | |||||
| L. Post. Lingual | −9 | −64 | −8 | −9 | −65 | −13 | 19.41 | 277 | −42 to −4 | −87 to −46 | −16 to 25 | |
| L. Mid. Fus. | −30 | −57 | −10 | −30 | −8 | −15 | 12.27 | |||||
|
| ||||||||||||
| Visual-Spatial Similarity | R. Occ. Pole | 15 | −96 | 0 | 15 | −99 | −6 | 29.47 | 429 | −50 to 9 | −93 to −34 | −28 to 7 |
| R. MOG | 33 | −74 | −5 | 33 | −76 | −10 | 9.80 | |||||
Figure 4. Group ANOVA Selectivity Comparison Maps depicting brain regions selectively tuned to ALI and Visual-Spatial features.
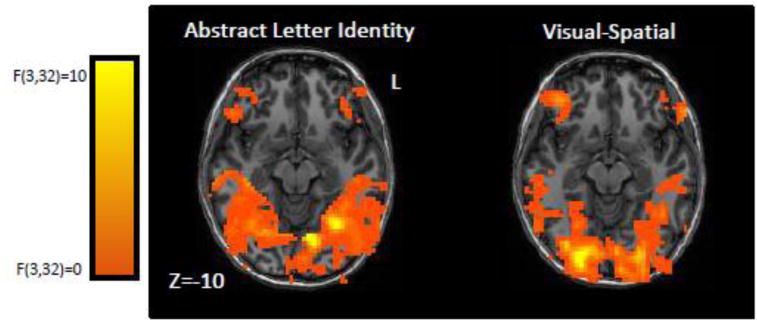
Each Group Selectivity Map was obtained from combining Individual Feature Sensitivity Maps (after Talairch normalization and Gaussian smoothing at 2 FWHM) and then carrying out four voxelwise ANOVA comparisons testing if activation from one feature dimension was greater than activation from the other 3. The maps are shown at a voxelwise threshold of f(3,32)>0. Only results from the Visual-Spatial and ALI feature dimensions are shown since the letter-name and motoric feature dimensions did not yield any significant clusters. See text for further details and Table 2 for information regarding clusters that were statistically significant after correction for multiple comparison.
(2) The Permutation Selectivity Analysis identified clusters where all nine of the of participants demonstrated feature selectivity. Cluster sizes were assessed for significance using a permutation analysis (corrected p<0.05). This analysis yielded feature-selective clusters for the ALI and visual feature dimensions, see Table 3 and Figure 5, but not for letter name or motoric similarity. For the ALI feature dimension, there was a single cluster of 4 functional voxels within the left mid-fusiform gyrus (−31, −58, −14) and for the visual feature dimension there were 3 clusters in the right posterior occipital lobe: one centered on the right occipital pole (3 voxels; 19, −90, 6) and two centered in the right inferior occipital gyrus (3 voxels; 22, −86, −8) and (3 voxels; 20, −81, −7).
Table 3. Feature-selective clusters identified in the permutation analysis.
Reported clusters consist of voxels at which all 9 participants showed feature selectivity and survived cluster-size correction for multiple comparisons (p<0.05). For each of the significant feature-selective clusters identified, information regarding cluster size, neuroanatomical location, Talairach and MNI coordinates of cluster centers. MNI coordinates were calculated using NeuroElf (http://NeuroElf.net/).
| Feature dimension | Anatomical label | Peak Coordinate TAL | Peak Coordinate MNI | # of voxels | ||||
|---|---|---|---|---|---|---|---|---|
|
| ||||||||
| X | Y | Z | X | Y | Z | Functional Voxels | ||
| Abstract Letter Identity | L. Fusiform | −31 | −58 | −14 | −31 | −59 | −20 | 4 |
|
| ||||||||
| Visual-Spatial Similarity | R. IOG | 22 | −86 | −8 | 22 | −88 | −15 | 3 |
| R. MOG | 19 | −90 | 6 | 19 | −93 | 2 | 3 | |
| R. IOG | 20 | −81 | −7 | 20 | −83 | −13 | 3 | |
Figure 5. Group Permutation Selectivity Maps depicting brain regions selectively tuned to ALI and Visual-Spatial features.

Each group selectivity map was obtained by computing, at each voxel, the number of participants that exhibited selectivity to a single feature dimension. Selectivity was defined as a voxel in the Participant Feature Sensitivity Maps that exceeded p<0.05 voxelwise threshold for only one feature dimension. On the left are images from the Group ALI Selectivity Map and on the right are images from the Group Visual-Spatial Selectivity Map. Motoric and Letter Name Group Selectivity Maps were not included as these analyses did not yield significant clusters. The images report voxels where at least 6 participants showed response selectivity Clusters where all 9 participants showed selectivity (depicted in bright yellow) were additionally determined to be significant (p<0.05) after a permutation-based cluster-size correction for multiple comparisons.
(3) The Feature Dimensions Regression Analysis determined the magnitude of the unique contribution of each feature dimension (pRSMs) to explaining the observed correlations between all letter pairs (oRSMs). Figure 6 depicts the neurotopographic distribution of t-values (0 to +4) obtained from this analysis for each of the feature dimensions. In this analysis, significance was assessed using a cluster-size threshold (voxelwise uncorrected p<0.10; cluster size corrected p<0.05) and subpeaks were identified as peak voxels of clusters (of at least 3 functional voxels) that survived a voxelwise threshold of p<0.01 (see Table 4).
Figure 6. Group Regression Map.
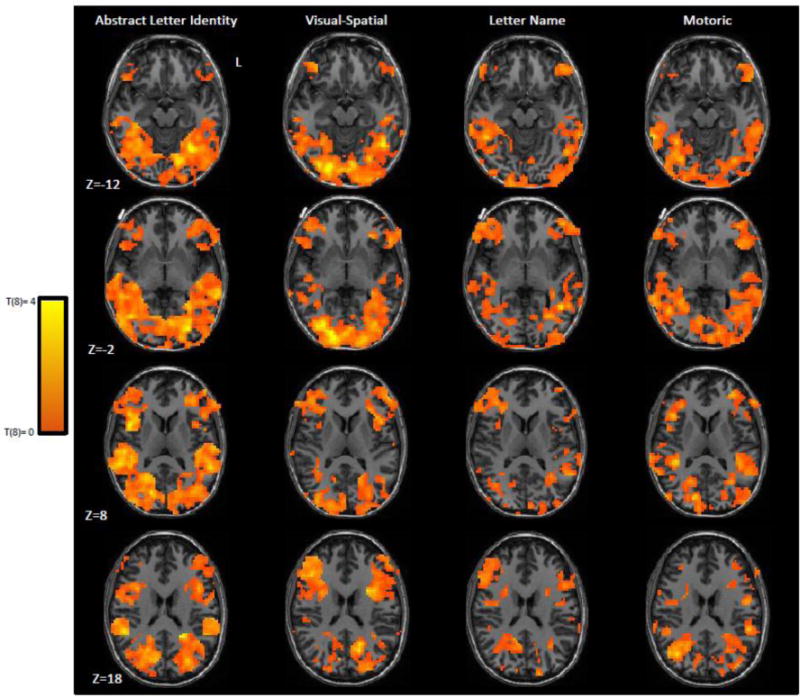
Each group regression map was obtained by carrying out, at each searchlight volume, a regression analysis to determine the unique contribution of each feature dimension; the resulting beta weights for each dimension were then subjected to a one-way, two-tailed, t-test evaluation. Depicted are 4 horizontal slices from the unthresholded Group Regression Selectivity maps for each of the feature dimensions. Only the Abstract Letter Identity and Visual Spatial feature dimensions yielded significant clusters and these are reported in Table 3.
Table 4. Feature-Selective clusters identified in the regression analysis.
For each of the significant feature-selective clusters identified, information regarding cluster size, neuroanatomical location, Talairach and MNI coordinates of the peak voxels, the t-value at the peak and cluster boundaries in Talairach coordinates. MNI coordinates were calculated using NeuroElf (http://NeuroElf.net/). Reported clusters were corrected for multiple comparisons (voxelwise uncorrected, p<.05; cluster size corrected, p<.05). Subpeaks are reported in italics.
| Feature dimension | Anatomical label | Peak Coordinate TAL | Peak Coordinate MNI | T value at peak | # of voxels | Range (TAL) | ||||||
|---|---|---|---|---|---|---|---|---|---|---|---|---|
|
| ||||||||||||
| X | Y | Z | X | Y | Z | T(8) | Functional Voxels | X-Range | Y-Range | Z-Range | ||
| Abstract Letter Identity | L. Fusiform | −32 | −59 | −13 | −32 | −60 | −19 | 5.7 | 486 | −50 to 9 | −93 to −34 | −28 to 7 |
|
| ||||||||||||
| Visual-Spatial Similarity | R. MFG | 18 | −88 | −1 | 18 | −91 | −6 | 7.23 | 418 | −14 to 42 | −99 to −67 | −25 to 10 |
| L. STS | 21 | −82 | −8 | 21 | −84 | −14 | 6.19 | |||||
Similar to what was found in the two other selectivity analyses (see Figure 7), a large cluster of voxels was identified at which the ALI feature dimension accounted for unique variance. This extended from the posterior middle occipital gyrus to the mid fusiform gyrus and superior temporal sulcus (486 voxels). There was a single peak associated with this cluster in the left mid fusiform gyrus (−32, −59, −13). Additionally, there was a cluster for the visual feature dimension in the right hemisphere extending from the occipital pole anteriorly along the middle and inferior occipital gyri (418 voxels). This cluster had 2 subpeaks—one located on the right occipital pole (18, −88, 1) and the other located in the right inferior occipital gyrus (21, −82, −8). No significant clusters were identified for letter-name or motoric similarity.
Figure 7. The significant clusters identified in each of the three selectivity analyses.
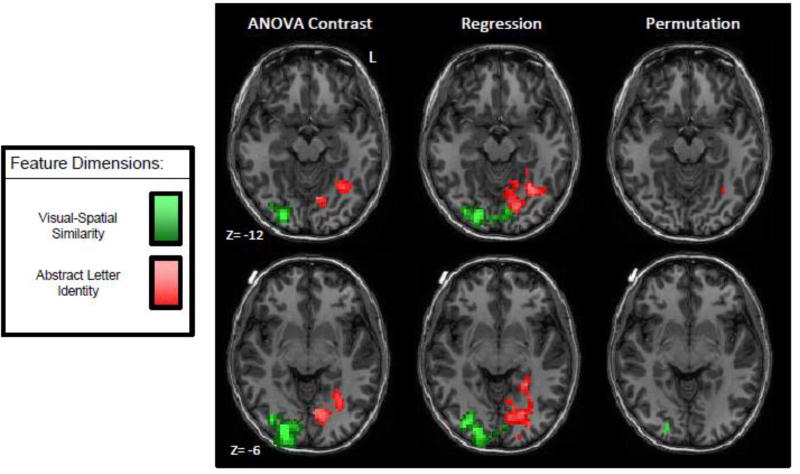
For each of the maps, Visual-Spatial selectivity is depicted in green and Abstract Letter Identity is depicted in red. For the ANOVA comparison significant clusters (uncorrected voxelwise threshold p<0.05; corrected cluster size threshold p<0.05) are shown in a scale where the darker colors indicate lower f-values and lighted colors indicate higher f-values. For the regression analysis significant clusters (uncorrected voxelwise threshold p<0.10; corrected cluster size threshold p<0.05) are shown in a scale where the darker colors indicate lower t-values and lighted colors indicate higher t-values. For the permutation analysis, selectivity maps were thresholded to depict only voxels where all 9 participants showed selective tuning with cluster-size correction for multiple comparisons (p<0.05). Specific details from these analyses are reported in Tables 2–4. The Letter-Name and Motoric feature dimension are not depicted because significant clusters were not identified for these feature dimensions in these analyses.
In order to understand the degree to which each of the feature dimensions made a unique contribution within the significant visual and ALI clusters that were identified in the previous analysis step, we examined the average t-value from the regression analyses for every feature dimension within each cluster separately (Figure 8). As can been seen from the graph in this figure, the average t-value across the voxels in the ALI cluster is, not surprisingly, large for the ALI feature dimension and, more importantly, very small (positive or negative) for the other feature dimensions. For the visual cluster, the average t-value is large for the visual feature dimension and negative for the other tested feature dimensions. This result and the fact that there was no overlap between the significant ALI and visual feature clusters demonstrates the high degree of selectivity for both the ALI and visual features within these regions.
Figure 8. The contribution of each feature dimension to the brain regions identified by the regression analysis as significant for ALI and Visual-Spatial similarity.
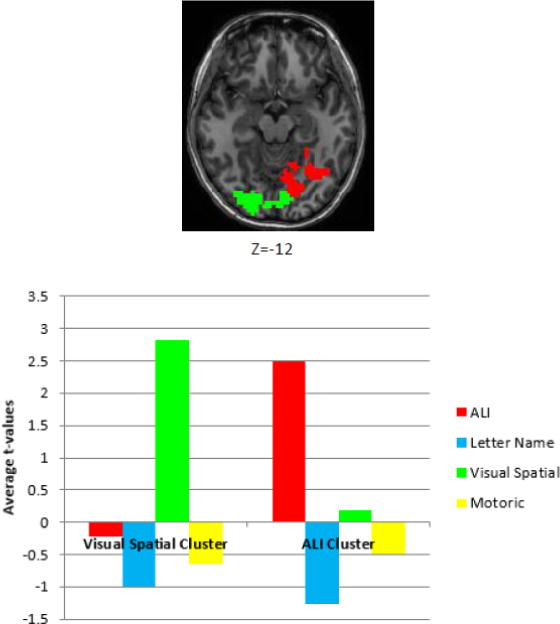
The images depicts the clusters identified in the regression analysis as significant for Abstract Letter Identity (red) and Visual-Spatial Similarity (green). The graph depicts the regression t-values averaged across the voxels within each of the significant clusters.
Selectivity Analyses: Summary2
Figure 7 depicts the significant clusters identified in the three selectivity analyses. The figure illustrates that despite the very different analytic approaches, substrates that are highly tuned to ALI and visual-spatial features were identified. The ALI-tuned area identified across the three methods is centered on −31, −58, −12; for visual-spatial features, the three methods identify substrates centered on 20, −86, −3.
3.4 Examining possible contributions of visual similarity to ALI selectivity findings
One potential concern regarding the ALI selectivity findings reported in the previous section is whether these results could have been driven by visual similarity between cross-case letter pairs. This seems unlikely because, in all three of the selectivity analyses, the ALI-selective regions that were identified are neurotopographically nonoverlapping with the regions identified as visually selective. Nonetheless, to directly evaluate this possibility, we considered the ALI cluster identified in the regression analysis (see Figure 9) and, for this cluster, compared two ALI pRSMs: one that predicted that only the 6 most visually similar cross-case identity pairs would produce identical neural responses (and all other pairs should not be correlated) and one that predicted that only the 6 most visually dissimilar cross-case identity pairs would be identical. We used the subjective similarity judgments (Boles & Clifford, 1989) to identify the 6 most similar cross-case, same identity pairs (oO, uU, pP, fF, kK, tT) and the 6 most dissimilar pairs (aA, eE, bB, dD, hH, rR). These two sets were significantly different in terms of the subjective similarity scores reported by Boles and Clifford (1989) (t(5) = 7.48, p<0.001).
Figure 9. Sensitivity of visually similar vs. visually dissimilar cross-case, same identity pairs within the ALI region (in red) identified in the regression analysis.
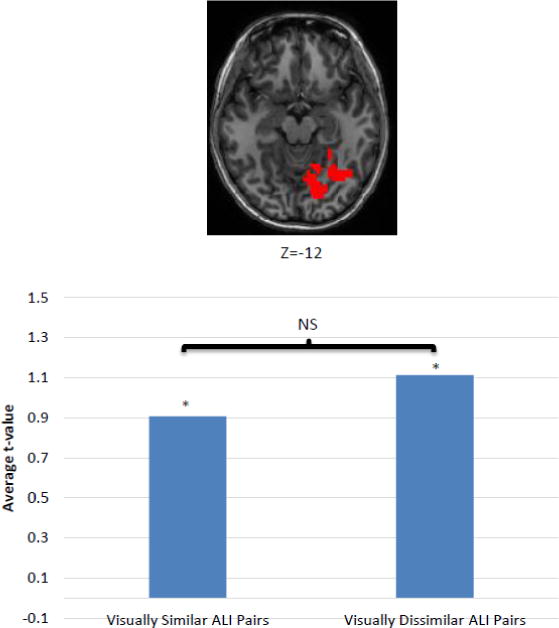
The bar graph depicts the average t-value for voxels within the ALI-selective region for Group Sensitivity Maps based on a pRSM model in which the 6 most visually similar cross-case identity pairs are treated as ALIs and a pRSM in which the 6 most visually dissimilar cross-case identity pairs are treated as ALIs. The results indicate that visually similarity does not determine or influence responsivity to ALI.
To carry out this analysis we generated two sets of Group Feature Sensitivity Maps, for the visually similar and visually dissimilar ALI pRSMs respectively. Within the ALI cluster identified in the regression analysis, for each of these two pRSMs we then computed the average t-value across the voxels. Significance of the average t-values was evaluated via a permutation analysis that involved generating 1000 Pseudo Group Feature Sensitivity Maps for each pRSM by running the sensitivity analysis over individual beta-maps in which the letter-identity labels had been scrambled. We then used the Pseudo Group Feature Sensitivity Maps to compute two distributions (one for each pRSM) of 1000 average t-values within the ALI cluster. We then evaluated the statistical significance of the actual average t-values for the two pRSMs by ranking them against the permutation distribution.
If the ALI cluster identified in the regression analysis had been identified on the basis of a high degree visual similarity between the cross-case identity pairs, we would expect two things: first, the visually similar ALI pRSM should have higher t-values than the visually dissimilar ALI pRSM and, second, the visually dissimilar ALI pRSM should not be significant. Instead, as reported in Figure 9, we found that the average t-values from both the visually similar and visually dissimilar ALI pRSMs were both significantly greater than 0 (p<0.05) and that there was no significant difference between the two. Thus, these findings provide no support for the notion that the ALI region was identified due to visual similarities between cross-case letter pairs.
3.5. Evaluating the relationship between letter representations and word reading networks
In this section we compare the clusters associated with each feature dimension in the letter viewing task and the Word Reading Network derived from the Orthographic Localizer task (with the same participants). For ALI, the center of the overlap region for the three selectivity analyses is −31, −58, −12. This falls slightly medial to the left mid fusiform word reading cluster (−42, −53, −18) at a Euclidean distance of 13mm. For the visual feature dimension, the center of the region where all 3 selectivity analyses overlap is 20, −86, −3, bordering a cluster that was more active for Checkerboard > Words (6, −74, 13; Euclidean distance = 24mm). Since there were no significant selectivity clusters for the letter-name and motoric feature dimensions, we considered the sensitivity clusters that were obtained for these feature dimensions. The letter-name sensitivity cluster was centered on the left middle temporal gyrus (−44, −55, −1), posterior to left STS word reading cluster (−51, −31, 3; Euclidean distance = 25mm). Finally, while the motor sensitivity cluster, centered just medial to the left IPS (−20, −56, 25), did not have any obvious correspondence in the word reading network, a number of studies investigating the neurotopography of spelling have found activation in this region. Specifically, Rapp and Dufor (2012) identified a region (−25, −68, 33) that was more active during written word production than drawing circles (Euclidean distance=15mm). The motoric feature cluster was also located near a cluster reported in a meta-analysis (Purcell, et al. 2011b) of the neural substrates of spelling (−29, −63, 37; Euclidean distance= 17mm).
In sum, the proximity of feature selective/sensitive substrates and key regions within word reading and spelling networks provides support for a functional role for abstract and modality-specific letter representations in word reading and spelling. In turn, the selectivity findings shed light on the representational format of key regions in the reading and spelling network.
4. DISCUSSION
The goal of this investigation was to evaluate the similarity structure of neural responses to viewed letters by comparing them to models of the similarity structures predicted for regions encoding abstract letter identities (ALIs) or modality-specific visual-spatial, letter-name or motoric representations of letters. This direct approach to these questions of neuronal representation identified specific neural substrates selectively tuned to different representational types.
4.1. Selective tuning to abstract letter representations
A key result was the finding of a brain region, straddling the mid-fusiform and parahippocampal gyrus (BA 37) that is selectively tuned to ALIs. This region was consistently revealed by three different statistical approaches that were deployed to identify selective tuning to a specific feature dimension. This region generated similar response patterns to pairs of letters that shared an identity and it produced dissimilar response patterns to all other pairwise combinations of letters. Importantly, we were able to show that the representations instantiated in this area were insensitive to similarities between letters in terms of their visual-spatial attributes, spoken letter names or motor plans.
While previous functional neuroimaging studies have proposed that ALIs are represented in this general area (Polk and Farah, 2002; Dehaene et al., 2004), we were able to rule out a full range of modality-specific confounds not addressed in previous work by contrasting models via MVPA-RSA searchlight methods. In addition, although the investigation directly evaluated the representational format of single letters, a functional role for ALIs in word reading and spelling was strongly supported by the co-location of the ALI-selective substrates within the word reading network independently identified for the same participants. This region has been strongly associated with orthographic processing in adult reading (Binder et al., 2006; Cohen et al., 2000; Gaillard et al., 2006; Dehaene et al., 2002; Jobard et al., 2003) and spelling (Rapp and Lipka, 2011; Purcell et al., 2011a; Rapp and Dufor, 2011) and furthermore, damage to this region or in accessing it has been linked to acquired deficits of reading and spelling (Tsapkini et al., 2011; Gaillard et al., 2006; Cohen, 2003) as well as to developmental dyslexia (Shaywitz et al., 2002; Pugh et al., 2001; Démonet et al., 2004).
Our set of findings is highly relevant to issues regarding the specific nature of the ALI representations. While the term ALI is often used, it is not always clear if the same meaning is intended. The ambiguities concern the notions of “abstract” and “amodal”. These are sometimes used synonymously, but that usage is certainly not required. One possibility is that the ALI representations that are shared across upper and lower case are simply more abstract (more general) than case-specific shape representations but are, nonetheless, “linked” visual or spatial representations of lower and upper case letter forms. In that case, one would expect ALI representations to be sensitive to visual similarity in addition to identity. Another possibility, depicted in Figure 1, is that these representations are amodal in the sense that they are shared across input modalities and do not represent similarity along any of the feature modalities. The fact that we identified substrates that were sensitive to letter identity across case AND that these substrates did not show effects of visual (or phonological) similarity most clearly supports the notion of amodal ALIs. In fact, these findings may well represent the strongest evidence to date of amodal ALIs. However, evidence from other modalities such as, for example, evidence that spoken letter name stimuli also activate a region tuned to cross-case visual identity would be highly relevant and would serve to strengthen the claim. Further, it is, of course, possible that we missed a relevant modality-based feature dimension or that the metrics we applied missed some key aspect of the modalities that were evaluated.
4.2. The multiplicity of letter representations used in reading and spelling
This study also identified neural substrates that were responsive to the modality-specific similarity structure of letters. These substrates were in brain areas generally associated with either visual, spoken language or motor processing. In addition to these general associations, these feature-tuned regions were also co-located with clusters within word reading and/or spelling networks.
Selectivity for the visual-spatial features of letters was identified in the right occipital region. This cluster overlapped with posterior portions of the lateral occipital complex (LOC), a region generally thought to be involved in mid-to-high level object processing (Malach et al., 1995).
The STS/MTG region associated with sensitivity for letter-name similarity corresponds to substrates classically associated with phonological processing (Hickok and Poeppel, 2007). In terms of written language processing, the mid-posterior STS has been strongly associated with grapheme-phoneme conversion in normal reading (Jobard et al., 2003; Paulesu et al., 2000) and in developmental dyslexia (Turkeltaub et al., 2003). Damage to this region has been linked specifically to acquired phonological dyslexia and dysgraphia (Rapcsak et al., 2009), syndromes in which the key feature is difficulty with the processes involved in the reading or spelling of unfamiliar words or pseudowords.
The motoric similarity region, in the left hemisphere IPS, has generally been associated with visual-motor integration or early stages of motor planning. While this area was not co-located with any of the clusters within the word reading network, this region was co-located with the superior parietal lobule/intraparietal sulcus cluster from the Purcell et al. (2011b) meta-analysis of spelling (TAL: −29, −63, 37) (see also Dufor & Rapp (2011). The finding of motor-based neural responses in a task with visual stimuli is consistent with other studies of letter viewing that have shown neural responses based on participants’ motor experiences with the visual forms (James and Atwood, 2009; Longcamp et al., 2003).
From a broader perspective, it is worth highlighting that this study demonstrates that feature-selective and sensitive tuning for multiple representational types can be identified from activations generated from an experimental task requiring fairly shallow processing of visually presented letter stimuli. That is, there was nothing about the experimental task that required letter-name, motoric or even ALI representations. In fact, since participants needed to respond only when one of four (non-letter) symbols was presented, the task could be accomplished on the basis of visual shape information alone. The activation of these non-essential representations speaks to one of the often-noted (Price et al., 1999) interpretative challenges for functional neuroimaging research, namely that the activation of neural substrates does not imply that they are necessary for a task. However, it is also worth noting that only feature-sensitive rather than selective substrates were identified for letter name and motoric similarity. Further research would be required to understand if this was simply a power issue or whether, indeed, since these representations are especially peripheral to the task, they are more weakly recruited.
4.3. The MVPA-RSA Searchlight approach
The MVPA-RSA Searchlight methods we have deployed are a significant addition to the toolbox available for investigating the neural representations/computations that instantiate cognition. The MVPA approach permits a more direct examination of representational content than does the general univariate approach (Raizada and Kriegeskorte, 2010) which, while constituting powerful methods for identifying a region’s involvement in a task or cognitive operation, are generally less well-suited for questions of representational content (Kriegeskorte et al., 2006). Neural adaptation, a univariate approach designed for investigating representational content, exploits neural habituation effects identified in electrophysiological research (Grill-Spector and Malach, 2001) and has been used successfully to address various subtle representational questions, including ALIs (Dehaene et al., 2004). However, the complexity of the inferential chain involved in this approach is considerable and this has sparked debate regarding the proper interpretation of findings. MVPA provides a more direct examination of distributed neural responses and, unlike most univariate methods can detect differences in responses patterns across a region even when the mean response is constant.
The most common application of MVPA has been linear classification, which probes a region’s information content by determining if the distributed response contains sufficient information to discriminate between categories of interest (for review see Tong and Pratte, 2012). RSA takes the MVPA-based investigation of representational content to a higher level by examining the structure of the similarity/dissimilarity relationships amongst stimuli in terms of the distributed neural responses that they evoke. This approach of analyzing “second-order isomorphisms” (Kriegeskorte et al., 2008; Kriegeskorte, 2011) has been successfully applied in other branches of cognitive science (Shepard and Chipman, 1970; Edelman, 1998). In the functional neuroimaging context, by allowing for the simultaneous examination of multi-faceted relationships amongst stimuli, this approach allows for complex model testing and comparison.
While there have been studies that have applied the general RSA approach to compare responses within regions of interest, this approach has been far more infrequently used for the model testing and comparison approach employed in this investigation. Furthermore, the searchlight version of MVPA-RSA developed here allows for analyses that are not limited by previously defined regions of interest, while still operating within the constraints of theory-driven model testing.
4.3. Abstract letter representations: Broader implications
The neural evidence for the existence of ALIs is relevant to a long-standing debate regarding human knowledge representation. One long-held view is that human knowledge, even knowledge of abstract concepts, consists of the reactivation or “simulation” of the sensory and motor brain states encoded during previous experiences. According to such a view, falling under the general heading of grounded or embodied theories of cognition, a concept consist only of the reactivation of the sensory (visual, auditory, tactile, olfactory), emotional and motor experiences that we have had with the concept. These views stand in contrast to abstractionist views, which propose that at least some aspects of human knowledge involve abstract (amodal) representations that are distinct from sensory-motor memories. This viewpoint, while not denying that sensory-motor memories may be accessible and useful, posits that there are abstract types of knowledge representation that are neither instantiated in nor can be reduced to previous sensory-motor experiences. In contrast, the abstractionist perspective sees the human brain as a computational device in which abstract (symbolic) representations are manipulated and play a causal role in determining behavior and experience (Barsalou, 2008; Pulvermüller, 2005; Mahon and Caramazza, 2008).
Researchers have increasingly turned to cognitive neuroscience for relevant evidence as the debate has played out in a number of contexts concerning such topics as the role of mirror neurons in action perception and social cognition (Hickok, 2009; Rizzolatti and Craighero, 2004) and the representation of the semantic features of concrete and abstract nouns and verbs (Pulvermüller, 2005; Bedny et al., 2008), among others. These debates have typically reached an impasse in large part because the critical issue concerns the format or content of knowledge representations -specifically, whether the representations of interest are abstract or modality-specific. However, identifying the format of mental representations has proven to be a major challenge and has almost entirely relied on inferring representational content based on the presumed functions of the brain regions in which neural activity is observed. An independent means for identifying representational content is critical and MVPA-RSA provides an extremely valuable approach to these questions. For the grounded vs. abstractionist cognition debate, the finding that we report here regarding specific neural substrates encoding abstract letter identities is highly relevant. This type of evidence is predicted by the abstractionist view of human mental representation and is unexpected and problematic for the grounded cognition perspective.
5. Conclusions
This research provides novel neural evidence for abstract and modality-specific representations of letters and identifies the specific neural substrates in which these different representational types are instantiated. Many questions remain, including whether or not abstract representations are present in other domains. It is clear, however, that the MVPA-RSA Searchlight approach provides a powerful means for investigating fundamental issues of human knowledge representation.
Highlights.
Similarity structure of neural responses reveals multiple letter representations
Selective tuning for abstract letter representations in left ventral cortex
Localization of visual-spatial, phonological, and motoric representations of letters
Letter representations integrated within word reading/spelling networks
Acknowledgments
This research was supported by IGERT Research and Training fellowship for the first author and NIH grant DC006740 to the second author. We are grateful to Manny Vindiola, Bonnie Breining and Michael Wolmetz for valuable advice on data analysis and preliminary drafts as well as to James Sabra for his help with data analysis.
Abbreviations
- ALI
Abstract Letter Identity
- oRSM
Observed Representational Similarity Matrix
- pRSM
Predicted Representational Similarity Matrix
Footnotes
Publisher's Disclaimer: This is a PDF file of an unedited manuscript that has been accepted for publication. As a service to our customers we are providing this early version of the manuscript. The manuscript will undergo copyediting, typesetting, and review of the resulting proof before it is published in its final citable form. Please note that during the production process errors may be discovered which could affect the content, and all legal disclaimers that apply to the journal pertain.
For the regression analysis, each regressor must be involved in the prediction for every cell in the oRSM. For the motor pRSM this required generating similarity predictions for cross-case letter-pairs. This was accomplished by applying the stroke metric developed by Rapp and Caramazza (1997). However, we note that, unlike for the case-similarity values, these cross-case similarity values have not been empirically validated.
The reported results are fairly robust across searchlight volume size. In a reanalysis with a searchlight volume consisting of 33 3 mm3 we found significant results for both ALI and Visual similarity in the ANOVA and Regression analyses to be nearly identical in magnitude and distribution.
References
- Baker CI, Liu J, Wald LL, Kwong KK, Benner T, Kanwisher N. Visual word processing and experiential origins of functional selectivity in human extrastriate cortex. Proc Natl Acad Sci U S A. 2007;104:9087–9092. doi: 10.1073/pnas.0703300104. [DOI] [PMC free article] [PubMed] [Google Scholar]
- Barsalou LW. Grounded cognition. Annu Rev Psychol. 2008;59:617–645. doi: 10.1146/annurev.psych.59.103006.093639. [DOI] [PubMed] [Google Scholar]
- Barton JJS, Fox CJ, Sekunova A, Iaria G. Encoding in the visual word form area: an fMRI adaptation study of words versus handwriting. J Cogn Neurosci. 2010a;22:1649–1661. doi: 10.1162/jocn.2009.21286. [DOI] [PubMed] [Google Scholar]
- Barton JJS, Sekunova A, Sheldon C, Johnston S, Iaria G, Scheel M. Reading words, seeing style: the neuropsychology of word, font and handwriting perception. Neuropsychologia. 2010b;48:3868–3877. doi: 10.1016/j.neuropsychologia.2010.09.012. [DOI] [PubMed] [Google Scholar]
- Bedny M, Caramazza A, Grossman E, Pascual-Leone A, Saxe R. Concepts are more than percepts: the case of action verbs. J Neurosci. 2008;28:11347–11353. doi: 10.1523/JNEUROSCI.3039-08.2008. [DOI] [PMC free article] [PubMed] [Google Scholar]
- Besner D, Coltheart M, Davelaar E. Basic processes in reading: computation of abstract letter identities. Can J Psychol. 1984;38:126–134. doi: 10.1037/h0080785. [DOI] [PubMed] [Google Scholar]
- Binder JR, Medler DA, Westbury CF, Liebenthal E, Buchanan L. Tuning of the human left fusiform gyrus to sublexical orthographic structure. Neuroimage. 2006;33:739–748. doi: 10.1016/j.neuroimage.2006.06.053. [DOI] [PMC free article] [PubMed] [Google Scholar]
- Boles DB, Clifford JE. An upper- and lowercase alphabetic similarity matrix, with derived generation similarity values. Behav Res Meth Ins C. 1989;21:579–586. [Google Scholar]
- Brunsdon R, Coltheart M, Nickels L. Severe developmental letter-processing impairment: A treatment case study. Cogn Neuropsychol. 2006;23:795–821. doi: 10.1080/02643290500310863. [DOI] [PubMed] [Google Scholar]
- Burgund ED, Edwards JK. Identity versus similarity priming for letters in left mid-fusiform cortex. Neuroreport. 2008;19:761–764. doi: 10.1097/WNR.0b013e3282fdf688. [DOI] [PubMed] [Google Scholar]
- Burgund ED, Guo Y, Aurbach EL. Priming for letters and pseudoletters in mid-fusiform cortex: examining letter selectivity and case invariance. Exp Brain Res. 2009;193:591–601. doi: 10.1007/s00221-008-1661-9. [DOI] [PubMed] [Google Scholar]
- Cohen L. Visual word recognition in the left and right hemispheres: Anatomical and functional correlates of peripheral alexias. Cereb Cortex. 2003;13:1313–1333. doi: 10.1093/cercor/bhg079. [DOI] [PubMed] [Google Scholar]
- Cohen L, Dehaene S, Naccache L, Lehéricy S, Dehaene-Lambertz G, Hénaff Ma, Michel F. The visual word form area: spatial and temporal characterization of an initial stage of reading in normal subjects and posterior split-brain patients. Brain. 2000;123:291–307. doi: 10.1093/brain/123.2.291. [DOI] [PubMed] [Google Scholar]
- Coltheart M. Disorders of reading and their implications for models of normal reading. Vis Lang. 1981;15:245–286. [Google Scholar]
- Dehaene S, Le Clec’H G, Poline JB, Le Bihan D, Cohen L. The visual word form area: a prelexical representation of visual words in the fusiform gyrus. Neuroreport. 2002;13:321–325. doi: 10.1097/00001756-200203040-00015. [DOI] [PubMed] [Google Scholar]
- Dehaene S, Cohen L. The unique role of the visual word form area in reading. Trends Cogn Sci. 2011;15:254–262. doi: 10.1016/j.tics.2011.04.003. [DOI] [PubMed] [Google Scholar]
- Dehaene S, Jobert A, Naccache L, Ciuciu P, Poline JB, Le Bihan D, Cohen L. Letter binding and invariant recognition of masked words: Behavioral and neuroimaging evidence. Psychol Sci. 2004;15:307–313. doi: 10.1111/j.0956-7976.2004.00674.x. [DOI] [PubMed] [Google Scholar]
- Dehaene S, Naccache L, Cohen L, Bihan DL, Mangin JF, Poline JB, Rivière D. Cerebral mechanisms of word masking and unconscious repetition priming. Nat Neurosci. 2001;4:752–758. doi: 10.1038/89551. [DOI] [PubMed] [Google Scholar]
- Démonet JF, Taylor MJ, Chaix Y. Developmental dyslexia. The Lancet. 2004;363:1451–1460. doi: 10.1016/S0140-6736(04)16106-0. [DOI] [PubMed] [Google Scholar]
- Devlin JT, Jamison HL, Matthews PM, Gonnerman LM. Morphology and the internal structure of words. Proc Natl Acad Sci U S A. 2004;101:14984–14988. doi: 10.1073/pnas.0403766101. [DOI] [PMC free article] [PubMed] [Google Scholar]
- Edelman S. Representation is representation of similarities. Behav Brain Sci. 1998;21:449–67. doi: 10.1017/s0140525x98001253. discussion 467–98. [DOI] [PubMed] [Google Scholar]
- Gaillard R, Naccache L, Pinel P, Clémenceau S, Volle E, Hasboun D, Dupont S, Baulac M, Dehaene S, Adam C, et al. Direct intracranial, fMRI, and lesion evidence for the causal role of left inferotemporal cortex in reading. Neuron. 2006;50:191–204. doi: 10.1016/j.neuron.2006.03.031. [DOI] [PubMed] [Google Scholar]
- Gauthier I, Tarr MJ, Moylan J, Skudlarski P, Gore JC, Anderson AW. The fusiform “face area” is part of a network that processes faces at the individual level. J Cogn Neurosci. 2000;12:495–504. doi: 10.1162/089892900562165. [DOI] [PubMed] [Google Scholar]
- Grainger J, Rey A, Dufau S. Letter perception: from pixels to pandemonium. Trends Cogn Sci. 2008;12:381–387. doi: 10.1016/j.tics.2008.06.006. [DOI] [PubMed] [Google Scholar]
- Grill-Spector K, Malach R. fMR-adaptation: a tool for studying the functional properties of human cortical neurons. Acta Psychol (Amst) 2001;107:293–321. doi: 10.1016/s0001-6918(01)00019-1. [DOI] [PubMed] [Google Scholar]
- Hickok G. Eight problems for the mirror neuron theory of action understanding in monkeys and humans. J Cogn Neurosci. 2009;21:1229–1243. doi: 10.1162/jocn.2009.21189. [DOI] [PMC free article] [PubMed] [Google Scholar]
- Hickok G, Poeppel D. The cortical organization of speech processing. Nat Rev Neurosci. 2007;8:393–402. doi: 10.1038/nrn2113. [DOI] [PubMed] [Google Scholar]
- Hull AJ. A letter-digit matrix of auditory confusions. Br J Psychol. 1973;64:579–585. doi: 10.1111/j.2044-8295.1973.tb01384.x. [DOI] [PubMed] [Google Scholar]
- Jackson NE, Coltheart M. Routes to Reading Success and Failure: Towards and Integrated Cognitive Psychology of Atypical Reading. 1. New York, NY: Psychology Press; 2001. [Google Scholar]
- James KH, Atwood TP. The role of sensorimotor learning in the perception of letter-like forms: tracking the causes of neural specialization for letters. Cogn Neuropsychol. 2009;26:91–110. doi: 10.1080/02643290802425914. [DOI] [PubMed] [Google Scholar]
- James KH, Gauthier I. Letter processing automatically recruits a sensory-motor brain network. Neuropsychologia. 2006;44:2937–2949. doi: 10.1016/j.neuropsychologia.2006.06.026. [DOI] [PubMed] [Google Scholar]
- Jobard G, Crivello F, Tzourio-Mazoyer N. Evaluation of the dual route theory of reading: a metanalysis of 35 neuroimaging studies. Neuroimage. 2003;20:693–712. doi: 10.1016/S1053-8119(03)00343-4. [DOI] [PubMed] [Google Scholar]
- Kinoshita S, Kaplan L. Priming of abstract letter identities in the letter match task. Q J Exp Psychol (Colchester) 2008;61:1873–1885. doi: 10.1080/17470210701781114. [DOI] [PubMed] [Google Scholar]
- Kriegeskorte N. Pattern-information analysis: from stimulus decoding to computational-model testing. Neuroimage. 2011;56:411–421. doi: 10.1016/j.neuroimage.2011.01.061. [DOI] [PubMed] [Google Scholar]
- Kriegeskorte N, Goebel R, Bandettini P. Information-based functional brain mapping. Proc Natl Acad Sci U S A. 2006;103:3863–3868. doi: 10.1073/pnas.0600244103. [DOI] [PMC free article] [PubMed] [Google Scholar]
- Kriegeskorte N, Mur M, Bandettini P. Representational similarity analysis - connecting the branches of systems neuroscience. Front Syst Neurosci. 2008;2:1–28. doi: 10.3389/neuro.06.004.2008. [DOI] [PMC free article] [PubMed] [Google Scholar]
- Kronbichler M, Klackl J, Richlan F, Schurz M, Staffen W, Ladurner G, Wimmer H. On the functional neuroanatomy of visual word processing: effects of case and letter deviance. J Cogn Neurosci. 2009;21:222–229. doi: 10.1162/jocn.2009.21002. [DOI] [PMC free article] [PubMed] [Google Scholar]
- Longcamp M, Anton JL, Roth M, Velay JL. Visual presentation of single letters activates a premotor area involved in writing. Neuroimage. 2003;19:1492–1500. doi: 10.1016/s1053-8119(03)00088-0. [DOI] [PubMed] [Google Scholar]
- Mahon BZ, Caramazza A. A critical look at the embodied cognition hypothesis and a new proposal for grounding conceptual content. J Physiol Paris. 2008;102:59–70. doi: 10.1016/j.jphysparis.2008.03.004. [DOI] [PubMed] [Google Scholar]
- Malach R, Reppas JB, Benson RR, Kwong KK, Jiang H, Kennedy WA, Ledden PJ, Brady TJ, Rosen BR, Tootell RB. Object-related activity revealed by functional magnetic resonance imaging in human occipital cortex. Proc Natl Acad Sci U S A. 1995;92:8135–8139. doi: 10.1073/pnas.92.18.8135. [DOI] [PMC free article] [PubMed] [Google Scholar]
- Miozzo M, Caramazza A. Varieties of pure alexia: the case of failure to access graphemic representations. Cogn Neuropsychol. 1998;15:203–238. doi: 10.1080/026432998381267. [DOI] [PubMed] [Google Scholar]
- Nestor A, Behrmann M, Plaut DC. The neural basis of visual word form processing: a multivariate investigation. Cereb Cortex. 2012 doi: 10.1093/cercor/bhs158. [DOI] [PubMed] [Google Scholar]
- Nichols TE, Holmes AP. Nonparametric permutation tests for functional neuroimaging: a primer with examples. Hum Brain Mapp. 2002;15:1–25. doi: 10.1002/hbm.1058. [DOI] [PMC free article] [PubMed] [Google Scholar]
- Paulesu E, McCrory E, Fazio F, Menoncello L, Brunswick N, Cappa SF, Cotelli M, Cossu G, Corte F, Lorusso M, et al. A cultural effect on brain function. Nat Neurosci. 2000;3:91–96. doi: 10.1038/71163. [DOI] [PubMed] [Google Scholar]
- Plaut DC, Behrmann M. Complementary neural representations for faces and words: a computational exploration. Cogn Neuropsychol. 2011;28:251–275. doi: 10.1080/02643294.2011.609812. [DOI] [PubMed] [Google Scholar]
- Polk TA, Farah MJ. Functional MRI evidence for an abstract, not perceptual, word-form area. J Exp Psychol Gen. 2002;131:65–72. doi: 10.1037//0096-3445.131.1.65. [DOI] [PubMed] [Google Scholar]
- Price CJ, Devlin JT. The myth of the visual word form area. Neuroimage. 2003;19:473–481. doi: 10.1016/s1053-8119(03)00084-3. [DOI] [PubMed] [Google Scholar]
- Price CJ, Mummery CJ, Moore CJ, Frackowiak RSJ, Friston KJ. Delineating necessary and sufficient neural systems with functional imaging studies of neuropsychological patients. J Cogn Neurosci. 1999;11:371–382. doi: 10.1162/089892999563481. [DOI] [PubMed] [Google Scholar]
- Pugh KR, Mencl WE, Jenner AR, Katz L, Frost SJ, Lee JR, Shaywitz SE, Shaywitz Ba. Neurobiological studies of reading and reading disability. J Commun Disord. 2001;34:479–492. doi: 10.1016/s0021-9924(01)00060-0. [DOI] [PubMed] [Google Scholar]
- Pulvermüller F. Brain mechanisms linking language and action. Nat Rev Neurosci. 2005;6:576–582. doi: 10.1038/nrn1706. [DOI] [PubMed] [Google Scholar]
- Purcell JJ, Napoliello EM, Eden GF. A combined fMRI study of typed spelling and reading. Neuroimage. 2011a;55:750–762. doi: 10.1016/j.neuroimage.2010.11.042. [DOI] [PMC free article] [PubMed] [Google Scholar]
- Purcell JJ, Turkeltaub PE, Eden GF, Rapp B. Examining the central and peripheral processes of written word production through meta-analysis. Front Psychology. 2011b;2:1–16. doi: 10.3389/fpsyg.2011.00239. [DOI] [PMC free article] [PubMed] [Google Scholar]
- Qiao E, Vinckier F, Szwed M, Naccache L, Valabrègue R, Dehaene S, Cohen L. Unconsciously deciphering handwriting: subliminal invariance for handwritten words in the visual word form area. Neuroimage. 2010;49:1786–1799. doi: 10.1016/j.neuroimage.2009.09.034. [DOI] [PubMed] [Google Scholar]
- Rapcsak SZ, Beeson PM, Henry ML, Leyden A, Kim E, Rising K, Andersen S, Cho H. Phonological dyslexia and dysgraphia: cognitive mechanisms and neural substrates. Cortex. 2009;45:575–591. doi: 10.1016/j.cortex.2008.04.006. [DOI] [PMC free article] [PubMed] [Google Scholar]
- Rapp B, Dufor O. The neurotopography of written word production: an fMRI investigation of the distribution of sensitivity to length and frequency. J Cogn Neurosci. 2011;23:4067–4081. doi: 10.1162/jocn_a_00109. [DOI] [PubMed] [Google Scholar]
- Rapp B, Lipka K. The literate brain: the relationship between spelling and reading. J Cogn Neurosci. 2011;23:1180–1197. doi: 10.1162/jocn.2010.21507. [DOI] [PMC free article] [PubMed] [Google Scholar]
- Rizzolatti G, Craighero L. The mirror-neuron system. Annu Rev Neurosci. 2004;27:169–192. doi: 10.1146/annurev.neuro.27.070203.144230. [DOI] [PubMed] [Google Scholar]
- Shaywitz BA, Shaywitz SE, Pugh KR, Mencl WE, Fulbright RK, Skudlarski P, Constable RT, Marchione KE, Fletcher JM, Lyon GR, et al. Disruption of posterior brain systems for reading in children with developmental dyslexia. Biol Psychiatry. 2002;52:101–110. doi: 10.1016/s0006-3223(02)01365-3. [DOI] [PubMed] [Google Scholar]
- Shepard RN, Chipman S. Second-order isomorphism of internal representations: shapes of states. Cogn Psychol. 1970;1:1–17. [Google Scholar]
- Szwed M, Dehaene S, Kleinschmidt A, Eger E, Valabrègue R, Amadon A, Cohen L. Specialization for written words over objects in the visual cortex. Neuroimage. 2011:1–15. doi: 10.1016/j.neuroimage.2011.01.073. [DOI] [PubMed] [Google Scholar]
- Tenpenny PL. Abstractionist versus episodic theories of repetition priming and word identification. Psychon Bull Rev. 1995;2:339–363. doi: 10.3758/BF03210972. [DOI] [PubMed] [Google Scholar]
- Tong F, Pratte MS. Decoding patterns of human brain activity. Annu Rev Psychol. 2012;63:483–509. doi: 10.1146/annurev-psych-120710-100412. [DOI] [PMC free article] [PubMed] [Google Scholar]
- Tsapkini K, Rapp B. The orthography-specific functions of the left fusiform gyrus: evidence of modality and category specificity. Cortex. 2010;46:185–205. doi: 10.1016/j.cortex.2009.02.025. [DOI] [PMC free article] [PubMed] [Google Scholar]
- Tsapkini K, Vindiola M, Rapp B. Patterns of brain reorganization subsequent to left fusiform damage: fMRI evidence from visual processing of words and pseudowords, faces and objects. Neuroimage. 2011;55:1357–1372. doi: 10.1016/j.neuroimage.2010.12.024. [DOI] [PMC free article] [PubMed] [Google Scholar]
- Tulving E. Essentials of episodic memory. O. U. Press; New York: 1983. [Google Scholar]
- Tulving E. How many memory systems are there? American Psychologist. 1985;40:385–398. [Google Scholar]
- Turkeltaub PE, Gareau L, Flowers DL, Zeffiro TA, Eden GF. Development of neural mechanisms for reading. Nat Neurosci. 2003;6:767–773. doi: 10.1038/nn1065. [DOI] [PubMed] [Google Scholar]
- Vinckier F, Dehaene S, Jobert A, Dubus JP, Sigman M, Cohen L. Hierarchical coding of letter strings in the ventral stream: dissecting the inner organization of the visual word-form system. Neuron. 2007;55:143–156. doi: 10.1016/j.neuron.2007.05.031. [DOI] [PubMed] [Google Scholar]
- Wong ACN, Jobard G, James KH, James TW, Gauthier I. Expertise with characters in alphabetic and nonalphabetic writing systems engage overlapping occipito-temporal areas. Cogn Neuropsychol. 2009;26:111–127. doi: 10.1080/02643290802340972. [DOI] [PubMed] [Google Scholar]