Abstract
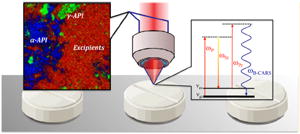
We compare a coherent Raman imaging modality, broadband coherent anti-Stokes Raman scattering (BCARS) microscopy, with spontaneous Raman microscopy for quantitative and qualitative assessment of multicomponent pharmaceuticals. Indomethacin was used as a model active pharmaceutical ingredient (API) and was analyzed in a tabulated solid dosage form, embedded within commonly used excipients. In comparison with wide-field spontaneous Raman chemical imaging, BCARS acquired images 10× faster, at higher spatiochemical resolution and with spectra of much higher SNR, eliminating the need for multivariate methods to identify chemical components. The significant increase in spatiochemical resolution allowed identification of an unanticipated API phase that was missed by the spontaneous wide-field method and bulk Raman spectroscopy. We confirmed the presence of the unanticipated API phase using confocal spontaneous Raman, which provided spatiochemical resolution similar to BCARS but at 100× slower acquisition times.
The rapid characterization of active pharmaceutical ingredients (APIs) embedded in mixtures of nonactive ingredients is very important to the pharmaceutical industry in all phases of the product life cycle, from initial characterization of novel APIs to continuous process monitoring, long-term stability testing, intellectual property protection, and counterfeit detection.1,2 As a result, substantial time and money are spent in the characterization of APIs by way of developing process analytical technologies that can measure and assess critical process parameters in real time.3 APIs are often tableted for use in a specific crystalline or amorphous form and embedded within a powder mixture of excipient compounds. Performance of the tablet depends on the polymorphic forms of the API present, as well as their respective spatial homogeneity and size distribution, since different polymorphs can exhibit very different dissolution rates and bioavailability.4-6 Multiple polymorphic forms of the same active drug ingredients can be introduced simultaneously into tablets, intentionally or otherwise.7 Also, when a metastable polymorphic form is used as the active ingredient, it can convert back to a thermodynamically more stable state over time and potentially change the performance of the product during storage or manufacturing.8 It is essential that these be characterized accurately because product performance is sensitive to API physical distribution and the crystalline phase.
Many tools are commonly used to characterize API phase and distribution, including chromatography, solid state NMR, X-ray diffraction crystallography, and differential scanning calorimetry.9 Spontaneous Raman scattering and IR spectroscopy have recently become increasingly prevalent in this industry due to their ability to obtain chemically specific information and to nondestructively characterize compounds. 10-12 Attenuated total reflectance IR spectroscopy can be used to chemically map tablet surfaces over small areas, and IR microscopy can be used to obtain chemical maps of larger areas at low spatial resolution, but these techniques require sample preparation and suffer from Mie scattering and from absorption by water in the atmosphere.13-15 Spontaneous Raman spectroscopy and microspectroscopy also probe bulk properties rapidly or provide high-resolution chemical mapping but at a much slower rate.16-18 The drawback inherent to spontaneous Raman techniques is in their inability to simultaneously measure a sample rapidly and with high spatiochemical resolution. On the other hand, nonlinear optical methods have proven their ability to image pharmaceuticals with high-spatial resolution very rapidly.19
Nonlinear microscopy methods, utilizing pulsed laser sources, overcome many of the limitations of the other analytical techniques due to their ability to generate large signal from chemical species exclusively at the focal plane of the microscope objective. Several very promising techniques such as second harmonic generation (SHG) combined with two photon excitation (TPE), wavelength-scanned coherent anti-Stokes Raman (CARS), and stimulated Raman scattering (SRS), have been used to produce API-contrasted images of final dosage forms with very short acquisition times at high-spatial resolution. Toth et al. used the optical properties of chiral crystals to spatially map only the crystalline APIs embedded in powdered excipients very rapidly with combined SHG and TPE images.20 Windbergs et al. used narrow band CARS imaging to map solid dosage form surfaces and to measure dissolution dynamics.21,22 Additionally, Slipchenko et al. used SRS to image pharmaceutical tablets with high spatial resolution of three separately imaged spectral bands with short acquisition times.23 All techniques offer a good solution to high-speed tablet imaging with high spatial resolution; however, at a minimum, chemically specific characterization of multicomponent samples requires the ability to detect at least as many spectroscopic features as there are distinct chemophysical components to be imaged. When unknown species may be present, such as when verifying purity or validating novel formulations, broad spectral sampling is advisable. Of the above, only broadband, or possibly, spectrally scanned methods meet this criterion. In the present case, there are four possible physical phases of indomethacin (IMC) and a carrier, which is itself a mixture. The broadband coherent anti-Stokes Raman scattering (BCARS) microscope used in this study covers approximately 3000 cm−1 at 8 cm−1 resolution, providing ample spectral sampling. It further offers advantages of high-speed imaging.
Coherent anti-Stokes Raman scattering was originally discovered by Maker and Terhune in 1965. In 1982, Duncan et al. first demonstrated CARS microscopy, but Zumbusch et al. demonstrated colinear excitation, making implementation much more straighforward.24-26 Since 1999, the CARS field and its use as an analytical tool and imaging mechanism have grown substantially in the materials and biological realms.27-30 As mentioned above, broadband CARS contributes significantly to the suite of CARS capabilities by providing significantly improved chemical selectivity and sensitivity. We have demonstrated the ability to quantitatively image chemically complex samples, obtaining a broadband (e.g., > 3000 cm−1) spectral signal at very low acquisition times per image and at high spatial resolution (<1 μm3/voxel).31-35
The BCARS signal is generated from a nonlinear third-order optical effect. In our instrument, pulsed near-IR laser light from a single source is split into two separate beams, one of which is introduced into a photonic crystal fiber to generate a Stokes pulse, containing photons over a range of frequencies covering at least 3000 cm−1. The beam serves as a pump and probe source and is spectrally narrowed to provide good spectral resolution.36 The two incident beams are recombined and focused on the sample via a high-NA objective to generate the blue-shifted coherent anti-Stokes light from the combination of pump, Stokes, and probe pulses arriving at the sample simultaneously (ωanti-Stokes = ωprobe + ωPPump − ωStokes). In the present work, we explore the potential effectiveness of BCARS imaging for the rapid screening and characterization of chemically complex pharmaceuticals using indomethacin, in its traditional tablet form.
Indomethacin (IMC) is one of a broad class of nonsteroidal anti-inflammatory drugs and is commonly prescribed throughout the world in the treatment of gout, rheumatoid arthritis, and many other arthritic conditions.37 As an API, indomethacin is typically presented in the solid dosage form as small crystalline particles. It has three known crystalline polymorphs, the most stable of which is γ-IMC. The two metastable forms are α-IMC and δ-IMC, which differ from the γ form by different orientation between two aromatic indole and phenyl rings upon crystal formation.38 The three polymorphic forms of IMC can be distinguished by their distinct Raman-active modes from its benzoyl carbonyl and indole alkene stretching vibrations (1550–1750 cm−1).39 Furthermore, indomethacin can be distinguished from typical excipient compounds used in solid dosage forms because the latter do not possess any Raman active vibrational modes within this spectral region.
In this study, indomethacin tablets with known ratios of the γ-form to the α-form, ranging from 0% to 100%, were imaged using BCARS. We determined the amount of γ or α form by comparing obtained spectra with known spectra of the pure components. In order to put our results into context with commonly used approaches, we compared the performance of BCARS to wide-field and confocal spontaneous Raman imaging.
EXPERIMENTAL SECTION
Materials and Preparation of Tablets
Solid dosage forms of compositions outlined in Table 1 were prepared via direct compression. All materials with the exception of the α-indomethacin were obtained from Sigma-Aldrich. The γ-indomethacin was used in the following procedure in two forms: one as received from the manufacturer and one which was cryoground prior to formulation (used in only a separate 100% gamma sample). The metastable α-indomethacin polymorph was prepared by dissolving the gamma form in ethanol. To the ethanol solution, an equal portion of water was added, and the resulting precipitate was isolated by vacuum filter and subsequently dried at 40 °C for several hours. Characterization by differential scanning calorimetry, X-ray powder diffraction, and FT-Raman showed that the resulting sample was consistent with the metastable α-indomethacin polymorph. The three forms (γ as received, cryoground γ, and α) of indomethacin were gently mixed via mortar and pestle with lactose monohydrate and microcrystalline cellulose (MCC) relative to the ratios stated in Table 1, and the polymorphic mixtures (or those with both α-indomethacin and γ-indomethacin) included crystalline material from both polymorphs, which ranged from 10 to 100 μm in size. Crosscarmellose sodium was then physically mixed in the blend followed by a similar mixing process with the lubricant, magnesium stearate. Roughly 100 mg of the resulting blend was then dispensed on a filter paper and gently poured into a tablet die of diameter 8.73 mm and held in place with the bottom punch of a round flat face tool. The top tool was then placed on the powder bed and compressed to an axial pressure of 100 MPa, using an instrumented single station MTS Alliance RT/50 press (MTS Systems Corporation, Eden Prairie, MN) equipped with a 50 kN load cell with a resolution of +/−1 N.
Table 1.
Tablet Formulations Components with Indomethacin As Ratios of γ/α Polymorphs and All Excipients
| tablet components | 0:100 (% w/w) | 25:75 (% w/w) | 50:50 (% w/w) | 75:25 (% w/w) | 100:0 (% w/w) |
|---|---|---|---|---|---|
| indomethacin (γ/α) | 0/30 | 7.5/22.5 | 15/15 | 22.5/7.5 | 30/0 |
| lactose monohydrate | 33 ± 0.01 | 33 ± 0.01 | 33 ± 0.01 | 33 ± 0.01 | 33 ± 0.01 |
| Avicel (MCC) | 33 ± 0.01 | 33 ± 0.01 | 33 ± 0.01 | 33 ± 0.01 | 33 ± 0.01 |
| croscarmellose sodium | 3 ± 0.01 | 3 ± 0.01 | 3 ± 0.01 | 3 ± 0.01 | 3 ± 0.01 |
| magnesium stearate | 1 ± 0.01 | 1 ± 0.01 | 1 ± 0.01 | 1 ± 0.01 | 1 ± 0.01 |
BCARS Instrumental Design
The BCARS microscope is detailed in the schematic diagram in Figure 1. In brief, the output (70 fs pulses centered at 830 nm and a 80 MHz repetition rate) from a Ti:Sapphire oscillator (MaiTai-DeepSee, Spectra Physics) was spilt into two separate beams for the pump/probe and Stokes pulses. The spectral bandwidth of the pump/probe beam was reduced by adjusting the slit width in a 4-f dispersionless filter to 10 cm−1 full width half-maximum with the center wavelength at 830 nm. The other beam was sent through a photonic crystal fiber (Crystal Fiber, Femtowhite 800) to produce a spectrally broad (800–1200 nm) pulse, which was then collimated using a parabolic mirror. The two beams were collinearly combined immediately before entering into the side port of an inverted microscope (Olympus IX71). The combined light was focused onto the tablet surface using a 40×, 0.95 NA objective lens (Olympus) for a lateral resolution spot size of 0.75 μm. The average power at the focal point of the beam was 18 mW. The backscattered light was collected by the same objective lens out of the side port of the microscope and passed through an 830 nm notch filter and an 810 nm short-pass filter. After filtering, the BCARS signal was introduced into the spectrograph (SP-2300, Acton with 600 lines/mm grating) and analyzed with a charged-coupled device (CCD, DU920-BR- DD, Andor). Prior to sample imaging, the collection efficiency of the backscattered light was optimized at the entrance slit to the spectrograph by adjustment of beam overlap, temporal spacing, and collection beam mirrors. The exposure time on the CCD was 100 or 1000 ms to obtain enough backscattered signal intensity of a spectral region between 800–3400 cm−1 across 1024 pixels of the CCD chip. Images were produced by laterally scanning a piezo-electrically controlled stage in 1 μm increments (unless otherwise noted). Image acquisition and analysis were performed using a custom developed LabView (LabView 2011, National Instruments) program.
Figure 1.
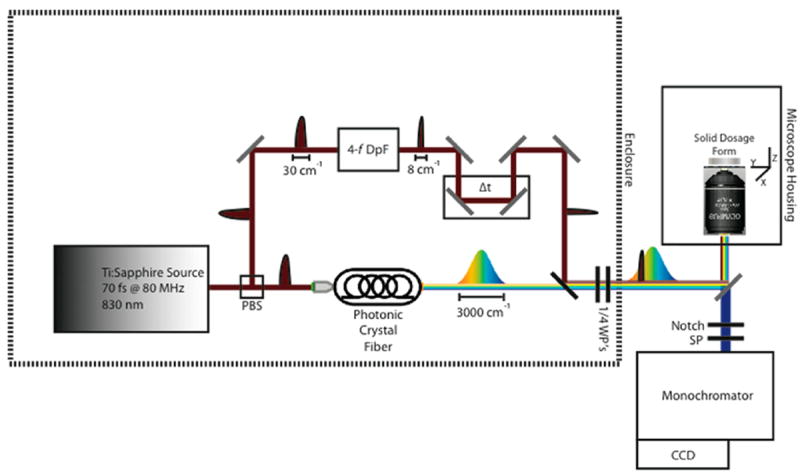
Schematic diagram of broadband coherent anti-Stokes Raman scattering (BCARS) epi-microscope. PBS, polarizing beam splitter; DpF, dispersionless filter; WP, waveplate; SP, short-pass filter.
BCARS spectral data processing included cosmic ray spike removal, spectral phase retrieval using the time-domain Kramers–Kronig35 approach to extract the Raman signal, and baseline detrending using a cubic-spline algorithm.40 Image contrast and subsequent pseudocoloring was based on similarity of spectra associated with a particular pixel to known spectra from γ-IMC, α-IMC, or the excipients. We also observed a fourth component that had spectra different from those of the starting materials. This will be discussed below.
Spontaneous Raman Imaging
Confocal and wide-field, spontaneous Raman imaging modalities were used for comparison and verification of BCARS imaging results. The inVia confocal Raman microscope (Renishaw, U.K.) utilized a 785 nm CW laser at 80 mW, which was focused by a 100×, 0.75 NA objective onto the sample and was scanned in 2 μm steps. The backscattered Raman signal was dispersed by a monochromator (1200 lines/mm), and the Raman signal in the range (from 1550 to 1800) cm−1 was detected by a CCD, requiring 10 s integration time to obtain an adequate signal-to-noise ratio. Spectral resolution was 4 cm−1. Spectral image data was exported for analysis in IDL/ENVI (IDL 8.1/ENVI 4.8, Exelis Visual Information Solutions) and MATLAB (MATLAB R2011b, The MathWorks).
For the wide-field Raman, the FALCON II Wide-Field Raman Chemical Imaging system (ChemImage, Pittsburgh, PA) was used to compare data sampling time and quality. Each tablet was placed directly on aluminum-coated glass slides, and Raman chemical images were collected using the FALCON II system with 532 nm excitation. Excitation light was focused on the tablets using a 100×, 0.95 NA objective lens (Olympus). The mean signal from each 32 × 32 pixel area of the data set was used to obtain spectra for each image with an effective image dimension of 6.25 × 6.25 μm/pixel. A liquid crystal tunable filter coupled to a CCD detector was used to collect scattered light. The scan range of the tunable filter was limited to the range (1530 to 1730) cm−1 with an average power of 30 mW, to limit sample damage. The approximate sample imaging time with these settings was 2 1/2 h for a 100 × 100 μm surface area.
MATLAB and IDL/ENVI were also used for image processing and chemometric analysis of the FALCON II Raman images. The images were processed by baseline detrending and normalization.
RESULTS AND DISCUSSION
Characterization of Initial Tablet Components
Spontaneous Raman analysis was performed on all ingredients (powders and crystals): indomethacin (α and γ), croscarmellose croscarmellose sodium, Avicel, lactose monohydrate, and magnesium stearate, prior to tablet formulation. Figure 2 (in which the spectra have been offset for clarity) shows the results of this analysis performed on a Raman spectrometer (Bruker IFS 66v/s spectrometer coupled to a Bruker FRA 106/s Raman attachment), where each sample was rotated during the experiment with its signal averaged over a 10 min period. The primary benzoyl and indole Raman active modes of the indomethacin polymorphs overlap a quiescent spectral region of the excipients (see the inset of Figure 2),41,42 allowing for a straightforward discrimination between the API polymorphs and excipients. Optical micrographs of α- and γ-IMC crystals prior to tabulation are displayed in Figure S-1 (Supporting Information). The γ-IMC starting material had larger crystals (≈10–100 μm) than the metastable α-IMC (≈10–50 μm) polymorphic form, prior to formulation. Both polymorphs are known to remain stable at room temperature in the time frame of these experiments.43
Figure 2.
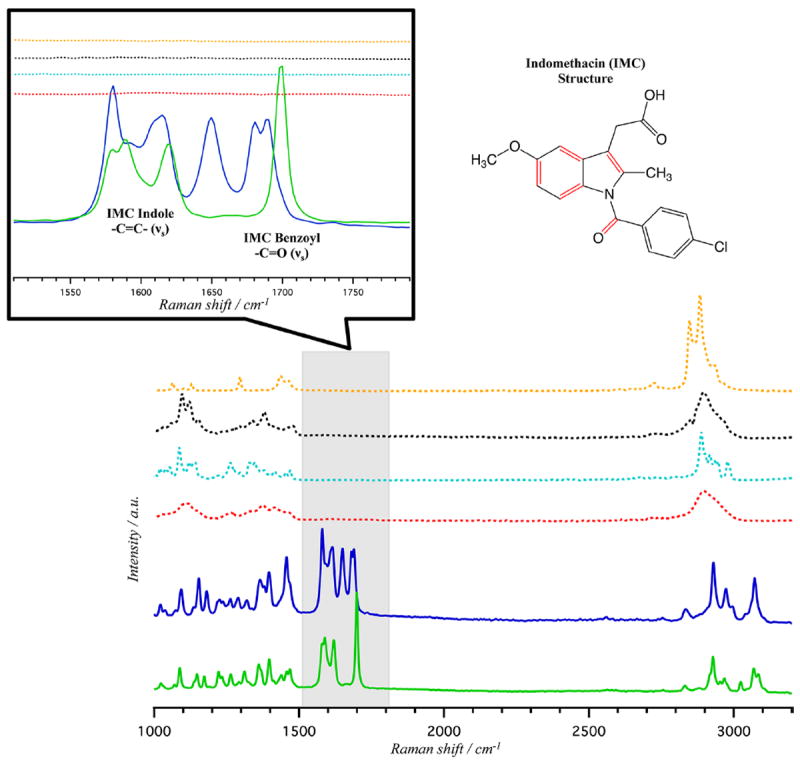
Spontaneous Raman spectra of γ-indomethacin (solid green), α-indomethacin (solid blue), croscarmellose sodium (dashed red), Avicel (dashed black), lactose monohydrate (dashed light blue), and magnesium stearate (dashed yellow) pure samples prior to tablet formation. Inset: Expanded region from 1500 to 1800 cm−1 displaying the α- and γ-indomethacin respective benzoyl carbonyl and indole alkene stretching modes (νS). The indomethacin structure shown to the right with red highlighted bonds indicative of the Raman active modes displayed in the expanded region.
In order to verify purity of the alpha and gamma polymorphs, both were analyzed with X-ray diffractometry (Phillips PW3040-PRO X-ray Diffractometer), differential scanning calorimetry (TA Instruments Q2000 DSC, New Castle, DE), and thermogravimetric analysis (TA Instruments Q5000 TGA, New Castle, DE). Figure S-2 of the Supporting Information shows the results of the XRD analysis. The X-ray diffraction patterns of each polymorph are consistent with literature reports of the peak positions for crystalline γ- and α-indomethacin.44,45 The DSC results in Figure S-3 of the Supporting Information are also consistent with previous reports of γ- and α-IMC. The alpha polymorph is 99.5% pure (endotherm at 153.3 °C) with a small endotherm that is coincident with the original gamma form (160.2 and 161.7 °C, respectively) and is consistent with the literature.46,47 This small difference in the α form is likely due to either γ-polymorph which reformed during the EtOH crystallization or phase transformation that occurred during the acquisition of the DSC data. The results of a separate thermogravimetric analysis of the α-IMC, also shown in Figure S-3 of the Supporting Information shows that ~0.5% of residual volatiles were occluded within the crystal after recrystallization.48 On the basis of our analysis, compounds prior to tabulation were pure within the detection limits of the Raman and BCARS instruments used.
Comparison of Acquisition Times and Spatial/Spectral Separation
After tableting the solid dosage forms, tablets with IMC polymorph ratios of 0:1, 25:75, 50:50, 75:25, and 1:0 γ:α-IMC were spectroscopically characterized using bulk spontaneous Raman scattering and imaged using the commercial spontaneous Raman instrument. The tablets were also imaged using an epi-BCARS microscope. Acquisition times and spectral images were compared to highlight key advantages of BCARS over vibrational imaging technologies that are currently widely available.
We begin the discussion with two Raman-based methods commonly used for analyzing pharmaceutical solid dosage forms, bulk Raman spectroscopy and wide-field Raman imaging. Bulk Raman spectroscopy is used to obtain a single Raman spectrum averaged over a portion of a tablet surface by rapidly rotating the tablet while it is partially illuminated by a Raman excitation source. Figure S-4 of the Supporting Information shows results of this bulk measurement on the five tablets of this study. Each measurement took just over 10 min to complete and gives a spatially averaged Raman spectrum of a small portion of the tablet surface, at a scan area of approximately 1.5 mm2/spectrum. As can be seen in the spectra, each single component API tablet (100% γ- or α-IMC) shows its respective Raman spectra identical to the spectra of the crystals prior to tableting. The three multicomponent API tablets display Raman spectra that are consistent with a linear combination of Raman spectra of γ and α polymorphs. The difference between the Raman spectra of these two polymorphs is most notable in the strong carbonyl stretch of γ-IMC at 1702 cm−1, converting into the lower-energy variant at 1685 cm−1 of the carbonyl stretch of the α-IMC polymorph.
Wide-field Raman chemical imaging and subsequent analysis of the spectra is commonly used to analyze pharmaceutical products.49 Multivariate analysis is often used to characterize Raman images, but we preclude its use here in order to make the comparison as direct and transparent as possible between the spontaneous and coherent Raman methods. Figure 3 displays images and the spectra generated from both pure IMC polymorphs and the multicomponent form with a 50:50 ratio. The image acquisition time for each image was ≈2.5 h, and each image represents a 100 × 100 μm region of the tablets. The two other multicomponent solid dosage forms were also imaged, but the signal-to-noise ratio (SNR) was too low at comparable image acquisition times to discriminate between individual species in the tablet. All three images display the API as being present at each image pixel but with some variation in local concentrations. The obtained spatial variation in species concentrations is not consistent with the expected physical distribution of API; the largest dimension of the α crystals is typically on the order of 10 μm, and while there are larger γ crystals, most of these are also of similar size to the α form. Thus, one would expect discrete regions of high API concentration where a crystal of one form or another is found and other regions that have no API, in contrast to the observed results. The discrepancy between expectation and results obtained are due to several factors. One factor is that only a small spectral window was used (1500 to 1800 cm−1) in order to reduce laser exposure and sample damage. This limited spectral window does not contain any excipient peaks, so it was not possible to directly detect the excipient. Additionally, the SNR for individual spatially separated spectra was low enough that the spectra could not be used directly to estimate the presence of API, even after 2.5 h of imaging. It was necessary to spatially average the signal over 32 × 32 pixel regions, approximately 6 μm on a side in order to obtain spectra of sufficient SNR to discriminate between the API phase. Although the expected image resolution from spatial averaging was comparable to the expected crystallite size, we were unable to obtain pure spectra of either component in any of the images.
Figure 3.
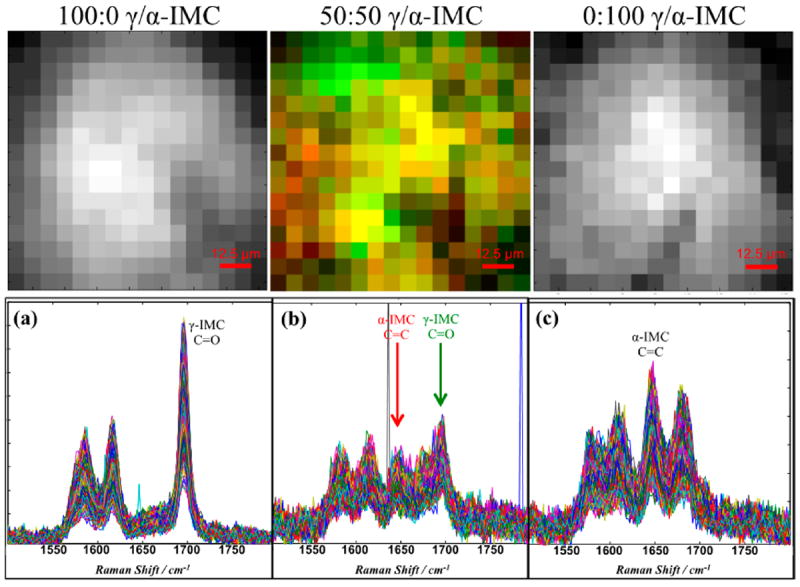
Wide-field Raman spectral image data for (a) 100:0, (b) 50:50, and (c) 0:100 of γ-IMC:α-IMC tablets obtained from the mean of each 32 × 32 pixel region of original 512 × 512 pixel data set (corresponds to 100 × 100 μm sample region). Top: corresponding images (16 × 16 pixels = 100 × 100 μm) generated from specific spectral components of Raman spectra below (spectral components used to generate the contrast listed in each plot below). At 2.5 h/image, the effective superpixel spectral acquisition time is 35 s.
Broadband coherent anti-Stokes Raman scattering (BCARS) microscopy was used to image areas of five tablet surfaces with compositions ranging of 0:100, 25:75, 50:50, 75:25, and 100:0 γ:α-IMC. Figure 4 shows 100 × 100 μm images of four of these samples, and spectra from single pixels, obtained at distinct regions in these images, are shown in Figure 4 (panels a–c). These spectra are of sufficient quality and spectral breadth to directly identify the contribution from the API and carrier at each pixel. Image contrast is derived directly from the BCARS-extracted Raman spectral features of the APIs (
 and
and
 stretching modes) and excipients (C–H stretching mode, red-shifted from the API). The excellent spatial and chemical resolution of the BCARS images is immediately apparent. The good spectral quality at each pixel allows us to construct contrast metrics using any of a number of approaches, including the overall intensity of selected spectral regions, single bands within the spectrum, or band intensity ratios or spectral shifts.
Figure 4.
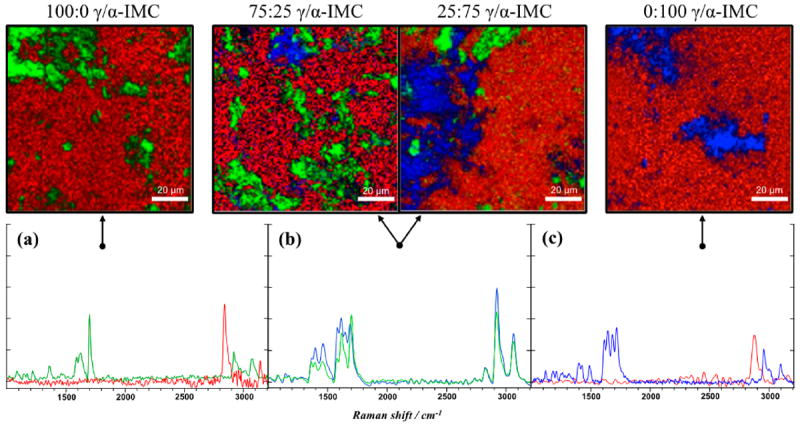
Top: BCARS pseudocolored images 100 × 100 μm generated from spectral components (R: 2880 cm−1, G: Δ1700–1668 cm−1, B: 1682 cm−1) of Raman spectra for 100:0, 75:25, 25:75, and 0:100 of γ-IMC:α-IMC tablets (from left to right, respectively). Bottom: Raman spectra chosen from pixels found within top images (see arrows) for (a) 100% γ-indomethacin, (b) multicomponent, and (c) 100% α-indomethacin tablets, where spectral line color correlates to pixel color from above the image. Pixel dwell times were 500 ms.
In accordance with the known API content, the images in Figure 4 reflect approximately 30% of the tablet surface being identified with the API in its various polymorphs. The images also display the expected ratio γ and α polymorphs. The remaining tablet image area is made up of excipient (red) or no signal (black). Signal is not generated in some regions due to tablet surface roughness; the surface of the tablet simply falls below the small focal volume in which anti-Stokes photons can be generated, so the dark regions of the surface highlight the intrinsic optical sectioning of BCARS (≈0.5 μm lateral and ≈1.0 μm axial resolution here). Another feature of these images is that the overall morphology and size of the API particles are consistent with the optical micrographs of the crystals prior to tableting. It should be noted, however, that some of the small API particles in these 2D image slices could be larger than they appear, since they are partially buried by the excipient.
We obtained a series of tablet surface images at increasing spectral acquisition rates in an effort to determine how rapidly we can image IMC tablets and still get reliable results. The images of Figure 5 show the resulting images, and from these we estimate that the shortest pixel dwell time that could be used for these samples while maintaining the chemical sensitivity required to detect API at the single pixel level is approximately 100 ms. The right column of Figure 5 shows reference images from a tablet containing small γ–IMC particles. The spectra for the reference images were obtained at 1 s/pixel from three distinct regions of the sample. Each of these image areas was subsequently scanned more quickly, and these images, shown in the left column of Figure 5, were compared with the references. The plots in the center of this figure show the intensities of the 1700 cm−1 signal across a line in the images to the right and left of each plot. The intensities in the center plots are scaled arbitrarily to best show agreement (or lack thereof) between the reference and test images. The reference image and the image taken at 200 ms are very similar. Accordingly, the features intersected by the horizontal line in each image are well above the noise. The SNR begins to decrease compared to the reference when increasing the speed to 150 and 100 ms per pixel rates. Nonetheless, even with this decrease in SNR, the areas in the reference images that contain API are still easily discriminated with appropriate thresholding, even at the 100 ms time. At pixel dwell times below 100 ms, we began to lose the ability to easily discern API from excipient. We note that the CARS signal is forward scattered, and we collect only a small fraction of the diffusively backscattered signal in the epi-detection configuration we use here. Under more optimal conditions, our BCARS microscope can obtain very high quality Raman spectra from materials at 10 ms pixel dwell times when collecting the forward scattered BCARS signal.40
Figure 5.
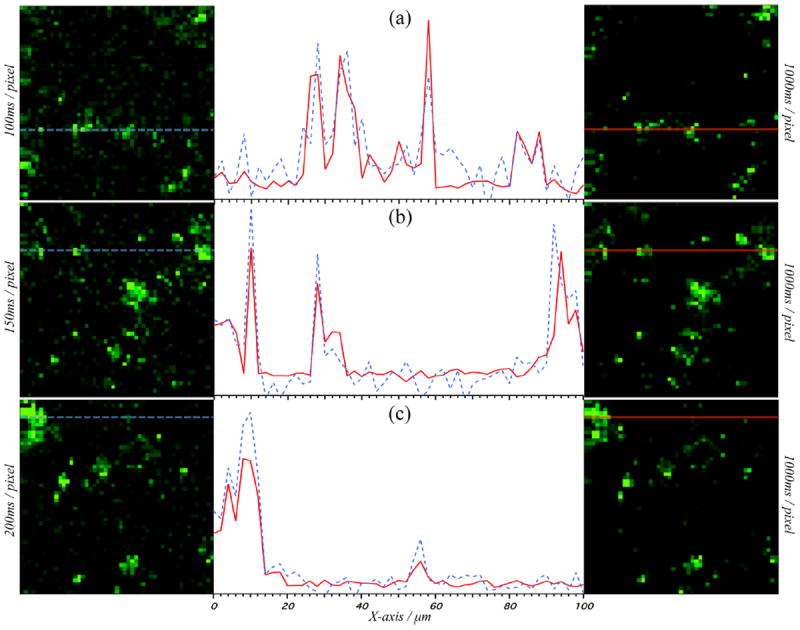
Left: BCARS pseudocolored “fast” images with (a) 100 ms, (b) 150 ms, and (c) 200 ms per pixel dwell times. Right: pseudocolored BCARS “reference” images with 1 s pixel dwell times. Left and right columns show identical spatial locations but with different imaging speed. Center: Intensity vs X axis position for “fast” (dashed blue) and “reference” (solid red) of corresponding left/right images at the matching Y axis line. Normalization of data from “fast” and “reference” images performed separately with respect to the nonresonant portion of the signal from within the image, allowing for easy observation of peak overlap between short and long acquisition times. All BCARS images are of γ-indomethacin cryoground tablet surface (100 × 100 μm) at 1700 cm−1.
Observation of Minor Components
Trace amounts of undesirable materials can have negative consequences for pharmaceuticals. This is particularly true for high-potency APIs, where a small amount of unintended amorphous component could lead to a higher-than-intended initial dosing rate. It is currently difficult to detect small amounts of amorphous materials, as they do not show up strongly in either X-ray or DSC. Due to the unique combination of high spatial resolution, high spectral discrimination, and high speed, BCARS offers a particularly powerful approach for identifying minor components. In the course of this study, we observed an unexpected spectral signature, found only in the tablets containing γ-IMC. Figure 6a shows three distinct spectra observed in a 100% γ-IMC tablet, and the surface image they were obtained from. Two of these are clearly associated with the γ-IMC and the excipient. The third is similar to γ-IMC but shows a significant difference in the peak intensity ratio of the 1700 cm−1 carbonyl and 1650 cm−1 alkene stretching modes, as well as a broadening of this band. The intensity ratio for these peaks in γ-IMC is 2:1, whereas the unexpected component shows a nearly 1:1 ratio. The teal green regions in the image of Figure 6a indicate that this unexpected component is most often associated with the periphery of the γ-IMC crystals. Figure S-5 of the Supporting Information supports this observation, showing the ratio of the two peak intensities across the image and through a γ-IMC particle. We reason that the spectral signature could arise only from the presence of an unexpected chemical species or from an optical artifact.
Figure 6.
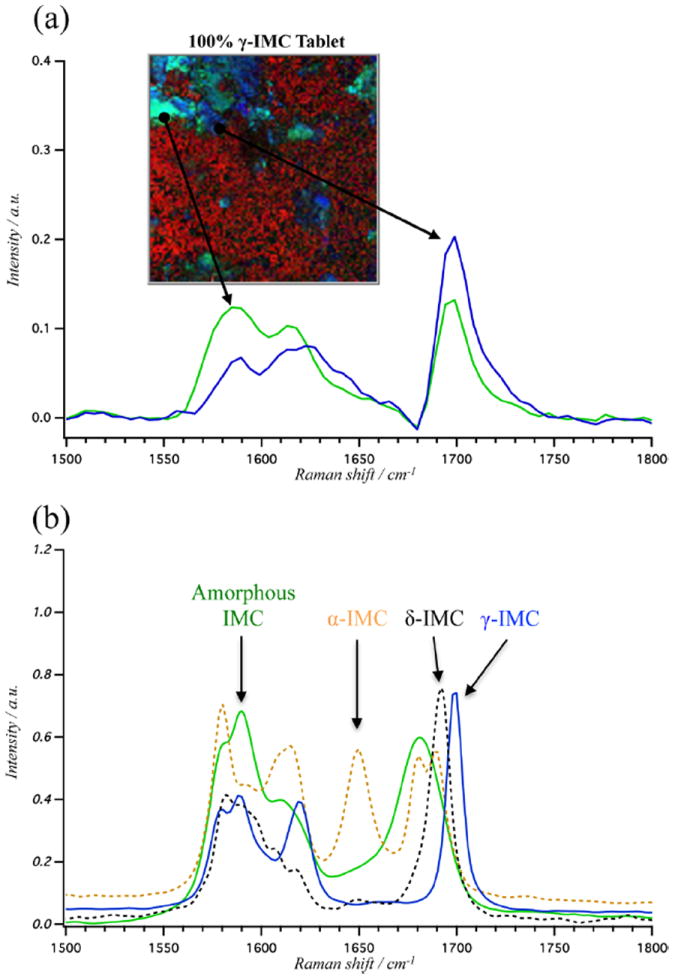
(a) BCARS pseudocolored image of 100% γ-indomethacin tablet surface (R:2880 cm−1, G:1590 cm−1, and B:1700 cm−1) and, below, Raman spectra of the representative pixels. (b) Spontaneous Raman spectra between 1500 and 1800 cm−1 of pure samples of γ-indomethacin (solid blue), δ-indomethacin (dashed black), α-indomethacin (dashed yellow), and amorphous indomethacin (solid green).
In order to determine whether the unusual spectral signal was due to an optical artifact associated with BCARS signal generation or detection, we re-examined the tablet surface using confocal spontaneous Raman imaging. Figure 7 shows an image of the γ-IMC tablet generated from a confocal Raman microscope using 2 μm steps over a 102 × 42 μm image. Spectra were acquired at 10 s/pixel (100× slower than the BCARS acquisition times), covering only the 250 cm−1 spectral region needed to identify the aberrant spectrum. Confocal Raman imaging confirmed our BCARS observation, as the γ-IMC crystals show an identical set of spectral features; one of which is the known spectrum of γ-IMC and another of which displays the 1:1 peak intensity ratio as on the BCARS instrument.
Figure 7.
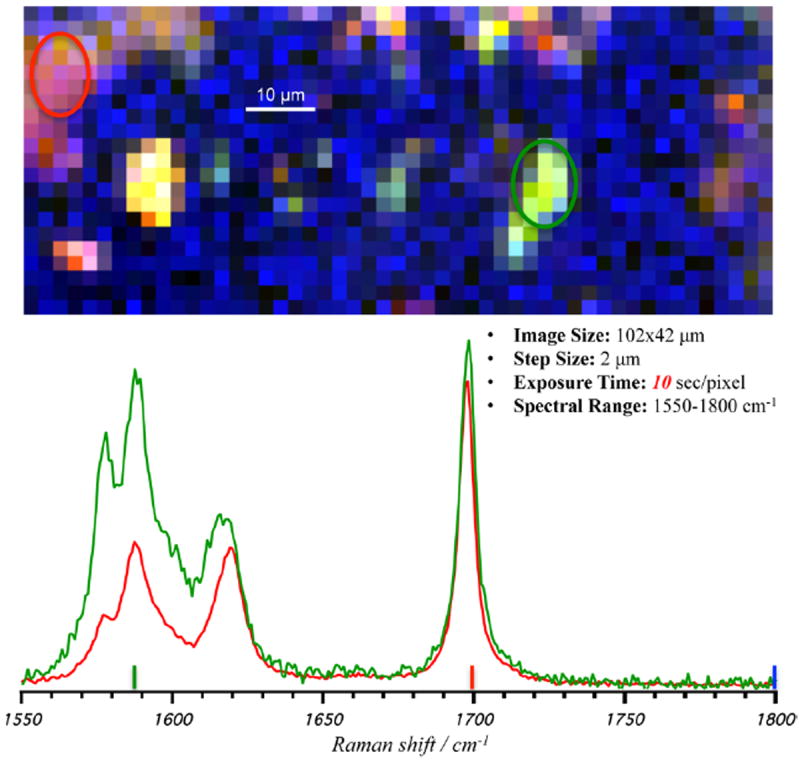
Pseudocolored image from the confocal spontaneous Raman scattering microscope of 100% γ-indomethacin tablet surface (R:1700 cm−1, G:1590 cm−1, and B:2880 cm−1). Circles highlight areas of the tablet surface with ratio changes to carbonyl and alkene stretching modes from 2:1 (red circle and spectra) to 1:1 (green circle and spectra), from left to right obtained from spectral average of areas.
In considering the possible identity and origin of a contaminating species, we consider the following. (1) We ruled out the presence of a contaminating component, thus establishing the purity of the starting materials as described in Materials and Preparation of Tablets. (2) We ruled out the possibility of a polarization-dependent BCARS response of γ-IMC by noting that, for single crystals of γ-IMC, the BCARS spectrum does change with polarization of excitation light. (3) We noted that γ-IMC is the most stable of the known polymorphs of IMC, and the unusual spectrum did not show up in the α-IMC samples, although that polymorph is metastable. (4) We determined that the unexpected spectral component was not related to laser damage or melting since it was observed with no change at short acquisition times, at much longer BCARS pixel acquisition times, and with spontaneous Raman under low CW power. These points of evidence lead us to suspect a phase change from γ-IMC to a higher-energy form during a processing step that was unique to that polymorph.
Figure 6 b shows Raman spectra for the four known variants of indomethacin in the solid state. The unknown spectral feature in these tablets has the most similarity with the amorphous form of IMC. Like the unknown species, amorphous indomethacin has a Raman spectral signature that is similar to the γ-IMC polymorph, but with a small broadening and a red shift of the carbonyl stretch, as well as a ≈1:1 peak intensity ratio of the carbonyl and alkene stretching modes. Thus, we conclude that Figure 6 a is showing areas of amorphous IMC within the γ-IMC crystals.
The amorphous component observed in the γ-IMC samples seems to have arisen in the tableting process. We ruled out the presence of significant amorphous components in the pretableted γ-IMC using BCARS and confocal Raman. Amorphization can occur due to partial melting of γ-IMC during storage and transport, but this does not seem likely, since samples were held at −20 °C before being imaged at room temperature and the thermally metastable α-IMC polymorph did not display unexpected spectral signatures in any tablet. The tableting process is the most likely culprit, since tableting exposes IMC to forces on the order of 100 MPa, which has been shown to reduce crystallinity of γ-IMC by ≈10%,50 consistent with our observations.
CONCLUSIONS
We have demonstrated that the relatively rapid imaging and broadband spectral sensitivity of BCARS makes it an effective tool for imaging pharmaceutical solid dosage forms. In spite of the fact that, for this instrument, collecting backscattered BCARS signal is 10-fold less efficient than the forward collection geometry, the ability to image these samples at 100 ms per pixel is a significant improvement over spontaneous Raman imaging methods. We show that this BCARS system is >10× faster than wide-field spontaneous Raman imaging, as it provides increased SNRs per spatial area measured and significantly better spatial resolution. BCARS imaging provides spatial resolution and spectral quality comparable to confocal Raman but is 100× faster than the latter. Comparison of the present BCARS microscope to other coherent Raman microscopies is conditionally favorable. Single-frequency CARS22 or SRS51,52 microscopes must be spectrally scanned to build up a Raman spectrum. Quantitative comparisons are really not possible, but from the literature reports we can estimate that generating images with spectral information similar to those obtained here would require approximately the same amount of time in principle. For example, Garbacik et al. demonstrated single frequency signal acquisition of 75 μs. Obtaining 1000 spectral elements would require 75 ms without considering the time required to tune the OPO beyond their 250 cm−1 fast tuning range. Ozeki et al.52 demonstrated 100 μs/pixel spectral acquisition covering 300 cm−1 but with SNR < 1 in the fingerprint region. We estimate that obtaining spectra of approximately 30:1 SNR obtained here would require similar spectral acquisition times to what we have used. Here again, tuning outside a 300 cm−1 range would be time-consuming. Thus, in cases where all expected spectra are known a priori, and the important spectral information falls within a 250 cm−1 bandwidth, spectral scanning coherent Raman methods may be preferable to broadband methods. On the other hand, in cases where it is possible to encounter unexpected spectra, or very broad bandwidth is needed, broadband methods such as demonstrated here are preferred.
Here, we have used the speed and spatiochemical resolution of BCARS to generate images with somewhat higher SNR than would be needed for routine analysis. Even at this high SNR, the improved imaging speed facilitates analysis of relatively larger sample areas in shorter time than with present broadband spectral methods, providing a more representative sampling of the entire solid dosage form. Utilizing the current optical scheme, faster imaging would reduce the SNR of the spectra, but the desired chemical information could be extracted from spectra with much lower SNR than obtained here using multivariate methods.
The significant value of broadband spectral imaging is exemplified by its ability to identify an unexpected amorphous IMC component. The discovery and discrimination of the α-IMC was only possible due to the broad spectral response of BCARS. Although single-frequency coherent Raman imaging methods provide images slightly faster than BCARS at present,23 such single-frequency approaches could have missed the amorphous without prior knowledge of its potential appearance and subsequent additional imaging to discriminate it. This ability to rapidly detect spatial distribution of minor components in tablets demonstrates that broadband coherent Raman imaging could be of significant benefit to the pharmaceutical industry in drug development, process line monitoring, patent protection, and counterfeit detection.
Supplementary Material
Footnotes
Author Contributions
The manuscript was written through contributions of all authors. All authors have given approval to the final version of the manuscript.
Certain equipment, instruments, or materials are identified in this paper in order to adequately specify the experimental details. Such identification does not imply recommendation by the National Institute of Standards and Technology nor does it imply the materials are necessarily the best available for the purpose. The authors declare no competing financial interest.
Chemical analysis of indomethacin API, bulk Raman scattering from surface of all solid dosage forms used, and further evidence of the amorphous component detected by BCARS within regions of the gamma crystal. This material is available free of charge via the Internet at http://pubs.acs.org.
References
- 1.Williams JAS, Bonawi-Tan W. Journal of Manufacturing Systems. 2004;23:299–308. [Google Scholar]
- 2.Ricci C, Eliasson C, Macleod N, Newton P, Matousek P, Kazarian S. Anal Bioanal Chem. 2007;389:1525–1532. doi: 10.1007/s00216-007-1543-1. [DOI] [PubMed] [Google Scholar]
- 3.FDA. Guidance for industry: PAT—A Framework for Innovative Pharmaceutical Development, Manufacturing and Quality Assurance. Pharmaceutical CGMPs; Rockville, MD: 2004. [Google Scholar]
- 4.Llinàs A, Goodman JM. Drug Discovery Today. 2008;13:198–210. doi: 10.1016/j.drudis.2007.11.006. [DOI] [PubMed] [Google Scholar]
- 5.Jung M-S, Kim J-S, Kim M-S, Alhalaweh A, Cho W, Hwang S-J, Velaga SP. J Pharm Pharmacol. 2010;62:1560–1568. doi: 10.1111/j.2042-7158.2010.01189.x. [DOI] [PubMed] [Google Scholar]
- 6.Kesisoglou F, Wu Y. AAPS J. 2008;10:516–525. doi: 10.1208/s12248-008-9061-4. [DOI] [PMC free article] [PubMed] [Google Scholar]
- 7.Okumura T, Otsuka M. Pharm Res. 2005;22:1350–1357. doi: 10.1007/s11095-005-5281-9. [DOI] [PubMed] [Google Scholar]
- 8.Campeta AM, Chekal BP, Abramov YA, Meenan PA, Henson MJ, Shi B, Singer RA, Horspool KR. J Pharm Sci. 2010;99:3874–3886. doi: 10.1002/jps.22230. [DOI] [PubMed] [Google Scholar]
- 9.Giron D, Monnier S, Mutz M, Piechon P, Buser T, Stowasser F, Schulze K, Bellus M. J Therm Anal Calorim. 2007;89:729–743. [Google Scholar]
- 10.Yuksel N, Baykara M, Shirinzade H, Suzen S. Int J Pharm. 2011;404:102–109. doi: 10.1016/j.ijpharm.2010.11.011. [DOI] [PubMed] [Google Scholar]
- 11.Gowen A, O’Donnell CP, Cullen PJ, Bell SEJ. Eur J Pharm Biopharm. 2008;69:10–22. doi: 10.1016/j.ejpb.2007.10.013. [DOI] [PubMed] [Google Scholar]
- 12.Vankeirsbilck T, Vercauteren A, Baeyens W, Van der Weken G, Verpoort F, Vergote G, Remon J. TrAC, Trends Anal Chem. 2002;21:869–877. [Google Scholar]
- 13.Greco K, Bogner R. Mol Pharmaceutics. 2010;7:1406–1418. doi: 10.1021/mp1000197. [DOI] [PubMed] [Google Scholar]
- 14.Fedotov A, Shakhtshneider T, Chesalov Y, Surov E. Pharm Chem J. 2009;43:68–70. [Google Scholar]
- 15.Chan KLA, Hammond SV, Kazarian SG. Anal Chem. 2003;75:2140–2146. doi: 10.1021/ac026456b. [DOI] [PubMed] [Google Scholar]
- 16.Breitenbach J, Schrof W, Neumann J. Pharm Res. 1999;16:1109–1113. doi: 10.1023/a:1018956304595. [DOI] [PubMed] [Google Scholar]
- 17.Wartewig S, Neubert RHH. Adv Drug Delivery Rev. 2005;57:1144–1170. doi: 10.1016/j.addr.2005.01.022. [DOI] [PubMed] [Google Scholar]
- 18.Sasic S, Clark DA. Appl Spectrosc. 2006;60:494–502. doi: 10.1366/000370206777412103. [DOI] [PubMed] [Google Scholar]
- 19.Strachan CJ, Windbergs M, Offerhaus HL. Int J Pharm. 2011;417:163–172. doi: 10.1016/j.ijpharm.2010.12.017. [DOI] [PubMed] [Google Scholar]
- 20.Toth SJ, Madden JT, Taylor LS, Marsac P, Simpson GJ. Anal Chem. 2012;84:5869–5875. doi: 10.1021/ac300917t. [DOI] [PMC free article] [PubMed] [Google Scholar]
- 21.Windbergs M, Jurna M, Offerhaus HL, Herek JL, Kleinebudde P, Strachan CJ. Anal Chem. 2009;81:2085–2091. doi: 10.1021/ac8020856. [DOI] [PubMed] [Google Scholar]
- 22.Garbacik E, Herek J, Otto C, Offerhaus H. J Raman Spectrosc. 2012;43:651–655. [Google Scholar]
- 23.Slipchenko MN, Chen H, Ely DR, Jung Y, Carvajal MT, Cheng J-X. Analyst. 2010;135:2613–2619. doi: 10.1039/c0an00252f. [DOI] [PubMed] [Google Scholar]
- 24.Maker PD, Terhune RW. Phys Rev. 1965;137:A801–A818. [Google Scholar]
- 25.Duncan MD, Reintjes J, Manuccia TJ. Opt Lett. 1982;7:350–352. doi: 10.1364/ol.7.000350. [DOI] [PubMed] [Google Scholar]
- 26.Zumbusch A, Holtom GR, Xie XS. Phys Rev Lett. 1999;82:4142–4145. [Google Scholar]
- 27.Day JPR, Rago G, Domke KF, Velikov KP, Bonn M. J Am Chem Soc. 2010;132:8433–8439. doi: 10.1021/ja102069d. [DOI] [PubMed] [Google Scholar]
- 28.Brackmann C, Esguerra M, Olausson D, Delbro D, Krettek A, Gatenholm P, Enejder A. J Biomed Opt. 2011;16:021115. doi: 10.1117/1.3534782. [DOI] [PubMed] [Google Scholar]
- 29.Baldacchini T, Zadoyan R. Opt Express. 2010;18:19219–19231. doi: 10.1364/OE.18.019219. [DOI] [PubMed] [Google Scholar]
- 30.Potma EO, Xie XS, Muntean L, Preusser J, Jones D, Ye J, Leone SR, Hinsberg WD, Schade W. J Phys Chem B. 2004;108:1296–1301. [Google Scholar]
- 31.Lee YJ, Parekh SH, Kim YH, Cicerone MT. Opt Express. 2010;18:4371–4379. doi: 10.1364/OE.18.004371. [DOI] [PubMed] [Google Scholar]
- 32.Lee YJ, Liu Y, Cicerone MT. Opt Lett. 2007;32:3370–3372. doi: 10.1364/ol.32.003370. [DOI] [PubMed] [Google Scholar]
- 33.Parekh S, Fagan J, Cicerone M. Phys Rev B. 2010;82:165432. [Google Scholar]
- 34.Parekh SH, Lee YJ, Aamer KA, Cicerone MT. Biophys J. 2010;99:2695–2704. doi: 10.1016/j.bpj.2010.08.009. [DOI] [PMC free article] [PubMed] [Google Scholar]
- 35.Liu Y, Lee YJ, Cicerone MT. Opt Lett. 2009;34:1363–1365. doi: 10.1364/ol.34.001363. [DOI] [PMC free article] [PubMed] [Google Scholar]
- 36.Kee TW, Cicerone MT. Opt Lett. 2004;29:2701–2703. doi: 10.1364/ol.29.002701. [DOI] [PMC free article] [PubMed] [Google Scholar]
- 37.Sabina EP, Nagar S, Rasool M. Inflammation. 2010;34:184–192. doi: 10.1007/s10753-010-9222-3. [DOI] [PubMed] [Google Scholar]
- 38.Andronis V, Zografi G. J Non-Cryst Solids. 2000;271:236–248. [Google Scholar]
- 39.Basavoju S, Boström D, Velaga S. Pharm Res. 2008;25:530–541. doi: 10.1007/s11095-007-9394-1. [DOI] [PubMed] [Google Scholar]
- 40.Lee YJ, Moon D, Migler KB, Cicerone MT. Anal Chem. 2011;83:2733–2739. doi: 10.1021/ac103351q. [DOI] [PubMed] [Google Scholar]
- 41.Taylor LS, Zografi G. Pharm Res. 1997;14:1–8. doi: 10.1023/a:1012167410376. [DOI] [PubMed] [Google Scholar]
- 42.Heinz A, Savolainen M, Rades T, Strachan CJ. Eur J Pharm Sci. 2007;32:182–192. doi: 10.1016/j.ejps.2007.07.003. [DOI] [PubMed] [Google Scholar]
- 43.Bahl D, Bogner R. Pharm Res. 2006;23:2317–2325. doi: 10.1007/s11095-006-9062-x. [DOI] [PubMed] [Google Scholar]
- 44.Otsuka M, Kato F, Matsuda Y. AAPS J. 2000;2:80–87. doi: 10.1208/ps020109. [DOI] [PMC free article] [PubMed] [Google Scholar]
- 45.Pan X, Julian T, Augsburger L. AAPS PharmSciTech. 2006;7:E11. doi: 10.1208/pt070111. [DOI] [PMC free article] [PubMed] [Google Scholar]
- 46.Carpentier L, Decressain R, Desprez S. J Phys Chem B. 2006;110:457–464. doi: 10.1021/jp053545u. [DOI] [PubMed] [Google Scholar]
- 47.Hancock BC, Parks M. Pharm Res. 2000;17:397–404. doi: 10.1023/a:1007516718048. [DOI] [PubMed] [Google Scholar]
- 48.Legendre B, Feutelais Y. J Therm Anal Calorim. 2004;76:255–264. [Google Scholar]
- 49.Stewart S, Priore RJ, Nelson MP, Treado PJ. Annu Rev Anal Chem. 2012;5:337–360. doi: 10.1146/annurev-anchem-062011-143152. [DOI] [PubMed] [Google Scholar]
- 50.Hédoux A, Guinet Y, Capet F, Paccou L, Descamps M. Phys Rev B. 2008;77:094205. doi: 10.1021/jp061784r. [DOI] [PubMed] [Google Scholar]
- 51.Kong L, Ji M, Holtom G, Fu D, Freudiger C, Xie XS. Opt Lett. 2013;38:145–147. doi: 10.1364/OL.38.000145. [DOI] [PMC free article] [PubMed] [Google Scholar]
- 52.Ozeki Y, Umemura W, Sumimura K, Nishizawa N, Fukui K, Itoh K. Opt Lett. 2012;37:431–433. doi: 10.1364/OL.37.000431. [DOI] [PubMed] [Google Scholar]
Associated Data
This section collects any data citations, data availability statements, or supplementary materials included in this article.


