

Abstract
Epigenetic marks such as DNA methylation have generated great interest in the study of human disease. However, studies of DNA methylation have not established population-epigenetics principles to guide design, efficient statistics, or interpretation. Here, we show that the clustering of correlated DNA methylation at CpGs was similar to that of linkage-disequilibrium (LD) correlation in genetic SNP variation but for much shorter distances. Some clustering of methylated CpGs appeared to be genetically driven. Further, a set of correlated methylated CpGs related to a single SNP-based LD block was not always physically contiguous—segments of uncorrelated methylation as long as 300 kb could be interspersed in the cluster. Thus, we denoted these sets of correlated CpGs as GeMes, defined as potentially noncontiguous methylation clusters under the control of one or more methylation quantitative trait loci. This type of correlated methylation structure has implications for both biological functions of DNA methylation and for the design, analysis, and interpretation of epigenome-wide association studies.
Introduction
Epigenetic marks such as DNA methylation have generated great interest in the study of human disease and in epidemiology broadly, given the potential for epigenetic mediation of genetic or environmental risk factors for disease and their potential as biomarkers of exposure or disease risk and progression.1,2 Because of this, several recent publications have examined genome-scale DNA-methylation data through either array-based or whole-genome bisulfite-sequencing technologies.3–7 However, studies of DNA methylation have not yet established population-epigenetics principles to guide design, efficient statistics, or interpretation. For example, SNP analyses rely on the population-genetics concept of linkage disequilibrium (LD) to inform the design of custom arrays, efficient statistical approaches such as haplotype analyses, and interpretation of associations observed with respect to localization and putative functional relevance.8 Epigenetic epidemiology would benefit greatly from a similar set of population-epigenetics concepts.
We and others have shown that variable methylation—across tissues within individuals or for a given tissue across individuals in a population—tends to occur in “regions” of several CpGs;9,10 however, little is currently documented and understood about the specific genomic locations of such “regions,” the amount of variability, or the spatial properties of correlated DNA methylation within people, within populations, and across populations. Because some of the variability at particular DNA-methylation sites is indeed dependent on genotype,6,11,12 these epigenetic properties might parallel population-genetic properties. However, no one to date has attempted to document this in parallel to sequence-variation properties at a population level. The accumulation of several recent epigenetic-epidemiology projects using genome-scale array data, such as the Illumina HumanMethylation450 array, in concert with sequence information such as SNP data from genome-wide association studies (GWASs), now makes such description possible.6
Here, we show that the correlation of DNA methylation at CpGs within variably methylated regions (VMRs) was similar to the LD correlation in genetic SNP variation but for much shorter distances when contiguous CpGs were considered. Some clustering of methylated CpGs appeared to be genetically driven; SNPs in LD blocks associated with correlated methylated CpGs. Further, the set of correlated methylated CpGs associated with a single SNP-based LD block showed “gap” patterns in which segments as long as 300 kb had uncorrelated methylation between segments correlated with each other and associated with a particular SNP signal. We termed these correlated CpGs “GeMes” for genetically controlled methylation clusters. Thus, although proximal, the spatial clustering of methylation patterns was not directly contiguous, and the structure was most likely controlled by DNA sequence. Even though genetic variants, such as methylation quantitative trait loci (meQTLs), have been previously reported11–15 to control CpG methylation, we conducted a genome-wide study of GeMes at a population level. This type of correlated methylation structure has implications for both biological functions of DNA methylation and the design, analysis, and interpretation of epigenome-wide associations studies (EWASs).
Material and Methods
DNA Methylation and Genotype Data
We obtained two publicly available data sets for DNA methylation. We used data from the Gene Expression Omnibus (GEO) for the Illumina HumanMethylation450 array data on whole blood (accession number GSE42861). These individuals were selected from the Epidemiological Investigation of Rheumatoid Arthritis (EIRA), a Swedish population-based case-control study. Only control individuals from one batch (hybridized in 2012) were included in these analyses. EIRA control subjects were selected to match rheumatoid arthritis (RA [MIM 180300]) case subjects in terms of age, gender, and residential area at the time of diagnosis. All individuals were of self-reported European ancestry and did not have obvious population stratification according to ancestry estimation from genome-wide SNP data.16 More detailed recruitment procedure for the EIRA study was described previously.16 After exclusion of three samples that failed our quality-control procedures, the final methylation data set included 247 individuals. The genotyping procedures for these 247 samples have been described previously.16
We obtained the other DNA-methylation data set also from GEO (accession number GSE43414).17 These individuals were selected from one cohort of the Medical Research Council London Brain Bank for Neurodegenerative Diseases.17 After exclusion of individuals who failed our quality-control procedures, the final data set on whole blood used for replication included 91 individuals.
The Baltimore Longitudinal Study of Aging (BLSA) is an ongoing, long-term, open-panel study on normal human aging. Study design and recruitment for the BLSA have been described previously.18 Most of the participants were community-dwelling individuals from the Washington-Baltimore area. The DNA-methylation data were generated with the Illumina HumanMethylation450 array according to the manufacturer’s recommendations. A total of 305 individuals of European descent, as estimated via ancestry principle components from genome-wide SNP data, were included in the analyses. The DNA-methylation data are available from GEO under accession number GSE54882.
Initial Identification of Contiguous Methylation Clusters
Ultimately, we recommend defining GeMes by a combination of information about genetic control and CpG methylation correlation, as described formally below. However, to initially describe correlation patterns of CpGs at the genome level, we began with solely contiguous definitions based on observed methylation correlation alone. We used probes only on autosomes and excluded probes containing SNPs (dbSNP v.132) at the probed CpG sites to eliminate artifacts due to differential hybridization, resulting in a data set of 417,457 CpGs. We estimated cell-type distribution for each individual on the basis of his or her methylation data19 and used methylation residuals after adjusting for estimated cell proportions6 and sex. We then only focused on the top 25% of the most variably methylated CpG sites (vCpGs) in the data set for downstream analyses.
We defined a potential contiguous methylation cluster as containing at least three neighboring vCpG sites on the Illumina HumanMethylation450 array and having at least 50% of its vCpG pairs showing a methylation correlation coefficient (r2) ≥ 0.4. To avoid biases potentially driven by outliers, we performed bootstrapping with sample replacement (1,000 times) and only kept the contiguous methylation clusters present in at least 99% of all bootstrap samples.
To identify contiguous methylation clusters after adjusting for potential confounding by ancestry mixture, we further calculated methylation residuals by using a linear regression model predicting methylation at each CpG site as a function of the top two principal components of genotype data, in addition to estimated cell proportions and gender. We then used these residuals to identify contiguous methylation clusters as described above.
Analysis of Methylation-Correlation Decay and Genetic-LD Decay
To determine the spatial rate of decay for vCpGs, we computed a Pearson correlation coefficient (r2) between each pair of vCpGs. We generated the decay-rate plot by fitting a cubic smoothing spline of r2 against genomic distance. In the case of SNPs, we used the software package Haploview to determine the LD correlation between all pairs of SNPs. Given the density of SNPs, we filtered to only those with a minor allele frequency (MAF) > 10% for this genome-wide evaluation.
Enrichment of DHSs and Smoking-Associated DMPs in Contiguous Methylation Clusters
DNase I hypersensitive sites (DHSs) are based on the manufacture annotation file from the Illumina HumanMethylation450 array. Twenty-six smoking-associated differentially methylated positions (DMPs) were obtained from previously published results.20 These DMPs were checked against contiguous methylation clusters generated from whole blood (Tables S1 and S2, available online). The p values for enrichment were computed with Fisher’s exact test.
Identification of GeMes
Correlated CpG clusters, in which CpG methylation is most likely controlled by the same genetic signal, are designated GeMes. These are not necessarily contiguous but are rather defined via the following steps: (1) identify all vCpGs whose methylation level is associated with at least one SNP within 5 Mb (i.e., identify all statistically significant vCpG-meQTL pairs at p < 1 × 10⁻¹³), (2) group one or more vCpGs associated with the same SNP into a vCpG cluster, (3) merge vCpG clusters if any of their members share a common meQTL, (4) and retain only clusters with more than two vCpGs. These vCpG clusters are labeled GeMes, and we refer to all SNPs associated with any vCpG methylation in that GeMe as a SNP cluster.
These steps were based on genome-wide association analyses for all vCpGs to identify SNPs that might be meQTLs at each vCpG. For this analysis, all Illumina HumanMethylation450 probes on sex chromosomes or probes containing SNPs (dbSNP v.132) anywhere in the sequence (which might affect the interpretation of meQTL results) were excluded, leaving 68,561 vCpGs. These vCpGs were subsequently tested for association with autosome SNPs with MAF > 1% and at least ten individuals in each genotype group in these data (total 609,162 SNPs) via an additive minor-allele dosage model. vCpG-SNP associations were corrected for multiple testing with a stringent Bonferroni-adjusted threshold of 1 × 10⁻¹³ (<0.05 / (68,561 × 60,9162) = 1.20 × 10⁻¹²). Cis-meQTLs were then identified for sets of genome-wide significant vCpG-SNP pairs (or vCpG-specific meQTLs), in which the distance between the vCpG and SNP was less than 5 Mb.
Enrichment of GWAS SNPs among meQTLs and GeMes
The GWAS SNP set used for analysis was derived from the National Human Genome Research Institute (NHGRI) Catalog of Published GWASs21 and was processed as described previously.22 The p values for enrichment were computed with Fisher’s exact test.
Bisulfite Pyrosequencing
To replicate the relationship between GeMes and GWAS SNPs at the FADS1 (MIM 606148)-FADS2 (MIM 606149) and GSDMA (MIM 611218)-GSDMB (MIM 611221) regions, we selected an independent set of 90 EIRA healthy individuals for the experiment. We bisulfite converted 200 ng of genomic DNA from each sample with an EZ DNA Methylation-Gold Kit (ZYMO Research) according to the manufacturer’s recommendations. We amplified bisulfite-converted genomic DNA by PCR with unbiased nested primers and carried out quantitative pyrosequencing to measure DNA methylation at each CpG site with a PSQ HS96 (Biotage). The percentage of DNA methylation was determined with Pyro Q-CpG methylation software (Biotage). Genomic DNA amplified by the REPLI-g Mini Kit (QIAGEN) was used as the nonmethylated DNA control, and SssI-treated genomic DNA was used as the 100% methylation control. Different percentage mixtures containing nonmethylated and 100% methylated controls were also used as 25%, 50%, and 75% methylation controls. Genomic coordinates and primer sequences for all bisulfite-pyrosequencing reactions are provided in Table S3.
Analysis Software
All analyses were performed in R 2.15 and Bioconductor 2.9. Illumina HumanMethylation450 array data were analyzed with the “minfi” package.
Results
Genome-Level Spatial Correlation of DNA Methylation versus LD
To initially compare methylation structure to SNP structure in genetic studies, we first examined the observed correlation in DNA-methylation data generated from Illumina HumanMethylation450 arrays on whole-blood-derived DNA from 247 healthy individuals from the EIRA study.6,16 We focused on the top 25% of CpG sites with the largest methylation variation (vCpGs) because these are epigenetic variants informative for methylation studies, just as polymorphic SNPs are for genetic studies. Of these vCpGs, 41,772 could be separated into 9,836 regions containing at least three contiguous variable probes, a pattern similar to what we observed previously as VMRs.9,10 Figure 1A shows a typical pattern of DNA methylation in a region where there is variable methylation between individuals and spatial correlation in methylation levels within individuals (Figures 1A and 1B).
Figure 1.
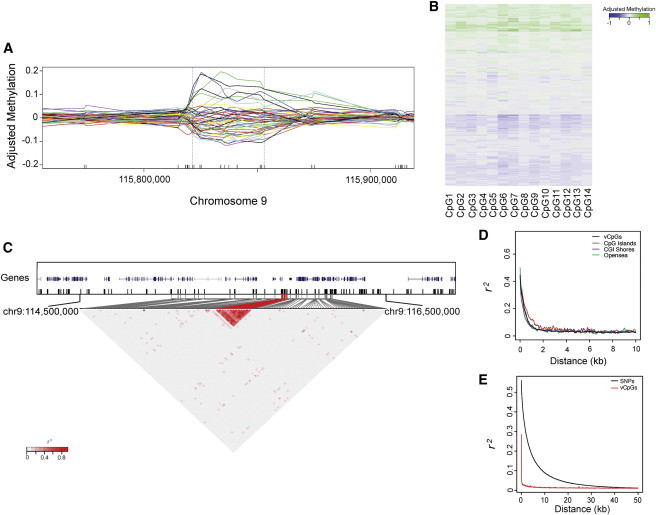
Clustering of Correlated Methylated CpGs
(A) An example of a contiguous methylation cluster identified on chromosome 9. Each line shows the smoothed methylation residual of one individual with the use of the smooth.spline function from R. A random 50 individuals was plotted here for easy visualization.
(B) Detailed DNA-methylation levels among populations for the CpG sites within the contiguous methylation cluster shown in (A). Each row represents the methylation residual of one individual, and each column represents a different CpG site. Values of methylation residuals range from low (blue) to high (green) on the color scale.
(C) DNA-methylation correlation for the contiguous methylation cluster shown in (A). The ticks in the top panel represent CpG sites that were covered in the arrays. The bottom panel shows a zoomed-in heatmap image of the region indicated in the top panel. The measure of the correlation coefficient (r2) of methylation residuals among all possible pairs of CpGs is shown graphically according to the shade of red; gray represents low r2, and red represents high r2. Probes from identified contiguous methylation clusters are highlighted in red.
(D) Plot of the decay rate of r2 against the distance for DNA methylation on vCpG sites. Different color lines represent probes of different vCpG context from the Illumina HumanMethylation450 arrays.
(E) Plot of the correlation decay for genetic variants (black line) or for DNA methylation (red line).
These patterns could be seen at the chromosome and genome level. Figure 1C shows a heat map of the pairwise correlation in DNA-methylation levels across a 1 Mb region of chromosome 9, where there was clearly clustering of highly spatially correlated vCpGs. Similar to patterns of LD, such patterns tended to show decay in correlation strength with increasing distance and existed regardless of epigenetic annotation, such as CpG islands, shores, or open seas (Figure 1D). However, the length of these contiguous methylation clusters appeared to be much shorter than that of LD blocks—the methylation correlation was reduced by half in less than 500 bp, whereas SNP-based LD correlation was reduced by half in approximately 3 kb in these same individuals (Figures 1D and 1E), although a direct comparison between SNP-based LD-correlation decay and spatial-methylation decay is difficult given the density of the 450K array. This does demonstrate, however, that the normal human methylome includes groups of CpGs that vary coordinately in the population.
To examine the locations and patterns of these contiguously correlated methylation sites, we began with a working definition of a contiguous methylation cluster according to rules similar to those applied for defining LD blocks23 (see Material and Methods). In our 247 samples, and on the basis of 450K array density, we identified 2,100 contiguous methylation clusters (Table S1), containing a total of 8,491 vCpG sites. To evaluate the biological relevance of these contiguous methylation clusters, we then checked the enrichment of DHSs, given that DHSs mark accessible chromatin regions for active transcription.22,24 Compared to the 450K array background, the proportion of DHS-located CpGs that were also in a contiguous methylation cluster showed a 1.89-fold enrichment (Table S4). This enrichment was further increased to 2.17-fold when we changed the definition of a contiguous methylation cluster to include at least five vCpG sites (Table S4), implying that areas of contiguous methylation clusters might be relevant areas of accessible epigenome.
We replicated these results in two additional data sets. In the first, containing DNA-methylation data from Illumina HumanMethylation450 array for 91 whole-blood-derived DNA samples17 (GEO accession number GSE43414), we identified 2,434 contiguous methylation clusters, containing a total of 10,099 vCpG sites (Table S2); of these, 6,875 (81.0%) CpG sites overlapped with our primary data sets (Figure S1). With the same approach, we also identified 2,334 contiguous methylation clusters, containing a total of 9,518 vCpG sites, from a third data set (the BLSA) (Table S2); of these, 7,550 (88.9%) CpG sites overlapped with our primary data set (Figure S1).
Although the blood-derived contiguous-methylation-cluster patterns were consistent across three independent samples, it is possible that these correlation patterns represent the effects of common underlying confounders, such as ancestry mixtures. We thus evaluated the potential confounding by ancestry mixtures by performing contiguous-methylation-cluster analysis with methylation residuals after further adjusting for the top two principal components of genotype data, the surrogate measurements of ancestry mixtures,25 and noticed that almost all the contiguous methylation clusters (99%) from our primary data set were still present after ancestry adjustment (Figure S2).
Smoking-Associated DMPs Are Enriched in Contiguous Methylation Clusters
Given the interest in DNA methylation and environmental exposures,20,26–28 particularly the growing associations with smoking,20,29 we examined whether variation at these contiguous methylation clusters was associated with these factors and whether such correlated regions were enriched with smoking associations. We observed that 16 of 26 smoking-associated DMPs20 were present in contiguous methylation clusters identified from our primary data set (Table 1); this represented a 30.26-fold enrichment in comparison to the 450K array background (p value < 2.2 × 10⁻¹⁶) (Table S5). The enrichment of smoking-associated DMPs in contiguous methylation clusters was also observed in the other two replication data sets (Table S5). This implies that the epigenome susceptible to environmental exposures might be enriched with contiguous methylation clusters and that focus on spatially correlated units such as contiguous methylation clusters might be particularly efficient for environmental epigenetic analyses.
Table 1.
Smoking DMPs Are Enriched in Contiguous Methylation Clusters
| CpG | Chr | Gene | Contiguous Methylation Clusters |
|---|---|---|---|
| cg05575921 | 5 | AHRR | no |
| cg05549655 | 15 | CYP1A1 | yes |
| cg11924019 | 15 | CYP1A1 | yes |
| cg09935388 | 1 | GFI1 | yes |
| cg12876356 | 1 | GFI1 | yes |
| cg18316974 | 1 | GFI1 | yes |
| cg09662411 | 1 | GFI1 | yes |
| cg25949550 | 7 | CNTNAP2 | no |
| cg06338710 | 1 | GFI1 | yes |
| cg04180046 | 7 | MYO1G | yes |
| cg04598670 | 7 | ENSG00000225718 | no |
| cg23067299 | 5 | AHRR | no |
| cg18146737 | 1 | GFI1 | yes |
| cg12803068 | 7 | MYO1G | yes |
| cg14179389 | 1 | GFI1 | no |
| cg22549041 | 15 | CYP1A1 | yes |
| cg18092474 | 15 | CYP1A1 | yes |
| cg19089201 | 7 | MYO1G | no |
| cg22132788 | 7 | MYO1G | yes |
| cg10399789 | 1 | GFI1 | yes |
| cg21161138 | 5 | AHRR | no |
| cg03991871 | 5 | AHRR | no |
| cg12477880 | 21 | RUNX1 | yes |
| cg03346806 | 8 | EXT1 | no |
| cg18655025 | 14 | TTC7B | no |
| cg11715943 | 6 | HLA-DPB2 | yes |
The following abbreviation is used: chr, chromosome.
GeMes: Potentially Noncontiguous Genetically Controlled Methylation Clusters
Considering previous reports of genome-wide existence of meQTLs,11–15 we next sought to determine the relationship between contiguous methylation clusters and genotype at a population level by examining whether methylation correlation in clusters is driven by genetic variants. We identified 24,887 vCpG-SNP pairs in which the DNA methylation level was significantly associated with genotype (p value < 1.0 × 10⁻¹³). When visualized graphically, many of these vCpG-SNP association pairs formed clusters where a distinct group of vCpGs were controlled by a distinct group of SNPs. In these occasions, the methylation levels of the vCpGs controlled by the same group of SNPs were correlated, and this might have been the origin of some of the observed methylation correlation in contiguous methylation clusters (Figure 2A). Interestingly, we noticed that some distinct methylation clusters, as previously defined by contiguous spatial rules, were associated with the same underlying SNP cluster but were not spatially defined as a single cluster because uncorrelated vCpGs existed between them (Figure 2A). Methylation levels among all vCpGs controlled by the same SNP cluster were mostly correlated and would have been defined as a single spatial cluster if the vCpGs in between had not been measured (Figure 2B shows a correlation plot collapsed from Figure 2A to include only CpGs controlled by the SNP cluster). Thus, we considered these potentially noncontiguous genetically controlled methylation clusters, GeMes.
Figure 2.
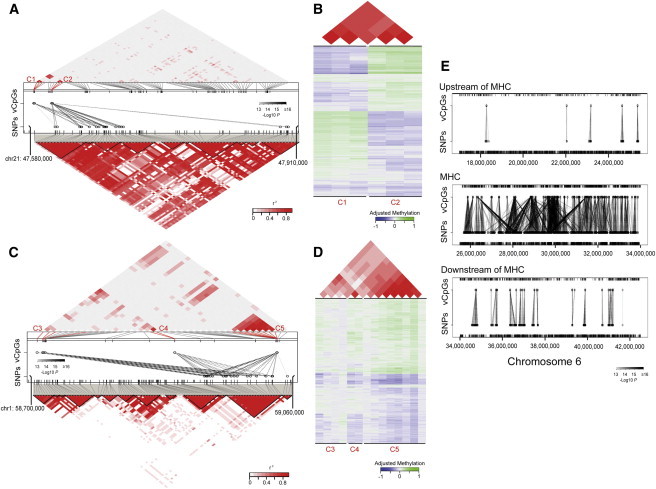
GeMes: Genetically Controlled Methylation Clusters
(A and C) Examples of GeMes on chromosomes 21 (A) and 1 (C). In the middle panels, each dashed line represents a significant association between a CpG and a SNP. The shades of black for these lines indicate significance of the associations. The ticks represent CpGs (top) and SNPs (bottom) that were covered in the arrays. Identified CpG probes whose methylation levels are controlled by genotype are indicated and highlighted in red. The methylation correlation (top panels) and genetic-LD correlation (bottom panels) for all the probes covered in the region are shown correspondingly. The measure of the correlation coefficient of the methylation level, as well as the genetic-LD correlation, is shown graphically according to the shades of red; gray represents low r2, and red represents high r2.
(B and D) Plots of detailed DNA-methylation levels, as well as their correlations, are shown; (B) is collapsed from (A) and (D) is collapsed from (C) to include only sites on GeMes. Bottom panels: each row represents the methylation residual of one individual, and each column represents a different CpG site whose location is indicated and highlighted in (A) or (C). Values of DNA-methylation residuals range from low (blue) to high (green) on the color scale. Top panels: the measure of the correlation coefficient of the methylation level for the corresponding CpG sites.
(E) Associations between CpG sites and SNPs upstream of (top panel), within (middle panel), or downstream of (bottom panel) the major histocompatibility complex (MHC) region. Each dashed line represents a significant association, and the shades of black indicate significance of the associations.
In order to identify GeMes across the genome, we expanded our genotype-methylation association analysis by using all 104,365 individual vCpGs, i.e., not starting with the contiguous correlated CpGs but rather excluding any 450K probes containing SNPs because they might have affected the measurement of DNA methylation. This resulted in a data set composed of 609,162 SNPs and 68,561 vCpGs. We then identified the individual vCpGs that were associated with SNPs, i.e., the meQTLs.11–15 We identified 97,658 vCpG-SNP pairs in which the DNA-methylation level was significantly associated with genotype (meQTLs; p value < 1.0 × 10⁻¹³) (Table S6). Among these vCpG-SNP pairs, 91,589 (93.8%) of the CpGs lay < 5 Mb from the associated SNP (Figure S3), suggesting that the majority of genetically influenced methylation was controlled through cis-regulation, similar to what has been reported (cis-meQTLs).11–15 These vCpG-SNP pairs comprised 5,919 unique vCpGs and 52,170 unique SNPs. We then separated vCpG clusters to include any vCpGs controlled by any SNP in a distinct group of cis-meQTLs so that each genotype-controlled methylation cluster contained an independent set of vCpGs and cis-meQTLs. We identified a total of 3,404 such clusters, in which the average number of SNPs for each cluster was 15.3 and the average number of vCpGs was 1.7 (Table S7). Of these clusters, 1,019 contained at least two vCpG sites, defined as GeMes. Using this expanded definition, we note that some of them now included additional relatively distant vCpGs, which had not been identified from the previous contiguous definitions (Figures 2C and 2D), suggesting that the structure of GeMes is not simply based on spatial patterns. For example, in Figure 2C, CpG sites more than 300 kb away (C3 and C5) are in the same GeMe, even though SNPs near the former CpG site (C3) do not control its methylation level and further are not in LD with the associated SNP cluster.
To confirm the finding of GeMes, we replicated the findings in the BLSA data set for 50 randomly chosen GeMes from our primary data set, plus the two examples shown in Figures 2A and 2C. We tested whether DNA-methylation levels were controlled by the same group of SNPs. These 52 GeMes contained 991 CpG-SNP pairs with both genotype and methylation information in the BLSA. The associations between genotype and methylation were replicated in the 984 pairs (99.3%) with a Bonferroni-adjusted p value < 0.05 (Figure S4).
Given the complex and elongated LD structure of the major histocompatibility complex (MHC) region on chromosome 6, we examined the vCpG-SNP structure in that region. In the MHC region, there were clear vCpG-SNP clusters connected over small distances (similar to Figures 2A and 2C) but also SNP connections to the same vCpGs across distinct LD blocks (Figure 2E). This complex pattern of genetic control of methylation might inform genetic associations in this region6 and might help to localize signals more precisely than LD associations can resolve.
Relationship between GeMes and GWASs
Given that SNPs were found to control GeMes and that clusters of methylated CpGs are smaller than LD blocks, we examined whether incorporating CpG-methylation data with GWAS SNP-association data could help us better understand the functional effects of genome-wide associations. We first examined the enrichment of 5,654 noncoding disease-associated SNPs from the NHGRI Catalog of Published GWASs (5,134 unique SNPs)21,22 among the SNPs we found associated with DNA methylation (meQTLs). Among 2,336 GWAS-identified SNPs available in our study, 322 were meQTLs, representing a 1.61-fold enrichment in comparison to all available SNPs (p value = 5.12 × 10⁻¹⁴). This is consistent with others’ observations that GWAS SNPs are enriched among certain functionally annotated categories30 and suggests that SNPs associated with disease might be related to epigenetic mechanisms.
We then performed the same analysis but limited it to the 1,019 GeMes in which the same SNP cluster controlled at least two vCpG sites. We observed a 1.86-fold enrichment for these SNP in comparison to all available SNPs (p value = 1.39 × 10⁻¹³); this was further enhanced when we considered all meQTLs, although the difference between GeMe enrichment and meQTL enrichment was just outside the range of statistical significance (p value = 0.07; Figure 3A). When we considered GWAS SNPs on the basis of their phenotypic classes, the largest enrichment groups were in autoimmune diseases, serum metabolites, and hematological parameters. For these, GeMe enrichment was higher than meQTLs enrichment, and the difference between them achieved statistical significance for autoimmune diseases (p value = 0.03; Figure 3A), consistent with the fact that we identified these GeMes from whole blood. This result indicates that these GeMes might be epigenetically relevant units in interpreting disease-associated SNPs.
Figure 3.
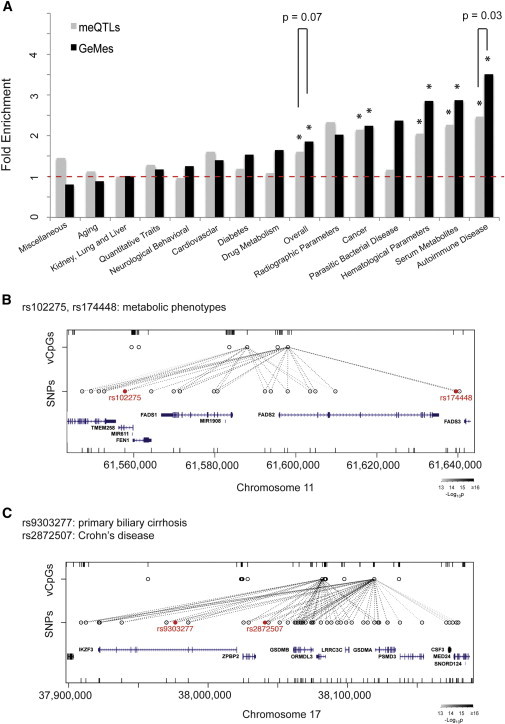
Implications for Disease-Associated SNPs
(A) SNPs controlling DNA methylation in meQTLs or GeMes were enriched in GWAS variants (overall), and this enrichment was phenotypic-class specific. Grey bars represent SNPs associated with DNA-methylation levels (meQTLs), and black bars represent SNPs associated with GeMes. Asterisks indicate significant enrichment of GWAS variants in comparison to all available SNPs (p value < 0.01, Fisher’s exact test).
(B and C) Two selected examples (the FADS1-FADS2 region in B and the GSDMA-GSDMB region in C) in which identifying GeMes controlled by GWAS SNPs might help in fine mapping the variants important for disease phenotype. The GWAS variants identified from other studies are indicated in red. The ticks represent CpGs (top) and SNPs (bottom) covered in the arrays. Each dashed line represents a significant association between a CpG and a SNP. The shades of black indicate significance of the associations.
Several examples highlight the potential utility of GeMes for better understanding GWAS data. A SNP on chromosome 11 (rs102275) is associated with circulating phospholipid levels and proportions,31,32 whereas a different SNP (rs174448) 100 kb away is associated with plasma phospholipid n-3 fatty-acid levels.33 By analyzing CpGs whose methylation levels are regulated by genotypes, we noticed that both SNPs, even though they belong to separate LD blocks (r2 < 0.5, CEU [Utah residents with ancestry from northern and western Europe from the CEPH collection] population in HapMap), were associated with the same GeMe near the promoter regions of genes FADS1 and FADS2 (Figure 3B), which are members of the fatty-acid desaturase gene family. This might enhance interpretation and understanding of these GWAS signals. As another example, SNP rs2872507 is associated with Crohn disease (CD [MIM 266600]),34 whereas a different SNP (rs9303277) 50 kb away is associated with primary biliary cirrhosis (PBC [MIM 109720]).35 SNPs within this region control the DNA-methylation level of a GeMe near the promoter regions of genes GSDMA and GSDMB (Figure 3C), indicating that DNA methylation might be important for disease mechanism. In fact, an earlier report showed that the disease-associated genetic variants are linked with changes in expression of GSDMB transcripts in human lymphoblastoid cell lines,36 further suggesting that DNA methylation potentially mediates genetic risk for CD and PBC. More examples can be seen in Figure S5. To further replicate the relationship between GWAS SNPs and DNA-methylation levels at GeMes at the FADS1-FADS2 and GSDMA-GSDMB regions, we performed bisulfite pyrosequencing on an independent set of 90 normal individuals. The associations between genotype and methylation were replicated at all eight tested SNP-CpG pairs with a p value < 0.05 (Figure S6). These results suggest that DNA-methylation information can help us fine map the genetic variants that might be responsible for the disease phenotype and that investigating these DNA-methylation sites might help us better understand disease mechanisms.
Discussion
In summary, we have observed clustering of correlated methylation sites that vary in the population, and this clustering represents a new type of epigenetic structure. Some clusters of methylated CpGs, termed GeMes, are driven by one or more meQTLs and can result in noncontiguous methylation clustering. Thus, the spatial clustering of methylation patterns is not directly contiguous, and the structure is most likely controlled by DNA sequence. Even though genetic variants, such as meQTLs, have been previously reported to control CpG methylation,11–15 our genome-wide study has shown the structures of DNA methylation, GeMes, at a population level.
These methylation structures were found by examination of the Illumina HumanMethylation450 array, and the data described here are subject to the same limitations of interpretation of any data from this source; these limitations include (1) potential batch effects,37 which we addressed by comparing across data sets; (2) limitations and coverage bias of the array themselves, which limit the ability to quantify objectively the number or distribution of methylation clusters; and (3) the lack of allele-specific measurements, which require whole-genome bisulfite sequencing with particularly long-read sequencing to include genetic polymorphisms within the methylation reads38 in a large population. Regarding the third point, this is the same problem as in assigning phase information to SNPs from array data, and the imputation of phase depends on a large body of pre-existing knowledge, which does not yet exist for DNA methylation. In fact, a recent study analyzed five targeted regions in a reasonably large number of samples with the added advantage of long-range 454 sequencing, permitting statements about allele-specific DNA methylation.39 This work is highly consistent and, in fact, would represent what we are now calling GeMes here. With our genome-wide identification of GeMes, it will be interesting to see how many of these are allele specific.
There are other considerations regarding our approach to identifying correlated methylation regions. For example, to be most comparative with SNP-based LD, we initially used the statistical approach from population genetics of pairwise associations to define contiguous methylation clusters. An alternative approach uses “bump hunting” to identify VMRs in data from comprehensive high-throughput array-based relative methylation without regard for directional correlation,10 but we would expect VMRs to largely overlap with contiguous methylation clusters. A test of this idea will require generation of similar algorithms for 450K data.
Further, there is an alternative explanation for the findings we describe. The SNPs driving GeMes might in fact be driving subtle cell-type differences, perhaps those that cannot be defined with cell-surface markers, and/or cell differentiation. The association with SNPs could be related to those driving cell-type proportion,40–43 which might also explain the enrichment of hematological parameters and autoimmune disease in GWASs. Arguing against this idea is the fact that most of such loci did not overlap our SNPs associated with GeMes. Another argument against this is that 94% of the vCpG-SNP pairs we identified were located within 5 Mb of each other, which is inconsistent with the idea that a SNP that drives cell-type proportion should be associated with many cell-type-associated differentially methylated regions across the genome. Even if that were the case, the regional nature of the clusters, particularly at a distance, would be of biological interest (but for the mechanism of normal development rather than for disease).
With these limitations in mind, however, several reasonable inferences can be made from these analyses. First, DNA methylation is correlated over regions with a median length of 274 bp from our data set an order of magnitude less than is SNP association. This rapid decay in DNA-methylation correlation is similar to what has been observed in wild Arabidopsis thaliana accessions,12 and DNA-methylation dependency over short regions is consistent with a recent study on bisulfite sequencing of several loci with haplotype-dependent methylation.39 However, what is different here is the examination of a large number of individuals showing that the methylation codependency itself varies across the genome and thus represents a kind of related epigenetic unit—a counterpart to LD blocks but with very different potential mechanisms. Similar to LD blocks in GWASs, this type of correlated methylation structure can be a useful tool for guiding custom array design, efficient statistical approaches, and interpretation of EWASs.
Second, some GeMes skip genomic regions to include sites at considerable genomic distance (more than 300 kb in some cases) but are apparently controlled by the same genetic architecture. This is a surprise, especially given that correlated methylation sites at a large distance can be under the influence of SNPs at one end of the interval while skipping vCpG-SNP combinations in the middle. The most plausible explanation for these data is that GeMes have a structural basis in nuclear organization, i.e., the DNA is looped within interacting domains,44 which will require future studies.
Third, methylation clusters can also reflect differences in environmental exposure and not genotype, such as smoking here. Thus, environmental agents might act to modify nuclear structure, potentially in collaboration with genetic variation, affecting the regulation of genes in contiguous or even noncontiguous regions.
Fourth, these data suggest that a potential component of GWAS disease association acts in partnership with epigenetic mechanisms. Even with a small number of DNA-methylation data sets on a limited portion of the genome, i.e., 450K, 8% of positive GWAS associations appear to converge on GeMes. This number will only increase with similar analyses using data from whole-genome bisulfite sequencing. At the very least, these results suggest that a more productive genomic research target for association studies might be the GeMes described here.
In summary, despite inherent limitations to this study, GeMes should provide a useful tool in the design and analysis of GWASs, combining conventional GWASs with targeted epigenome analysis. Such an approach might allow higher resolution than what is possible for the analogous SNP associations by themselves, given that regardless of mechanism, the sites of SNP-linked GeMes appear to bridge genomic regions and focus attention on small methylation regions within much larger LD blocks.
Acknowledgments
We thank Rafael Irizarry for the idea of using 450K array replicates to estimate and describe between-CpG correlations across the genome. This work was supported by National Institutes of Health (NIH) grants HG003233 (A.P.F) and AG042187 (to A.P.F. and M.D.F.), by Swedish AFA Insurance grants to T.J.E., and by grants to L.K. from the Swedish Strategic Research Foundation and European Research Council. The Baltimore Longitudinal Study of Aging was supported in part by the Intramural Research Program of the NIH National Institute on Aging. A portion of that support was through a research-and-development contract with MedStar Research Institute.
Contributor Information
M. Daniele Fallin, Email: dfallin@jhsph.edu.
Andrew P. Feinberg, Email: afeinberg@jhu.edu.
Supplemental Data
Web Resources
The URLs for data presented herein are as follows:
Gene Expression Omnibus (GEO), http://www.ncbi.nlm.nih.gov/geo/
MRC London Neurodegenerative Diseases Brain Bank, http://www.kcl.ac.uk/iop/depts/cn/research/MRC-London-Neurodegenerative-Diseases-Brain-Bank/
Online Mendelian Inheritance in Man (OMIM), http://www.omim.org/
Accession Numbers
The Gene Expression Omnibus (GEO) accession number for the Baltimore Longitudinal Study of Aging methylation data reported in this paper is GSE54882.
References
- 1.Mill J., Heijmans B.T. From promises to practical strategies in epigenetic epidemiology. Nat. Rev. Genet. 2013;14:585–594. doi: 10.1038/nrg3405. [DOI] [PubMed] [Google Scholar]
- 2.Rakyan V.K., Down T.A., Balding D.J., Beck S. Epigenome-wide association studies for common human diseases. Nat. Rev. Genet. 2011;12:529–541. doi: 10.1038/nrg3000. [DOI] [PMC free article] [PubMed] [Google Scholar]
- 3.Hansen K.D., Timp W., Bravo H.C., Sabunciyan S., Langmead B., McDonald O.G., Wen B., Wu H., Liu Y., Diep D. Increased methylation variation in epigenetic domains across cancer types. Nat. Genet. 2011;43:768–775. doi: 10.1038/ng.865. [DOI] [PMC free article] [PubMed] [Google Scholar]
- 4.Rakyan V.K., Beyan H., Down T.A., Hawa M.I., Maslau S., Aden D., Daunay A., Busato F., Mein C.A., Manfras B. Identification of type 1 diabetes-associated DNA methylation variable positions that precede disease diagnosis. PLoS Genet. 2011;7:e1002300. doi: 10.1371/journal.pgen.1002300. [DOI] [PMC free article] [PubMed] [Google Scholar]
- 5.Hannum G., Guinney J., Zhao L., Zhang L., Hughes G., Sadda S., Klotzle B., Bibikova M., Fan J.B., Gao Y. Genome-wide methylation profiles reveal quantitative views of human aging rates. Mol. Cell. 2013;49:359–367. doi: 10.1016/j.molcel.2012.10.016. [DOI] [PMC free article] [PubMed] [Google Scholar]
- 6.Liu Y., Aryee M.J., Padyukov L., Fallin M.D., Hesselberg E., Runarsson A., Reinius L., Acevedo N., Taub M., Ronninger M. Epigenome-wide association data implicate DNA methylation as an intermediary of genetic risk in rheumatoid arthritis. Nat. Biotechnol. 2013;31:142–147. doi: 10.1038/nbt.2487. [DOI] [PMC free article] [PubMed] [Google Scholar]
- 7.Lister R., Mukamel E.A., Nery J.R., Urich M., Puddifoot C.A., Johnson N.D., Lucero J., Huang Y., Dwork A.J., Schultz M.D. Global epigenomic reconfiguration during mammalian brain development. Science. 2013;341:1237905. doi: 10.1126/science.1237905. [DOI] [PMC free article] [PubMed] [Google Scholar]
- 8.Palmer L.J., Cardon L.R. Shaking the tree: mapping complex disease genes with linkage disequilibrium. Lancet. 2005;366:1223–1234. doi: 10.1016/S0140-6736(05)67485-5. [DOI] [PubMed] [Google Scholar]
- 9.Feinberg A.P., Irizarry R.A. Evolution in health and medicine Sackler colloquium: Stochastic epigenetic variation as a driving force of development, evolutionary adaptation, and disease. Proc. Natl. Acad. Sci. USA. 2010;107(Suppl 1):1757–1764. doi: 10.1073/pnas.0906183107. [DOI] [PMC free article] [PubMed] [Google Scholar]
- 10.Jaffe A.E., Feinberg A.P., Irizarry R.A., Leek J.T. Significance analysis and statistical dissection of variably methylated regions. Biostatistics. 2012;13:166–178. doi: 10.1093/biostatistics/kxr013. [DOI] [PMC free article] [PubMed] [Google Scholar]
- 11.Kerkel K., Spadola A., Yuan E., Kosek J., Jiang L., Hod E., Li K., Murty V.V., Schupf N., Vilain E. Genomic surveys by methylation-sensitive SNP analysis identify sequence-dependent allele-specific DNA methylation. Nat. Genet. 2008;40:904–908. doi: 10.1038/ng.174. [DOI] [PubMed] [Google Scholar]
- 12.Schmitz R.J., Schultz M.D., Urich M.A., Nery J.R., Pelizzola M., Libiger O., Alix A., McCosh R.B., Chen H., Schork N.J., Ecker J.R. Patterns of population epigenomic diversity. Nature. 2013;495:193–198. doi: 10.1038/nature11968. [DOI] [PMC free article] [PubMed] [Google Scholar]
- 13.Zhang D., Cheng L., Badner J.A., Chen C., Chen Q., Luo W., Craig D.W., Redman M., Gershon E.S., Liu C. Genetic control of individual differences in gene-specific methylation in human brain. Am. J. Hum. Genet. 2010;86:411–419. doi: 10.1016/j.ajhg.2010.02.005. [DOI] [PMC free article] [PubMed] [Google Scholar]
- 14.Tycko B. Allele-specific DNA methylation: beyond imprinting. Hum. Mol. Genet. 2010;19(R2):R210–R220. doi: 10.1093/hmg/ddq376. [DOI] [PMC free article] [PubMed] [Google Scholar]
- 15.Grundberg E., Meduri E., Sandling J.K., Hedman A.K., Keildson S., Buil A., Busche S., Yuan W., Nisbet J., Sekowska M., Multiple Tissue Human Expression Resource Consortium Global analysis of DNA methylation variation in adipose tissue from twins reveals links to disease-associated variants in distal regulatory elements. Am. J. Hum. Genet. 2013;93:876–890. doi: 10.1016/j.ajhg.2013.10.004. [DOI] [PMC free article] [PubMed] [Google Scholar]
- 16.Padyukov L., Seielstad M., Ong R.T., Ding B., Rönnelid J., Seddighzadeh M., Alfredsson L., Klareskog L., Epidemiological Investigation of Rheumatoid Arthritis (EIRA) study group A genome-wide association study suggests contrasting associations in ACPA-positive versus ACPA-negative rheumatoid arthritis. Ann. Rheum. Dis. 2011;70:259–265. doi: 10.1136/ard.2009.126821. [DOI] [PMC free article] [PubMed] [Google Scholar]
- 17.Pidsley R., Y Wong C.C., Volta M., Lunnon K., Mill J., Schalkwyk L.C. A data-driven approach to preprocessing Illumina 450K methylation array data. BMC Genomics. 2013;14:293. doi: 10.1186/1471-2164-14-293. [DOI] [PMC free article] [PubMed] [Google Scholar]
- 18.Shock N., Greulich R., Andres R. US Government Printing Office; Washington, DC: 1984. Normal Human Aging: The Baltimore Longitudinal Study of Aging. [Google Scholar]
- 19.Houseman E.A., Accomando W.P., Koestler D.C., Christensen B.C., Marsit C.J., Nelson H.H., Wiencke J.K., Kelsey K.T. DNA methylation arrays as surrogate measures of cell mixture distribution. BMC Bioinformatics. 2012;13:86. doi: 10.1186/1471-2105-13-86. [DOI] [PMC free article] [PubMed] [Google Scholar]
- 20.Joubert B.R., Håberg S.E., Nilsen R.M., Wang X., Vollset S.E., Murphy S.K., Huang Z., Hoyo C., Midttun O., Cupul-Uicab L.A. 450K epigenome-wide scan identifies differential DNA methylation in newborns related to maternal smoking during pregnancy. Environ. Health Perspect. 2012;120:1425–1431. doi: 10.1289/ehp.1205412. [DOI] [PMC free article] [PubMed] [Google Scholar]
- 21.Hindorff, L.A., MacArthur, J., Morales, J., Junkins, H.A., Hall, P.N., Klemm, A.K., and Manolio, T.A. A Catalog of Published Genome-Wide Association Studies. www.genome.gov/gwastudies.
- 22.Maurano M.T., Humbert R., Rynes E., Thurman R.E., Haugen E., Wang H., Reynolds A.P., Sandstrom R., Qu H., Brody J. Systematic localization of common disease-associated variation in regulatory DNA. Science. 2012;337:1190–1195. doi: 10.1126/science.1222794. [DOI] [PMC free article] [PubMed] [Google Scholar]
- 23.Gabriel S.B., Schaffner S.F., Nguyen H., Moore J.M., Roy J., Blumenstiel B., Higgins J., DeFelice M., Lochner A., Faggart M. The structure of haplotype blocks in the human genome. Science. 2002;296:2225–2229. doi: 10.1126/science.1069424. [DOI] [PubMed] [Google Scholar]
- 24.Thurman R.E., Rynes E., Humbert R., Vierstra J., Maurano M.T., Haugen E., Sheffield N.C., Stergachis A.B., Wang H., Vernot B. The accessible chromatin landscape of the human genome. Nature. 2012;489:75–82. doi: 10.1038/nature11232. [DOI] [PMC free article] [PubMed] [Google Scholar]
- 25.Price A.L., Patterson N.J., Plenge R.M., Weinblatt M.E., Shadick N.A., Reich D. Principal components analysis corrects for stratification in genome-wide association studies. Nat. Genet. 2006;38:904–909. doi: 10.1038/ng1847. [DOI] [PubMed] [Google Scholar]
- 26.Dolinoy D.C., Huang D., Jirtle R.L. Maternal nutrient supplementation counteracts bisphenol A-induced DNA hypomethylation in early development. Proc. Natl. Acad. Sci. USA. 2007;104:13056–13061. doi: 10.1073/pnas.0703739104. [DOI] [PMC free article] [PubMed] [Google Scholar]
- 27.Bollati V., Baccarelli A., Hou L., Bonzini M., Fustinoni S., Cavallo D., Byun H.M., Jiang J., Marinelli B., Pesatori A.C. Changes in DNA methylation patterns in subjects exposed to low-dose benzene. Cancer Res. 2007;67:876–880. doi: 10.1158/0008-5472.CAN-06-2995. [DOI] [PubMed] [Google Scholar]
- 28.Yauk C., Polyzos A., Rowan-Carroll A., Somers C.M., Godschalk R.W., Van Schooten F.J., Berndt M.L., Pogribny I.P., Koturbash I., Williams A. Germ-line mutations, DNA damage, and global hypermethylation in mice exposed to particulate air pollution in an urban/industrial location. Proc. Natl. Acad. Sci. USA. 2008;105:605–610. doi: 10.1073/pnas.0705896105. [DOI] [PMC free article] [PubMed] [Google Scholar]
- 29.Breitling L.P., Yang R., Korn B., Burwinkel B., Brenner H. Tobacco-smoking-related differential DNA methylation: 27K discovery and replication. Am. J. Hum. Genet. 2011;88:450–457. doi: 10.1016/j.ajhg.2011.03.003. [DOI] [PMC free article] [PubMed] [Google Scholar]
- 30.Schork A.J., Thompson W.K., Pham P., Torkamani A., Roddey J.C., Sullivan P.F., Kelsoe J.R., O’Donovan M.C., Furberg H., Schork N.J., Tobacco and Genetics Consortium. Bipolar Disorder Psychiatric Genomics Consortium. Schizophrenia Psychiatric Genomics Consortium All SNPs are not created equal: genome-wide association studies reveal a consistent pattern of enrichment among functionally annotated SNPs. PLoS Genet. 2013;9:e1003449. doi: 10.1371/journal.pgen.1003449. [DOI] [PMC free article] [PubMed] [Google Scholar]
- 31.Demirkan A., van Duijn C.M., Ugocsai P., Isaacs A., Pramstaller P.P., Liebisch G., Wilson J.F., Johansson A., Rudan I., Aulchenko Y.S., DIAGRAM Consortium. CARDIoGRAM Consortium. CHARGE Consortium. EUROSPAN consortium Genome-wide association study identifies novel loci associated with circulating phospho- and sphingolipid concentrations. PLoS Genet. 2012;8:e1002490. doi: 10.1371/journal.pgen.1002490. [DOI] [PMC free article] [PubMed] [Google Scholar]
- 32.Inouye M., Ripatti S., Kettunen J., Lyytikäinen L.P., Oksala N., Laurila P.P., Kangas A.J., Soininen P., Savolainen M.J., Viikari J. Novel Loci for metabolic networks and multi-tissue expression studies reveal genes for atherosclerosis. PLoS Genet. 2012;8:e1002907. doi: 10.1371/journal.pgen.1002907. [DOI] [PMC free article] [PubMed] [Google Scholar]
- 33.Lemaitre R.N., Tanaka T., Tang W., Manichaikul A., Foy M., Kabagambe E.K., Nettleton J.A., King I.B., Weng L.C., Bhattacharya S. Genetic loci associated with plasma phospholipid n-3 fatty acids: a meta-analysis of genome-wide association studies from the CHARGE Consortium. PLoS Genet. 2011;7:e1002193. doi: 10.1371/journal.pgen.1002193. [DOI] [PMC free article] [PubMed] [Google Scholar]
- 34.Franke A., McGovern D.P., Barrett J.C., Wang K., Radford-Smith G.L., Ahmad T., Lees C.W., Balschun T., Lee J., Roberts R. Genome-wide meta-analysis increases to 71 the number of confirmed Crohn’s disease susceptibility loci. Nat. Genet. 2010;42:1118–1125. doi: 10.1038/ng.717. [DOI] [PMC free article] [PubMed] [Google Scholar]
- 35.Liu X., Invernizzi P., Lu Y., Kosoy R., Lu Y., Bianchi I., Podda M., Xu C., Xie G., Macciardi F. Genome-wide meta-analyses identify three loci associated with primary biliary cirrhosis. Nat. Genet. 2010;42:658–660. doi: 10.1038/ng.627. [DOI] [PMC free article] [PubMed] [Google Scholar]
- 36.Verlaan D.J., Berlivet S., Hunninghake G.M., Madore A.M., Larivière M., Moussette S., Grundberg E., Kwan T., Ouimet M., Ge B. Allele-specific chromatin remodeling in the ZPBP2/GSDMB/ORMDL3 locus associated with the risk of asthma and autoimmune disease. Am. J. Hum. Genet. 2009;85:377–393. doi: 10.1016/j.ajhg.2009.08.007. [DOI] [PMC free article] [PubMed] [Google Scholar]
- 37.Leek J.T., Scharpf R.B., Bravo H.C., Simcha D., Langmead B., Johnson W.E., Geman D., Baggerly K., Irizarry R.A. Tackling the widespread and critical impact of batch effects in high-throughput data. Nat. Rev. Genet. 2010;11:733–739. doi: 10.1038/nrg2825. [DOI] [PMC free article] [PubMed] [Google Scholar]
- 38.Shoemaker R., Deng J., Wang W., Zhang K. Allele-specific methylation is prevalent and is contributed by CpG-SNPs in the human genome. Genome Res. 2010;20:883–889. doi: 10.1101/gr.104695.109. [DOI] [PMC free article] [PubMed] [Google Scholar]
- 39.Paliwal A., Temkin A.M., Kerkel K., Yale A., Yotova I., Drost N., Lax S., Nhan-Chang C.L., Powell C., Borczuk A. Comparative anatomy of chromosomal domains with imprinted and non-imprinted allele-specific DNA methylation. PLoS Genet. 2013;9:e1003622. doi: 10.1371/journal.pgen.1003622. [DOI] [PMC free article] [PubMed] [Google Scholar]
- 40.Ganesh S.K., Zakai N.A., van Rooij F.J., Soranzo N., Smith A.V., Nalls M.A., Chen M.H., Kottgen A., Glazer N.L., Dehghan A. Multiple loci influence erythrocyte phenotypes in the CHARGE Consortium. Nat. Genet. 2009;41:1191–1198. doi: 10.1038/ng.466. [DOI] [PMC free article] [PubMed] [Google Scholar]
- 41.Kamatani Y., Matsuda K., Okada Y., Kubo M., Hosono N., Daigo Y., Nakamura Y., Kamatani N. Genome-wide association study of hematological and biochemical traits in a Japanese population. Nat. Genet. 2010;42:210–215. doi: 10.1038/ng.531. [DOI] [PubMed] [Google Scholar]
- 42.Soranzo N., Spector T.D., Mangino M., Kühnel B., Rendon A., Teumer A., Willenborg C., Wright B., Chen L., Li M. A genome-wide meta-analysis identifies 22 loci associated with eight hematological parameters in the HaemGen consortium. Nat. Genet. 2009;41:1182–1190. doi: 10.1038/ng.467. [DOI] [PMC free article] [PubMed] [Google Scholar]
- 43.van der Harst P., Zhang W., Mateo Leach I., Rendon A., Verweij N., Sehmi J., Paul D.S., Elling U., Allayee H., Li X. Seventy-five genetic loci influencing the human red blood cell. Nature. 2012;492:369–375. doi: 10.1038/nature11677. [DOI] [PMC free article] [PubMed] [Google Scholar]
- 44.Bickmore W.A., van Steensel B. Genome architecture: domain organization of interphase chromosomes. Cell. 2013;152:1270–1284. doi: 10.1016/j.cell.2013.02.001. [DOI] [PubMed] [Google Scholar]
Associated Data
This section collects any data citations, data availability statements, or supplementary materials included in this article.