

Abstract
Group membership is an important aspect of our everyday behavior. Recently, we showed that existing relevant in-group labels increased activation in the medial prefrontal cortex (MPFC) compared with out-group labels, suggesting a role of the MPFC in social categorization. However, the question still remains whether this increase in MPFC activation for in-group representation is solely related with previous experience with the in-group. To test this, we randomly assigned participants to a red or blue team and in a subsequent functional magnetic resonance imaging experiment they categorized red and blue team words as belonging to either the in-group or the out-group. Results showed that even under these minimal conditions increased activation was found in the MPFC when participants indicated that they belonged to a group, as compared with when they did not. This effect was found to be associated with the level of group identification. These results confirm the role of MPFC in social categorization.
Keywords: fMRI, social categorization, group membership, social identity, social neuroscience
INTRODUCTION
From an evolutionary perspective, living in social groups is highly adaptive. Group membership provides better reproductive and protective functions as well as access to commodities, which might not have been otherwise available. Our ancestral past highlights the advantages of behavior associated with primate sociality and suggests that collective group processes have fostered the survival of our individual ability to adapt to group living (Caporael, 1997). The correlates of such an evolutionary heritage include perceptual, affective and cognitive capacities that support the development and maintenance of group membership (Brewer and Caporael, 1990). One such mental capacity which facilitates group membership is that of social categorization.
Social categorization is usually defined as the cognitive function, which allows for a simplification of perception (Allport, 1954). It is a fundamental and universal process that generates a unique perceptual distortion that limits the way information on physical and social objects are perceived (Hogg and Abrams, 1988). By imposing structure on an abundance of stimuli, social categorization creates order in a world that would otherwise appear overly complex and confusing (Wilder, 1986; Hogg and Abrams, 1988). Social categorization is also the means by which other people are categorized as members of social groups, and it is used to differentiate the in-group from the out-group (van Knippenberg and Dijksterhuis, 2000).
In a recent functional magnetic resonance imaging (fMRI) study (Morrison et al., 2012), we showed that existing relevant in-group labels increased activation in the medial prefrontal cortex (MPFC) compared with out-group labels suggesting a role of the MPFC in social categorization. The MPFC is often activated during theory of mind tasks when people have to think about the mental state of others (Decety et al., 2004; Mitchell et al., 2005; Amodio and Frith, 2006; Frith, 2007; Keysers and Gazzola, 2007) and self-referential processing (Gusnard et al., 2001; Johnson et al., 2002; Kelley et al., 2002; Mitchell et al., 2005; Northoff et al., 2006; D'Argembeau et al., 2007, 2008, 2010; Jenkins and Mitchell, 2011). Given the common activation in MPFC between the so-called ‘social self’ and ‘personal self’, it has been suggested that the increase in MPFC activation for in-groups labels (Morrison et al., 2012) and for social evaluative comparisons (Volz et al., 2009) is related to an increase in ‘personal self’ activation given that the in-group is closer to the self than the out-group (Volz et al., 2009; Morrison et al., 2012). However, it remains unclear whether the differences in neurological representations underlying in-group and out-group labels are associated with previous experience with the in-group. Given the role of the MPFC in linking previous experiences with our notion of ‘self’ (Vogeley and Fink, 2003), it could be argued that the increase in MPFC activity in our previous experiment (Morrison et al., 2012) was solely related to the additional experience participants had with the in-group given the fact that the in-group labels were chosen by the participants themselves. If the MPFC has a specific role in social categorization, the effect should also be present for groups that people have no previous experience with.
Previous research has shown that our brain responds differently to the faces of members from our own race (Cunningham et al., 2004; Ito and Bartholow, 2009), but these biases can easily by overridden by re-categorizing people into newly created groups (Van Bavel et al., 2008; Van Bavel and Cunningham, 2010). Behavioral studies in social psychology have shown that people form group distinctions even under minimal conditions and this can easily lead to inter-group bias (Tajfel et al., 1971; Tajfel and Turner, 1985; Brewer, 2007). A recent fMRI experiment (Volz et al., 2009) using a minimal group paradigm showed additional MPFC activity when people made evaluative group decisions (dividing money between the in-group versus the out-group). This suggests that these between-group categorizations and in-group biases happen quite easily and it has been suggested that these cognitive biases could result from neural models that have evolved through evolution (Tobena et al., 1999). However, the question still remains whether a difference in neural representation associated with social categorization is also present when no evaluative processes are involved. Indeed, ‘pure’ social categorization implies that this process is independent of competition for limited resources between the in-group and out-group as in the study by Volz et al. (2009). In everyday life and minimal groups, people often show a cognitive bias for the in-group even when there is no direct competition for limited resources between the two (Pinter and Greenwald, 2011). To examine whether in-group and out-group labels without previous experience are represented differently at the neural level, we randomly divided participants into two teams and let them categorize the in-group and out-group words during an fMRI experiment. Consistent with the predictions previously made for pre-existing in-group labels (Morrison et al., 2012), we predicted an increase in neural activity in the MPFC for the newly created in-group label compared with the out-group label.
METHODS
Participants
Twenty healthy volunteers (14 females, mean age = 23 years, s.d. = 4 years) completed the experiment. Participants received a reimbursement of $30 for their time. All participants gave written informed consent. The study was approved by the Behavioral & Social Sciences Ethical Review Committee of the University of Queensland.
Experiment
Team allocation
All participants were first allocated to red and blue teams. For this allocation, participants had to judge the number of (84) black dots briefly presented (1 s) on a computer screen. Similar to that in Tajfel et al. (1971), participants were told that based on their judgment they are divided into the blue and red team but contrary to Tajfel et al. (1971) no feedback (e.g. over- or under-estimation) was given to participants to explain ‘why exactly’ they were in the red or blue team. In reality, participants were randomly allocated to each team. Participants were required to wear their team’s matching colored jumper for the remainder of the session. Next, to enhance group identification via competition (Sherif et al., 1961), participants performed a team-competition task (Figure 1) in which they were told that they were competing against a member of the other team. During the task, participants had to press a response button (50 cm from the resting hand position) as quickly as possible after a ‘GO’ signal. A warning cue (get ready) was always displayed for 1 s followed by a 1, 2, or 3 s interval before the ‘GO’ cue. Participants were told that their response times would be compared with the pre-recorded response times of an opposing team member, and to give this appearance the word ‘‘checking’’ appeared after the action, followed by a feedback display indicating ‘red wins’ or ‘blue wins’. Feedback was actually pseudorandomly selected, with each participant ‘winning’ 50% of trials. If participants’ responses took longer than 500 ms, the opposing team was shown as the winner to ensure that participants remained unaware of the randomized nature of feedback when they responded too slowly. Participants completed 18 trials of this competition task over ∼5 min.
Fig. 1.

Overview of the team-competition task. Participants had to press a response button as quickly as possible after the ‘‘GO” signal. Participants were told that their response times would be compared with the prerecorded response times of an opposing team member, and to give this appearance the word ‘checking’ appeared after the action, followed by a feedback display indicating ‘red wins’ or ‘blue wins’.
After this task, group identification was assessed by presenting participants with two statements: ‘I identify myself more with members from the blue team’ and ‘I identify myself more with members from the red team’. Participants had to indicate on a 7-point Likert scale (7 = totally disagree and 1 = totally agree) how much they agreed with each statement.
fMRI experiment
During the fMRI task, the word ‘Red Team’ or ‘Blue Team’ was presented and participants had to press either the left or the right button, respectively, with their left or right hand, to indicate that they did or did not belong to this group. The group labels represented the in-group and out-group of the participants and by letting participants categorize them into ‘My Team’ or ‘Other Team’, we induced in-group and out-group social categorizations. All of the experimental stimuli appeared in a similar format: white colored text on a black background. E-prime software (Psychology Software Tools, Inc.) was used to run the task on a PC.
The ‘Red Team’ or ‘Blue Team’ word was presented randomly for 3 s at the center of the screen together with the category labels: ‘MT’ and ‘OT’ at the top of the screen (Figure 2). MT indicated ‘My Team’ and OT indicated ‘Other Team’. Half the time, MT was on the left and OT was on the right and vice versa. A fixation point followed each display and remained on the screen for 1 s. A null event was also presented to participants during which the fixation point remained on the screen for an additional 4 s. The null event was used as a low-level baseline to contrast the conditions against in the fMRI analysis. The entire task was conducted in five repeated fMRI runs. Each run consisted of 14 trials per condition and thus there were a total of 90 trials per condition across the 5 runs. A high resolution structural MRI scan was conducted after the third run.
Fig. 2.

Schematic representation of a section of the experimental task. Participants had to categorize Red Team and Blue Team words as My Team (MT) and Other Team (OT) by pressing a left or right button to indicate the side of the matching stimulus. Each slide was presented for 3 s followed by a 1 s fixation point. During the baseline, the fixation point remained on the screen for 4 s.
fMRI image acquisition
A 3-Tesla Siemens MRI scanner with 32-channel head volume coil was used to obtain the data. Functional images were acquired using gradient-echo planar imaging (EPI) with the following parameters: repetition time 3s, echo time (TE) 30 ms, flip angle (FA) 90°, 64 × 64 voxels at 3 × 3 in-plane resolution. Whole brain images were acquired every 3s. The first two TR periods from each functional run were removed to allow for steady-state tissue magnetization. T1-weighted image covering the entire brain was also acquired after the third run and used for anatomical reference (TR = 1900, TE = 2.32 ms, FA = 9°, 192 cubic matrix, voxel size = 0.9 mm3, slice thickness = 0.9 mm).
fMRI analysis
SPM8 software (Wellcome Department of Imaging Neuroscience, Institute of Neurology, London) run through Matlab (Mathworks Inc., USA) was used to analyse the data. To counter any head-movements, all the EPI images were realigned to the first scan of each run. The anatomical image was then co-registered to the mean functional image. To correct for variation in brain size and anatomy between participants, each structural scan was normalized to the MNI T1 standard template (Montreal Neuropsychological Institute, Montreal, Canada) using segmentation. Spatial normalization of all the EPI images was then conducted, using a standard stereotaxic space with a voxel size of 3 × 3 × 3 mm. This process mathematically transformed each participant’s brain image to match the template so that any chosen brain region should refer to the same region across all participants. Before further analysis, all images were smoothed with an isotropic Gaussian kernel of 6 mm. As part of the first level of analysis, a general linear model was created for each participant. For each participant, in each of the two conditions (MT, OT), an event-related design identified the regions with significant BOLD changes in each voxel. The events were modeled by a canonical hemodynamic response function (with time derivative) time-locked to the onset of each trial. The BOLD changes in each of the two conditions were compared with the baseline. To remove any potentially confounding effects of reaction time and accuracy, we modeled them as parametric modulations in our fMRI design. In the second level of analysis, contrast images for each condition minus baseline across all participants were included in the design. Follow-up t-tests were created for each research hypothesis to determine whether the differences in brain activation between conditions were significant. A cluster-level threshold with a familywise error (FWE) rate of P <0.05, was used to define significant activation for all contrast analyses, and a voxel-level probability threshold of P <0.001 was used to define each cluster. To further investigate whether the level of in-group identification was associated with increased activity in the MPFC, we performed an additional regression analysis in SPM for the ‘Own Team’ minus ‘Other Team’ contrast. We calculated a difference score between other team minus own team group identification (positive scores mean more in-group identification) for each individual and used these ‘in-group identification’ scores as a covariate in the regression analysis. For this analysis, a region of interest (ROI) approach was used and the ROI was defined by a 3 mm radius around the peak coordinate defined in the ‘Own Team’ minus ‘Other Team’ contrast. The ROI was created using the WFU PickAtlas (http://www.fmri.wfubmc.edu/cms/software). Significant activity for the regression analysis was defined by a voxel-level threshold with a FWE of P <0.05 corrected for the size of the cluster.
RESULTS
Group identification
A paired samples t-test revealed that participants reported that they identified more with their own team (M = 2.00, s.d. = 1.12) compared to the other team (M = 5.70, s.d. = 1.08), t(19) = 7.86, P <0.001.
Reaction time
A paired samples t-test revealed no difference in reaction time between MT (M = 1018 ms, s.d. = 162) and OT (M = 1007 ms, s.d. = 162) conditions, t(19) = 1.00, P = 0.33.
Accuracy
A paired samples t-test revealed no difference in accuracy between MT (M = 96.5%, s.d. = 3.9) and OT (M = 96.3%, s.d. = 4.7) conditions, t(19) = 0.14, P = 0.89.
fMRI results
First, we compared the ‘My Team’ condition minus the ‘Other Team’ condition. This contrast revealed increased activity in the MPFC (−9, 41, 25, Z = 4.12, extent 132, P corrected = 0.001, Figure 3). No other significant regions were found for ‘My Team’ minus ‘Other Team’. The reverse contrast did not reveal any significant difference in brain activation. The regression analysis with ‘My Team’ minus ‘Other Team’ contrasts revealed a significant positive correlation between the in-group identification scores and activity in the MPFC (−9, 44, 28, Z = 2.30, P corrected = 0.027).
Fig. 3.
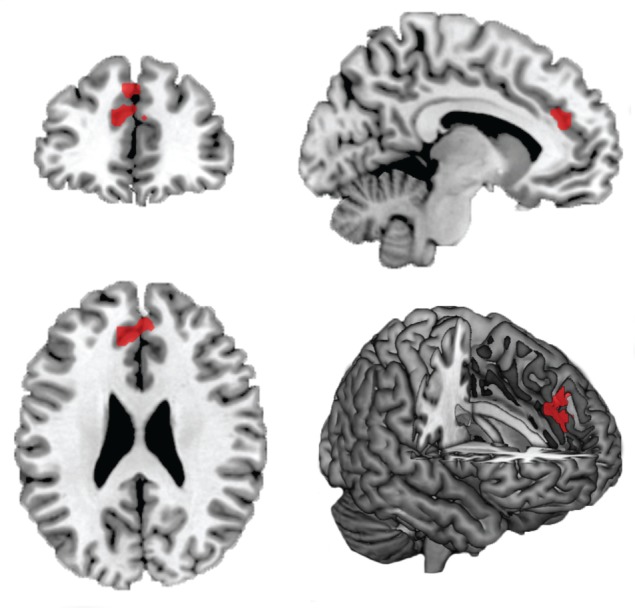
Significant MPFC brain activation in the ‘My Team’ (MT) minus ‘Other Team’ (OT) contrast. Activations (thresholded at P <0.001 uncorrected) are displayed on a ch2better.nii.gz template using MRIcroN.
DISCUSSION
Our results show that even under these minimal conditions in-group labels, as opposed to out-group labels, showed an increase in MPFC activity and that the activation was related to group identification. The MPFC region associated with the newly created in-group label in this study was located more dorsal than the ventral MPFC which we previously identified for existing in-group words (Morrison et al., 2012). On the other hand, the region corresponds very well with the dorsal MPFC activation Volz et al. (2009) found for evaluative intergroup comparisons when using a similar minimal group paradigm. This is an interesting observation because the ventral part of the MPFC has been implicated in emotional social reasoning while the more dorsal part has been implicated in abstract social reasoning (Blair, 2005; Saxe, 2006; Frith, 2007; Van Overwalle, 2009; Volz et al., 2009). Compared with long-standing, previously existing in-groups, newly created arbitrary in-groups, lack the rich emotional valence that develops over a long period of time. Therefore, it is no surprise they these more abstract representations of the in-group are represented in a more dorsal part of the MPFC compared with previously established, meaningful group memberships. Similarly, the previously identified ventral MPFC region in our previous study (Morrison et al., 2012) was closer to the ventral MPFC typically associated with the notion of ‘self’ in a meta-analysis on this topic (Northoff et al., 2006) than the region we found in this study. Again this is no surprise, given the fact that existing meaningful in-group labels are more important to the ‘self’ than new and arbitrary in-group labels.
Because in-groups labels lead to increased activity in MPFC compared with out-group labels, intergroup bias could in part stem from the neural organization and storage of social categories in the brain. Given the common activation of the MPFC by tasks associated with the ‘personal’ and the ‘social self’ (Volz et al., 2009), other in-group members are more likely to be perceived as similar to the self, and associated with positive affect through social identity processes (Tajfel and Turner, 1985; Volz et al., 2009). It is unlikely however that a single region is involved in all aspects of the ‘personal’ and ‘social self’ and how well these two representations and their different aspects overlap remains to be investigated. The fact that these increases in neural representation already exist for newly created arbitrary in-group labels suggests that social group categorizations happen quite easily, especially when in-group identification is high. The fact that we used competition between in-group and out-group to increase group identification probably only strengthened this effect (Sherif et al., 1961). Given the benefits associated with group membership, such difference in neural processing could be a result of evolution, in which our brains have developed to perceive the in-group and out-group differently (Hastorf and Cantril, 1954; Brewer and Caporael, 1990; Tobena et al., 1999; von Hippel and Trivers, 2011). Note that we do not argue that a single region (i.e. MPFC) is responsible for this biased representation. For example, previous fMRI studies have shown that we perceive faces (Van Bavel et al., 2011) in the fusiform face area and actions (Molenberghs et al., 2013) in the inferior parietal lobule of newly created in-group members in a biased way compared with out-group members. Our research in social categorization complements, previous work, showing that a more ventral aspect of the MPFC is involved in social categorization in existing groups (Morrison et al., 2012), whereas this study (along with the findings from Volz et al., 2009) points to a more dorsal aspect of the MPFC, which is engaged for newly created groups. Together these studies show that social categorization of the world into ‘us’ versus ‘them’ is underpinned by differences in neural representation, which could result in a biased representation of in-group and out-group members.
Acknowledgments
This work was supported by a UQ Early Career Research Grant and ARC Discovery Project Grant awarded to P.M. P.M. was supported by a UQ Postdoctoral Fellowship and ARC Discovery Early Career Research Award.
REFERENCES
- Allport GW. The Nature of Prejudice. Boston, MA: Addison-Wesley; 1954. [Google Scholar]
- Amodio DM, Frith CD. Meeting of minds: the medial frontal cortex and social cognition. Nat Rev Neurosci. 2006;7:268–77. doi: 10.1038/nrn1884. [DOI] [PubMed] [Google Scholar]
- Blair RJR. Responding to the emotions of others: dissociating forms of empathy through the study of typical and psychiatric populations. Conscious Cogn. 2005;14:698–718. doi: 10.1016/j.concog.2005.06.004. [DOI] [PubMed] [Google Scholar]
- Brewer MB. The importance of being “We”: human nature and intergroup relations. Am Psychol. 2007;62:728–38. doi: 10.1037/0003-066X.62.8.728. [DOI] [PubMed] [Google Scholar]
- Brewer MB, Caporael LR. Selfish genes vs. selfish people: sociobiology as origin myth. Motivation Emotion. 1990;14:237–43. [Google Scholar]
- Caporael LR. The evolution of truly social cognition: the core configurations model. Personality Social Psychol Rev. 1997;1:276–98. doi: 10.1207/s15327957pspr0104_1. [DOI] [PubMed] [Google Scholar]
- Cunningham WA, Johnson MK, Raye CL, Gatenby JC, Gore JC, Banaji MR. Separable neural components in the processing of black and white faces. Psychol Sci. 2004;15:806–13. doi: 10.1111/j.0956-7976.2004.00760.x. [DOI] [PubMed] [Google Scholar]
- D'Argembeau A, Feyers D, Majerus S, et al. Self-reflection across time: cortical midline structures differentiate between present and past selves. Social Cogn Affective Neurosci. 2008;3:244–52. doi: 10.1093/scan/nsn020. [DOI] [PMC free article] [PubMed] [Google Scholar]
- D'Argembeau A, Ruby P, Collette F, et al. Distinct regions of the medial prefrontal cortex are associated with self-referential processing and perspective taking. J Cogn Neurosci. 2007;19:935–44. doi: 10.1162/jocn.2007.19.6.935. [DOI] [PubMed] [Google Scholar]
- D'Argembeau A, Stawarczyk D, Majerus S, Collette F, Van der Linden M, Salmon E. Modulation of medial prefrontal and inferior parietal cortices when thinking about past, present, and future selves. Social Neurosci. 2010;5:187–200. doi: 10.1080/17470910903233562. [DOI] [PubMed] [Google Scholar]
- Decety J, Jackson PL, Sommerville JA, Chaminade T, Meltzoff AN. The neural bases of cooperation and competition: an fMRI investigation. Neuroimage. 2004;23:744–51. doi: 10.1016/j.neuroimage.2004.05.025. [DOI] [PMC free article] [PubMed] [Google Scholar]
- Frith CD. The social brain? Philos Trans Royal Soc B: Biol Sci. 2007;362:671–8. doi: 10.1098/rstb.2006.2003. [DOI] [PMC free article] [PubMed] [Google Scholar]
- Gusnard DA, Akbudak E, Shulman GL, Raichle ME. Medial prefrontal cortex and self-referential mental activity: relation to a default mode of brain function. Proc Natl Acad Sci U S A. 2001;98:4259–64. doi: 10.1073/pnas.071043098. [DOI] [PMC free article] [PubMed] [Google Scholar]
- Hastorf AH, Cantril H. They saw a game: a case study. J Abnormal Social Psychol. 1954;49:129–34. doi: 10.1037/h0057880. [DOI] [PubMed] [Google Scholar]
- Hogg MA, Abrams D. Social Identifications: A Social Psychology of Intergroup Relations and Group Processes. London, UK: Routledge; 1988. [Google Scholar]
- Ito TA, Bartholow BD. The neural correlates of race. Trends Cogn Sci. 2009;13:524–31. doi: 10.1016/j.tics.2009.10.002. [DOI] [PMC free article] [PubMed] [Google Scholar]
- Jenkins AC, Mitchell JP. Medial prefrontal cortex subserves diverse forms of self-reflection. Social Neurosci. 2011;6:211–18. doi: 10.1080/17470919.2010.507948. [DOI] [PubMed] [Google Scholar]
- Johnson SC, Baxter LC, Wilder LS, Pipe JG, Heiserman JE, Prigatano GP. Neural correlates of self-reflection. Brain. 2002;125:1808–14. doi: 10.1093/brain/awf181. [DOI] [PubMed] [Google Scholar]
- Kelley WM, Macrae CN, Wyland CL, Caglar S, Inati S, Heatherton TF. Finding the self? An event-related fMRI study. J Cogn Neurosci. 2002;14:785–94. doi: 10.1162/08989290260138672. [DOI] [PubMed] [Google Scholar]
- Keysers C, Gazzola V. Integrating simulation and theory of mind: from self to social cognition. Trends Cogn Sci. 2007;11:194–6. doi: 10.1016/j.tics.2007.02.002. [DOI] [PubMed] [Google Scholar]
- Mitchell JP, Banaji MR, Macrae CN. The link between social cognition and self-referential thought in the medial prefrontal cortex. J Cogn Neurosci. 2005;17:1306–15. doi: 10.1162/0898929055002418. [DOI] [PubMed] [Google Scholar]
- Molenberghs P, Halász V, Mattingley JB, Vanman E, Cunnington R. Seeing is believing: neural mechanisms of action perception are biased by team membership. Hum Brain Mapp. 2013;34(9):2055–68. doi: 10.1002/hbm.22044. [DOI] [PMC free article] [PubMed] [Google Scholar]
- Morrison S, Decety J, Molenberghs P. The neuroscience of group membership. Neuropsychologia. 2012;50:2114–20. doi: 10.1016/j.neuropsychologia.2012.05.014. [DOI] [PubMed] [Google Scholar]
- Northoff G, Heinzel A, de Greck M, Bennpohl F, Dobrowolny H, Panksepp J. Self-referential processing in our brain—a meta-analysis of imaging studies on the self. Neuroimage. 2006;31:440–57. doi: 10.1016/j.neuroimage.2005.12.002. [DOI] [PubMed] [Google Scholar]
- Pinter B, Greenwald AG. A comparison of minimal group induction procedures. Group Process Intergroup Relations. 2011;14:81–98. [Google Scholar]
- Saxe R. Uniquely human social cognition. Curr Opin Neurobiol. 2006;16:235–9. doi: 10.1016/j.conb.2006.03.001. [DOI] [PubMed] [Google Scholar]
- Sherif M, Harvey OJ, White BJ, Hood WR, Sherif CW. Intergroup Conflict and Cooperation: The Robbers Cave Experiment. Norman, OK: University of Oklahoma Press; 1961. [Google Scholar]
- Tajfel H, Billig MG, Bundy RP, Flament C. Social categorization and intergroup behavior. Eur J Social Psychol. 1971;1:149–77. [Google Scholar]
- Tajfel H, Turner JC. Social identity theory and intergroup behaviour. In: Worchel S, Austin WG, editors. Psychology of Intergroup Relations. Chicago, IL: Nelson-Hall; 1985. pp. 7–24. [Google Scholar]
- Tobena A, Marks I, Dar R. Advantages of bias and prejudice: an exploration of their neurocognitive templates. Neurosci Biobehav Rev. 1999;23:1047–58. doi: 10.1016/s0149-7634(99)00036-6. [DOI] [PubMed] [Google Scholar]
- Van Bavel JJ, Cunningham WA. A social neuroscience approach to self and social categorisation: a new look at an old issue. Eur Rev Social Psychol. 2010;21:237–84. [Google Scholar]
- Van Bavel JJ, Packer DJ, Cunningham WA. The neural substrates of in-group bias: a functional magnetic resonance imaging investigation. Psychol Sci. 2008;19:1131–9. doi: 10.1111/j.1467-9280.2008.02214.x. [DOI] [PubMed] [Google Scholar]
- Van Bavel JJ, Packer DJ, Cunningham WA. Modulation of the fusiform face area following minimal exposure to motivationally relevant faces: evidence of in-group enhancement (not out-group disregard) J Cogn Neurosci. 2011;23:3343–54. doi: 10.1162/jocn_a_00016. [DOI] [PubMed] [Google Scholar]
- van Knippenberg AF, Dijksterhuis A. Social categorization and stereotyping: a functional perspective. Eur Rev Social Psychol. 2000;11:105–44. [Google Scholar]
- Van Overwalle F. Social cognition and the brain: a meta-analysis. Hum Brain Mapp. 2009;30:829–58. doi: 10.1002/hbm.20547. [DOI] [PMC free article] [PubMed] [Google Scholar]
- Vogeley K, Fink GR. Neural correlates of the first-person-perspective. Trends Cogn Sci. 2003;7:38–42. doi: 10.1016/s1364-6613(02)00003-7. [DOI] [PubMed] [Google Scholar]
- Volz KG, Kessler T, von Cramon DY. In-group as part of the self: in-group favoritism is mediated by medial prefrontal cortex activation. Social Neurosci. 2009;4:244–60. doi: 10.1080/17470910802553565. [DOI] [PubMed] [Google Scholar]
- von Hippel W, Trivers R. The evolution and psychology of self-deception. Behav Brain Sci. 2011;34:1–16. doi: 10.1017/S0140525X10001354. [DOI] [PubMed] [Google Scholar]
- Wilder DA. Social categorization: implications for creation and reduction of intergroup conflicts. In: Berkowitz L, editor. Advances in Experimental Social Psychology. San Diego, CA: Academic Press; 1986. pp. 293–355. [Google Scholar]