

Abstract
The neutral theory of molecular evolution (Kimura 1985) is the basis for most current statistical tests for detecting selection, mainly using polymorphism data within species, divergence data between species, and/or genomic structures like linkage disequilibrium (Wang et al. 2006). In most cases informative tests can only be constructed with ample variations within these parameters and many common tests are difficult to formulate when identity-by-descent is not clear, for example in gene families or repetitive elements. With the current progress being made toward whole-genome sequencing and re-sequencing efforts, as well as protein sequencing via tandem mass spectrometry where genomic sequencing is lacking, we felt it was necessary to re-visit possible methods for rapid screening and detection of evolutionary outliers. These outliers might be of interest for other research, such as candidate gene association studies or genome annotations, drug- and disease-target searches, and functional studies. We focused on methods that would work on both protein and nucleotide data, could be used on large gene or protein domain families, and could be generated quickly in order for “first pass” annotation of large scale data. For these reasons, we chose properties of trees generated routinely in molecular phylogenetic studies; genetic distance, tree shape and balance, and internal node statistics (Heard 1992). Our current research looking at protein domain family data and phylogenetic trees from PFAM (Finn et al. 2008) suggests this approach towards detecting evolutionary outliers is feasible, but additional work will be necessary to determine the parameters that suggest either positive or negative selection is occurring in specific gene families. This is particularly true when other factors such as rapid duplication and deletion of genes containing these domains is taking place, and we suggest phylogenetic statistics may be useful in combination with existing methodologies for detailed studies of gene family data.
Keywords: Phylogenetics, Selection, Evolution, Adaptation
Background
As different gene regions have different functional significance, different modes of evolution will simultaneously occur within the same gene, which makes positive selection very difficult to detect at the whole gene level. Thus to be able to detect positive selection more effectively, we need to divide genes into functionally independent segments. Protein domains are natural candidate for this kind of analysis: they are functionally important, they are distributed across different genes, and domains of specific functionality are widely believed to have a common evolutionary origin (Sleator 2010). In addition, they are widely seen as evolutionarily conservative, and multiple mutations at the same locus are less likely which makes selective inference more reliable; that is to say, point mutations are likely to have shared evolutionary origins(Tokuriki and Tawfik 2009). We hypothesized that the positively selected members in the domain families will display altered phylogenetic patterns compared with other members. It is this pattern, in part, which we will utilize for the detection of outliers and the development of rapid, large-scale annotation methods. There have been continuous studies in phylogenetic tree shape in the areas of macroevolution and biogeography (Gould et al. 1977; Raup et al. 1973; Rosen 1978; Schopf 1979; Simberloff 1987), but the employment of phylogenetic trees as a primary mechanism for detecting positive selection at molecular level requires further development(Delport et al. 2009). While many methodologies utilize phylogenetics to develop and help test models of selection, such as relative rates tests (Ricklefs 2007) and models using Bayesian parameters (Huelsenbeck et al. 2008), we decided to examine tree topology as a method for the statistical detection of positive selection. There were three primary rationales behind this approach. First, this approach differs from many others in that it can be performed using solely protein data, and this type of information is becoming more common as researchers utilize procedures such as tandem mass spectrometry to obtain protein sequences from divergent organisms with no genomic sequences available. Secondly, this approach differs from many others in that it can work on any tree regardless of how that tree was constructed. We are attempting to construct a model that allows for the analysis of selection looking at tree shape; while this in practice will differ depending upon the methodology used to construct a tree, in principle the test should be simple enough to utilize on multiple trees allowing for its application to a large number of possible phylogenies constructed from a set of data. Lastly, we believed this format of analysis is under-represented within the literature (for example see (San Mauro and Agorreta 2010) for a review), and therefore study is warranted to determine the feasibility of the method. The overall goal is to develop a rapid methodology for first-pass analysis of large-scale genome data where repetitive elements, duplicated genes, and protein domains are present in abundance. We focus on distance, tree balance, and internal node statistics as the phylogenetic parameters for our first analysis into the feasibility of developing this test for the detection of evolutionary outliers, and examine data and phylogenies available from PFAM (Finn et al. 2008).
Methodology and outcomes
Protein distance
The amount of variation of amino acids in a protein sequence is determined by the intensity of purifying selection or functional constraint, which is determined in part by the degree of the intolerance of the site toward mutations. This defines the range of amino acids that are acceptable without influencing the carrier's fitness. Under the assumption that all the members of a domain family originated from a common ancestor by gene duplication (Aravind et al. 2006; Breitling and Gerber 2000; Hughes 2005; Orgel 1977; Schmidt and Davies 2007; Van de Peer et al. 2001), under neutral evolution all the domain family members should be under the same functional constraint. Thus, substitutions of amino acids between members should be purely by chance (Guo et al. 2004), and the pairwise distances between family members are expected to follow a normal distribution (Lehmann and Casella 1998) given observed distributions of protein members within a family (Harrison and Gerstein 2002) and assuming that duplication within a protein family is more common than removal of a copy from a protein family or pseudogene formation(Harrison and Gerstein 2002). This seems a likely result over a protein family, and possibly within specific eukaryote genomes (Gu et al. 2002; Rubin et al. 2000). Even if some family members have such a large divergence of function that change the functional constraint of some members, the normal distribution should still be approximately followed considering the stochastic nature of these types of events (Gu 1999; Shakhnovich and Koonin 2006), and evidence for this exists in empirical observations of protein evolution and protein family evolution (Colless 1995; Huang and Peng 2005; Kishino et al. 1990).
We examined the distribution of five random protein families extracted from PFAM database (Finn et al. 2008) utilizing the Shapiro–Wilk test (Shapiro and Wilk 1965), in order to see if a normal distribution was common among large protein domain families. The test statistic is described as the following:
where x(i) is the ith order statistic; is the sample mean; the constant ai is defined as
where m = (m1, …, mn)T, and m1, …, mn are the expected values of the order statistics of random variables, which are from independent and identical standard normal distributions, and V is the variance–covariance matrix of the order statistics. A sufficiently small W can be used to reject the null hypothesis of the data following a normal distribution.
This test is applied with the all the possible pair-wise distances of the members of five random protein families with family size larger than 25, and the results are listed in Table 1.
Table 1.
Test of normality of the pair-wise distances between family members
| Family name | PFAM ID | Pairs | Skewness | Kurtosis | W statistic | P-value |
|---|---|---|---|---|---|---|
| 4HBT | PF03061 | 528 | 1.8366 | 2.1634 | 0.6799 | <2.2e-16 |
| 4_1_CTD | PF05902 | 325 | −0.2848 | −1.2789 | 0.8722 | 9.05e-16 |
| DAGK_cat | PF00781 | 861 | 3.3426 | 16.9711 | 0.6858 | <2.2e-16 |
| 2OG-FeII_Oxy | PF03171 | 780 | 1.7324 | 1.7471 | 0.6871 | <2.2e-16 |
| A1 pp | PF01661 | 406 | −0.5717 | 0.4126 | 0.9422 | 1.778e-11 |
The P-values for all the tests are highly significant and thus the null hypothesis can be rejected with high confidence. The conclusion is that a noticeable proportion of protein members within families are not under our null model of evolution, where drift is a predominant mode of evolution, and negative selection is presumed to be common within families based on the high deviation from the expected normal distribution.
Based on these results from random five gene families, we further hypothesized that a significant portion of gene families among the present known gene families are evolving under large amounts of selection, both positive and negative. This hypothesis can be tested simply using the central limit theory in statistics (Lehmann and Casella 1998). The theory states that given a distribution with a mean μ and variance σ2, the sampling distribution of the mean approaches a normal distribution with a mean (μ) and a variance σ2/N as N, the sample size, increases. The generality of the theory is that regardless of the original distribution, the sampling distribution of the mean approaches a normal distribution. Furthermore, most distributions will quickly converge to a normal distribution as N increases. This theory can be used to model the family distances under the assumption that the gene families are independent and they are under neutral evolution; that is predominantly evolving as a result of drift and negative selection. Under neutral evolution, the average family distance for each family should be mainly determined by the mutation rate. Although there should be some heterogeneity in mutation rates of different gene families, considering the random nature of the sampling and random nature of the mutations, the distribution of the average family distances should not be significantly deviated from normal distribution, or at least the distribution should be symmetric if not in complete normal distribution (again, because of the assertions of the central limit theory). We examined this hypothesis with 100 protein domain families extracted from the PFAM database. The members in human genes were extracted and aligned with the pileup program in GCG package (GCG 1999), and the distances between each pair of sequences were calculated with the distances program (corrected for multiple hits). Thus for a family with n members of human genes, distances (D's) will be generated. We sampled 100 protein families with at least 25 members of human genes and calculated the pair-wise distances for human members in each family i (i = 1…100), and for each family we calculated the average distance with the following formula:
If the changes are completely random, it is expected that the will be following a normal distribution according to the central limit theory. We obtained a distribution as shown in Fig. 1.
Fig. 1.

The distribution of average family distance (d) in 100 gene families, illustrating a long right tail; as discussed in the text, the distribution has high skewness and kurtosis. This illustrates the data deviates from a normal distribution, and this is further illustrated in Fig. 2
The normality of the distribution was tested with four different statistics (Table 2) and a Quantile–Quantile (Q–Q) plot (Fig. 2). The normality of the distribution of the average family distances is significantly rejected by all of the various statistical tests. Two interesting parameters about the distribution are kurtosis and skewness. Skewness is a measure of symmetry, or more precisely, the lack of symmetry. Kurtosis is a measure of whether the data are peaked or flat relative to a normal distribution, thus it is also an indicator of the variability of the data comparing to that of a normal distribution. The kurtosis and skewness of the distribution are 0.84 and 0.99, respectively. Both the kurtosis and skewness for a standard normal distribution are 0. Thus the distribution has a larger skewness and kurtosis for this sample size than that of a normal distribution.
Table 2.
Statistical tests of normality of the distribution of average distances of 100 gene families
| Test | Statistic | P-value |
|---|---|---|
| Shapiro–Wilk W | 0.923649 | Pr < W < 0.0001 |
| Kolmogorov–Smirnov D | 0.152678 | Pr > D < 0.0100 |
| Cramer-von Mises W-Sq | 0.477567 | Pr > W-Sq < 0.0050 |
| Anderson–Darling A-Sq | 2.572776 | Pr > A-Sq < 0.0050 |
Fig. 2.
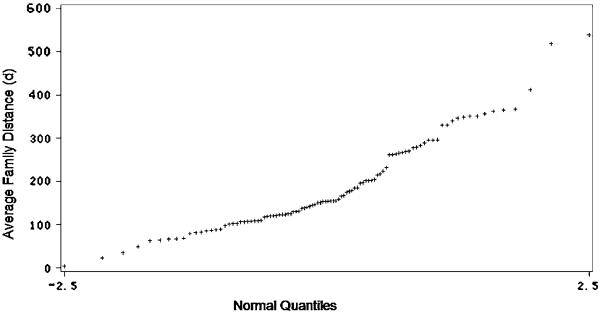
A quantile–quantile (Q–Q) plot of the average distance (d) of 100 gene families. This is an alternative way of visualizing the skew and kurtosis discussed in the text. This suggests that large amounts of selection have been at work in shaping the evolution of nearly all gene families examined in this paper
Based on the above statistical results, we can infer that many gene families have highly deviated average family distances, thus disrupting the normal distribution expected if drift predominates. A positive skewness means the right tail is longer; the mass of the distribution is concentrated on the left of the distribution. Thus more members than expected have larger average family distances, and this is a sign that some domain families are evolving under the effects of positive selection, as positive selection is a promising systematic candidate to diverge family members from each other thus increase the average family distances. Higher kurtosis indicates more than expected variance is due to infrequent, extreme deviations. This is also an indicator of the occurrences of the extreme deviations. Thus by combining these two parameters, we can predict that the members in the right tail of the normal distribution have a higher probability of being under positive selection than those on the left tail of the distribution or in the central mass of the distribution, and thus may be more functionally important gene families.
It is worth noting that this initial assumption is subject to a number of different caveats, and we are not, in this present study, attempting to assert that positive selection is the only factor that could cause right-skewing of the distribution. If mutation rates do not remain consistent across a protein domain family, this could cause the distribution to become skewed (in either direction, depending upon the nature of the mutation rate changes). While it is beyond the scope of the present work, we argue that numerous rate tests (Kreitman 1996; Zeng et al. 1998) and maximum likelihood analysis (Yang 1997) could determine if underlying mutation rates are likely to be consistent across a specific protein family. Thus, we could utilize a combination of approaches to determine if positive- or negative-selection were indeed a likely candidate for causing a particular domain family to be skewed relative to the observed distribution of families. It is also true that specific changes in function among the members of a particular lineage in a protein family could also cause skew; that is, if some members of a domain family underwent neo-functionalization, this may cause them to diverge more rapidly away from other members within that family. While this is a fair criticism of our ability specifically to detect positive selection among right-skewed families, we believe it shows the potential utility of this approach toward finding gene families for further study. Functional shifts among lineages in domain families may not be the result of positive selection, but the effects may be adaptive and therefore detection of such events would be a good outcome for the test application.
Internal node calculation
The nodes in a phylogenetic tree normally represent speciation events (Graur and Li 2000). In the phylogenetic tree of gene families, the nodes can be regarded as duplication events. We can consider each of these internal nodes on the tree of an extant protein domain family to be a duplication event that persisted, and therefore a tree with more nodes has had more duplication events. In addition, if the newly generated members have not been under selection because of the functional needs of the organism in which they arise, they will survive randomly in the genome. We were interested in determining if we could utilize the average number of nodes between two members of a phylogenetic tree representing a gene family as a proxy for the degree of divergence between those family members.
One of the commonly used distributions in statistics to model the number of events occurring in a fixed period of time is the Poisson distribution. This holds assuming these events occur with a known average rate, and are independent of the time since the last event (Good 1986). Under a null model of evolution where drift predominates, the number of duplication events should be modeled satisfactorily with this distribution.
To examine the distribution of nodes, we looked at 100 gene families as above. The counting of internal nodes for each extant family member was performed with a Perl script which is available upon request. Fit to a Poisson distribution was checked for the 100 gene families by comparing the equality of mean and variance, and none of the families followed a Poisson distribution. This suggests that selection is acting on the birth and death of internal nodes. When only the stochastic property of the duplication events was considered, we can expect the number of internal nodes each extant family member traverses to follow a normal distribution. Again, the test results show that the internal node numbers are not in normal distribution for the 100 different domain families.
Although there is no existing distribution to model the internal nodes of each family member, we can hypothesize that the distance between any two family members are not independent with the number of nodes between them based on the generality of the neutral evolution. This hypothesis was tested by correlation analysis and regression analysis between the distance as independent variable and in-between node number as regressor for five families. The results are shown in Table 3.
Table 3.
Regression and correlation analysis between node number and distance
| Family name | PFAM ID | Correlation | Regre. Coeff. | Adjusted R2 | P-value |
|---|---|---|---|---|---|
| 4HBT | PF03061 | 0.6841 | 40.0695 | 0.4670 | 4.10723e-4 |
| 4_1_CTD | PF05902 | 0.6822 | 4.0069 | 0.4638 | 7.63462e-e |
| DAGK_cat | PF00781 | 0.5832 | 25.0035 | 0.4767 | 5.63462e-3 |
| 2OG-FeII_Oxy | PF03171 | 0.4048 | 32.0767 | 0.1628 | 4.1512e-8 |
| A1 pp | PF01661 | 0.6123 | 16.8263 | 0.3734 | 3.86881e-4 |
For all of the five gene families, we find a significant dependency between the number of intervening nodes and the genetic distance for a pair of members in the same family. With these empirical results, we can utilize the number of nodes on the path from one member of the family to the root as a proxy for the relative age of the family member. To put this more succinctly, a larger number of internal nodes indicates a younger family member, as more duplication events are posited. Although the calculation of protein distances has taken the effects of multiple substitutions into consideration, we analyzed the relationship between recent amino acid changes and the age of the members to make the result more reliable. We randomly chose five hundred members from the C2H2 zinc finger gene family, and analyzed these domains for this purpose. Zinc finger proteins were chosen as this is a large family, pervasive in most eukaryote genomes, with numerous functions and a high degree of conservation (Berg 1990; Laity et al. 2001). The node numbers were plotted against the amino acid changes at the terminal branch for each of the 500 hundred members (Fig. 3).
Fig. 3.
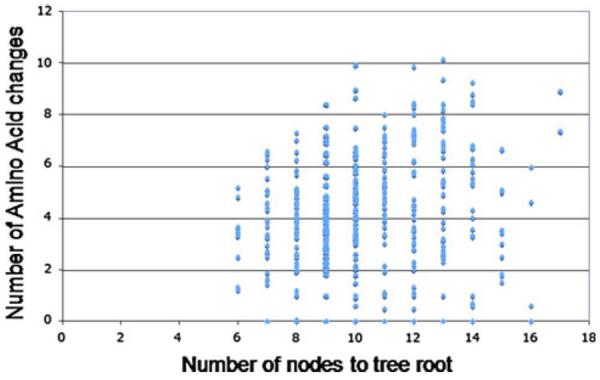
Plot of terminal-branch amino acid changes against the internal node number as described in the text. The internal node number is, for each gene family examined, a proxy for the age of the gene; the more internal nodes, the more divergence events and therefore the older the gene, on average. The number of amino acid changes tracks the number of changes from the preceding node to the gene within the family. This plot is showing, therefore, the approximate age of a gene or domain within a family versus the amount of evolutionary change in that domain
We were interested in determining if we can utilize the internal node number within a tree as a gauge for determining how much amino acid change we would expect to see among members of the gene family. We defined the members with internal node number equal or larger than 15 as “young” members, between 8 and 14 as “middle aged”, and with node numbers of equal or smaller than 7 as “old”. There are no significant location differences for middle-aged members. Middle-aged family members have larger variances of amino acid changes than the young or old members; that is, young and old members are more homogenous relative to each other than are median members.
Utilizing this information, we can consider node number as a potential variable when trying to determine which specific members of a gene or protein domain family are worthwhile to analyze from a functional standpoint. That is, we can perhaps utilize this type of information to direct bench work at proteins or genes that are more likely to have divergent or preserved functions relative to the entire collection of members within that family. We can allow middle-aged members to serve as a “ruler” for the amount of variability or functional constraint among members of a specific family, taking the average of the “middle aged” members as a guide. Young members with a significantly larger number of amino acid changes than this “median” value, or old members with significantly smaller number of amino acid changes compared to this median value are more likely to be functionally important; that is, to have more divergent function compared to the mass of the gene family. We propose that this pattern may allow for the identification of gene or protein domain families that have functions worth investigating at the bench. However, this tool has relatively little power, as it is not able to detect interesting members of the family that are “middle aged”. We are undertaking a more thorough analysis of gene families at this time to refine the statistical methodology necessary to define proteins that have aberrant divergence patterns within protein and gene family phylogenies. Ultimately, the goal is to have a short-hand test that could quickly direct interest towards proteins in a phylogeny that might be of specific functional interest in evolutionary studies, as well as in functional studies and as the focus of drug- or disease-specific studies.
Tree balance
Phylogenetic tree shapes of protein families are dictated by relative rates of duplication and subsequent removal from the genome (Colless 1995). Numerous theories concerning tree shapes for the analysis of morphological data have been proposed (Heard 1992; Heard and Cox 2007; Heard and Mooers 1996), but less attention has been paid specifically to tree shape within molecular studies (Aldous 2001) with some notable exceptions (Blum and Francois 2006). Here we are interested in the extent of symmetry or balance of trees, as they are reflections of evolutionary events and, more importantly, they are quantifiable. The equal rates Markov (ERM) model has been regarded as a simple yet valid null model (Yule 1924), under which diversification rates are equal for all lineages within an evolving clade, but random errors in observed diversification rates can deviate the actual tree shape from perfect balance (Chan and Moore 2002; Chan and Moore 2005; Mooers and Heard 1997). There have been numerous empirical studies of morphological data to suggest that real diversification rates are not equal, with some groups significantly more diverse than others, and intensive studies have been performed to identify causes for high and low diversity in particular clades (Colless 1995; Heard 1992; Heard and Mooers 1996; Huelsenbeck and Kirkpatrick 1996; Mooers et al. 1995).
In this study, we apply the analytic methodologies of tree balance of morphological data to protein data for distance trees generated utilizing PFAM data and available from PFAM(Finn et al. 2008). The equal rates Markov (ERM) model is essentially the prediction of the tree shape under neutrality (Heard 1992; Kimura 1985). If the duplication events of family members are purely random and there are no selective effects, the tree shapes of gene families are only affected by stochastic factors. Thus under a neutral model we can expect that most of the trees should be approximately symmetric. If some family members have been positively selected, the rapid evolution rates may change their expected positions in a tree and thus disrupt the balance of the trees. Here we adopted Colless's index of phylogenetic tree imbalance (Colless 1995) to quantify cluster skewness (Heard 1992), and the index ranges from zero, for a perfectly balanced phylogeny (Fig. 4a), to one for a perfectly imbalanced phylogeny (Fig. 4b)(Heard and Cox 2007). In our context, the IC is the standardized sum of differences in member counts between any two groups of protein domains defined by each internal node:
Fig. 4.
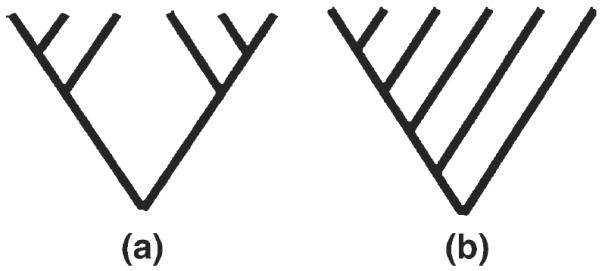
Illustration of a perfectly balanced tree (a) and a perfectly imbalanced tree (b). Balance is one measured component of tree shape. Tree balance measures are one way of considering how domain “birth” (duplication) and “death” (removal or silencing) are acting over evolutionary time
In the formula, n is the number of family members in a domain family, and the right and left branches at a node constitute subfamilies of SR and SL. Many other measures of diversity skewness are also proposed, but Ic has been regarded as among the efficient ones. (Agapow and Purvis 2002; Blum and Francois 2005).
The imbalance levels of 25 protein families are calculated with the above formula and listed in Table 4 along with the family size and the median of the pair-wise member distances. The mean of the family Ic's is 0.38344, which is an indication that most of the trees are not severely imbalanced by other systematic forces like positive selection. The P-value of the Shapiro–Wilk normality test is 0.7655, thus we may consider the Ic's are normally distributed. With an underlying distribution, we are able to detect the outliers that are located in the right tail of the distribution. However, the caveats for this univariate pattern are be: (a) the tree we are checking might not a complete tree, all the members of gene families are found by essentially computational methods, thus they may omit false negatives and include false positives and distort the tree shape; (b) different families have different sizes, thus the Ic's from different families have different reliabilities as the stochastic effects can have a larger influence on a small family than large family, for example a small family can have a large Ic's solely because of randomness. The first situation can be improved by the more accurate genomic sequence data and more powerful computational algorithms. The reliabilities of the Ic's can be measured by the sample size.
Table 4.
The imbalance levels for 25 gene families
| Gene family | Ic | Family size | Median distance | 1/Family Size |
|---|---|---|---|---|
| 4HBT | 0.669 | 33 | 172.06 | 0.030 |
| 4_1_CTD | 0.72 | 26 | 38.92 | 0.038 |
| s2OG-FeII_Oxy | 0.53 | 40 | 187.77 | 0.025 |
| A1 pp | 0.476 | 29 | 174.82 | 0.034 |
| A2 M | 0.393 | 39 | 139.02 | 0.025 |
| zf-B_box | 0.266 | 181 | 177.27 | 0.005 |
| DAGK_cat | 0.427 | 42 | 128.45 | 0.023 |
| DDE | 0.463 | 37 | 179.01 | 0.027 |
| Disintegrin | 0.585 | 54 | 79.85 | 0.018 |
| DUF1220 | 0.147 | 329 | 130.35 | 0.003 |
| EMP24_GP25L | 0.422 | 43 | 220.02 | 0.023 |
| Ets | 0.269 | 66 | 89.92 | 0.015 |
| Gal-bind_lectin | 0.347 | 64 | 133.65 | 0.015 |
| G-alpha | 0.314 | 82 | 99.99 | 0.012 |
| Galactosyl_T | 0.482 | 42 | 135.63 | 0.023 |
| G-patch | 0.299 | 66 | 149.07 | 0.015 |
| IBN_N | 0.431 | 27 | 268.83 | 0.037 |
| KH_1 | 0.111 | 259 | 198.41 | 0.003 |
| L27 | 0.422 | 51 | 223.75 | 0.019 |
| PAN_1 | 0.438 | 33 | 227.97 | 0.030 |
| RA | 0.187 | 129 | 331.985 | 0.007 |
| SapB_2 | 0.52 | 32 | 169.46 | 0.031 |
| TAS2R | 0.194 | 109 | 147.155 | 0.009 |
| T-box | 0.189 | 31 | 69.22 | 0.032 |
| ZZ | 0.285 | 60 | 149.07 | 0.016 |
If the tree shape is only determined by the stochastic effects (Gould et al. 1977), we can expect that larger families should have smaller Ic's as increasing sample size is always the effective measure to decrease sampling errors (Lehmann and Casella 1998). We tested this hypothesis by regression and correlation analysis. The normality assumption of the independent variables is satisfied by the reciprocal transformation of the original family size. The normality of the new data was confirmed by the Shapiro–Wilk normality test with a P-value 0.5242. The results of the regression analysis are shown in Table 4.
These results strongly support that tree balance is largely determined by random factors for most gene families unless a significant number of members have been under the influence of other systematic effects, such as positive selection or population level changes. This is not unexpected from other studies (Blum and Francois 2006) which have argued that a branch-split model may be the best model for cladogram balance, and further have argued that tree balance needs more study particularly with regard to molecular data (Aldous 2001). From our analysis, a conservative prediction is that gene families with large family sizes and large tree imbalance have likely been subjected to more selection (both positive and negative), although with small families significant imbalances may be caused by either systematic effects or random factors. That is, tree imbalance statistics by themselves are really useful for study only in very large protein and gene families. However, again, we would argue that it is worthwhile to consider tree imbalance statistics, in the context of other analysis methodologies, to help sort potential selective effects (Table 5).
Table 5.
Correlation analysis (a) and regression analysis (c) between tree balance and family size, and the testing of the significance of regression coefficient with ANOVA analysis (b)
| Correlation | Coefficients | Standard error | t stat | P-value |
|---|---|---|---|---|
| (a) | ||||
| Intercept | 0.148 | 0.0499 | 2.9738 | 0.006794 |
| X Variable | 11.190 | 2.1378 | 5.2344 | 2.6128E-05 |
| Lower 95% | Upper 95% | Lower 95.0% | Upper 95.0% |
|---|---|---|---|
| 0.045196 | 0.251775 | 0.045196 | 0.251775 |
| 6.767845 | 15.61270 | 6.767845 | 15.61270 |
| ANOVA | df | SS | MS | F | Significance F |
|---|---|---|---|---|---|
| (b) | |||||
| Regression | 1 | 0.327628 | 0.327628 | 27.39913 | 2.6128E-05 |
| Residual | 23 | 0.275025 | 0.011957 | ||
| Total | 24 | 0.60265 |
| Regression statistics | |
|---|---|
| (c) | |
| Multiple R | 0.73732 |
| R Square | 0.54364 |
| Adjusted R Square | 0.52380 |
| Standard Error | 0.10935 |
| Observations | 25 |
Conclusions
Phylogenetic trees are relatively easy to generate and are one of the first things that researchers tend to examine, especially for gene and protein families. Phylogenetic trees are generally constructed and reside in databases, such as PFAM, devoted to protein or gene families (Finn et al. 2008).For this reason, we examined whether the properties of phylogenetic trees would have utility for the examination of positive and negative selection in extended gene and protein families. Given our work, we believe it is possible to utilize tree properties, particularly as a method of examining large scale data in order to generate information regarding selection trends in gene families.
One example would be to look at gene families to determine if some members are under selection. If some family members have been under positive selection, rapid evolutionary rates would have the tendency to diverge family members from each other. Similarly, negative selection eliminates deleterious mutations from family members, and thus it tends to keep family members close to each other when genetic distances are examined. Utilizing distance, therefore, we postulate that we could further sort interesting members into categories representing the degree to which positive or negative selection has been acting. The pattern for 25 families (discussed above) is shown in Fig. 5. While this is a conceptual diagram, further empirical studies and simulations might be used to determine the thresholds or statistical properties necessary to identify boundary lines relating to selective properties or values of interest.
Fig. 5.
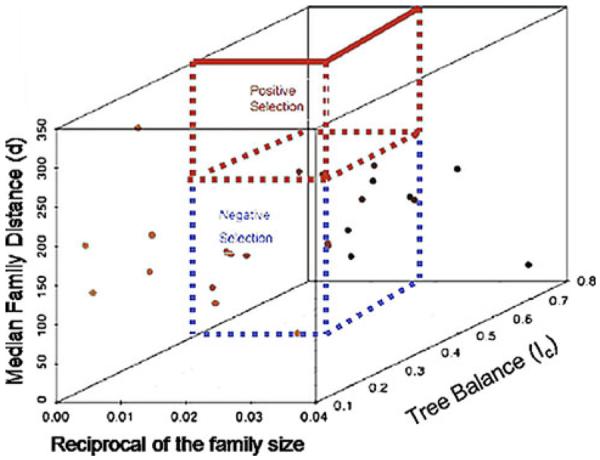
Sorting of evolutionary forces using the Median Family Distance (d), reciprocal of the family size and tree balance statistic (IC) as described in the text. This is an illustrative picture depicting how we wish to develop these statistics, in conjunction with other existing methodologies, for sorting of protein families into groups depicting which evolutionary forces (such as positive and negative selection) were primarily responsible for their evolution. Shown are the 25 gene families shown in Table 4. While the model would need to be parameterized for a large set of domains, the model illustrates how such parameterization could be performed taken into account the actual distribution of such changes
We have proposed a new perspective for tackling the problem of identification of positive and negative selection in gene families by utilizing phylogenetic tree patterns to detect selection at molecular level. We found significant relationships among the parameters of family size, genetic distance and imbalance of a tree which can be used to examine selective trends. It is worthwhile to note that, in most cases, these methodologies are not useful by themselves for separating positive and negative selection effects from other effects, such as lineage-specific functional shifts, functional recapture, mutation rate changes, and others. However, these relationships are allowing us to visualize a set of complex relationships within these phylogenies that are otherwise hard to capture with molecular data. Because of this, we argue that these methods are likely to be easier to implement and utilize for large-scale data analysis of gene and protein families, particularly when repeated domain segments are present, than other methodologies that rely on gathering data beyond phylogenies. Hence, we argue that the methods detailed here might be a useful “first-pass” analysis for genomic data, and with further study may be useful in conjunction with other existing analyses to help guide studies towards genes and proteins that are under selection. We plan on developing this technique into a large-scale genome annotation tool after the examination of further parameter space and through more empirical studies of protein domains and their evolutionary properties.
Acknowledgments
The authors wish to thank Ada Solidar at Vassa Informatics and Christine Malcom at Roosevelt University for help in preparing and reviewing this manuscript. This work was supported in part by National Institutes of Health grants to GJW, National Institute of Child Health and Human Development 1R15HD055668-01A1 and National Institute of General Medical Sciences 1R41GM088922-01A1.
References
- Agapow PM, Purvis A. Power of eight tree shape statistics to detect nonrandom diversification: a comparison by simulation of two models of cladogenesis. Syst Biol. 2002;51:866–872. doi: 10.1080/10635150290102564. [DOI] [PubMed] [Google Scholar]
- Aldous DJ. Stochastic models and descriptive statistics for phylogenetic trees, from Yule to Today. Statist Sci. 2001;16:23–34. [Google Scholar]
- Aravind L, Iyer LM, Koonin EV. Comparative genomics and structural biology of the molecular innovations of eukaryotes. Curr Opin Struct Biol. 2006;16:409–419. doi: 10.1016/j.sbi.2006.04.006. [DOI] [PubMed] [Google Scholar]
- Berg JM. Zinc finger domains: hypotheses and current knowledge. Annu Rev Biophys Biophys Chem. 1990;19:405–421. doi: 10.1146/annurev.bb.19.060190.002201. [DOI] [PubMed] [Google Scholar]
- Blum MGB, Francois O. On statistical tests of phylogenetic imbalance: the Sackin and other indices revisited. Math Biosci. 2005;195:141–153. doi: 10.1016/j.mbs.2005.03.003. [DOI] [PubMed] [Google Scholar]
- Blum MGB, Francois O. Which random processes describe the tree of life? A large-scale study of phylogenetic tree imbalance. Syst Biol. 2006;55:685–691. doi: 10.1080/10635150600889625. [DOI] [PubMed] [Google Scholar]
- Breitling R, Gerber JK. Origin of the paired domain. Dev Genes Evol. 2000;210:644–650. doi: 10.1007/s004270000106. [DOI] [PubMed] [Google Scholar]
- Chan KM, Moore BR. Whole-tree methods for detecting differential diversification rates. Syst Biol. 2002;51:855–865. doi: 10.1080/10635150290102555. [DOI] [PubMed] [Google Scholar]
- Chan KM, Moore BR. SYMMETREE: whole-tree analysis of differential diversification rates. Bioinformatics. 2005;21:1709–1710. doi: 10.1093/bioinformatics/bti175. [DOI] [PubMed] [Google Scholar]
- Colless DH. Relative symmetry of cladograms and phenograms: an experimental study. Syst Biol. 1995;44:102–108. [Google Scholar]
- Delport W, Scheffler K, Seoighe C. Models of coding sequence evolution. Brief Bioinform. 2009;10:97–109. doi: 10.1093/bib/bbn049. [DOI] [PMC free article] [PubMed] [Google Scholar]
- Finn RD, Tate J, Mistry J, Coggill PC, Sammut JS, Hotz HR, Ceric G, Forslund K, Eddy SR, Sonnhammer EL, Bateman A. The Pfam protein families database. Nucleic Acids Res. 2008;36:D281–D288. doi: 10.1093/nar/gkm960. [DOI] [PMC free article] [PubMed] [Google Scholar]
- GCG . Genetics Computer Group; Madison WI: 1999. [Google Scholar]
- Good IJ. Some statistical applications of Poisson's work. Statist Sci. 1986;1:157–180. [Google Scholar]
- Gould SJ, Raup DM, Sepkoski JJ, Schopf TJM, Simberloff DS. The shape of evolution: a comparison of real and random clades. Paleobiology. 1977;3:23–40. [Google Scholar]
- Graur D, Li W-H. Fundamentals of molecular evolution. Sinauer Associates; Massachusetts: 2000. [Google Scholar]
- Gu X. Statistical methods for testing functional divergence after gene duplication. Mol Biol Evol. 1999;16:1664–1674. doi: 10.1093/oxfordjournals.molbev.a026080. [DOI] [PubMed] [Google Scholar]
- Gu Z, Cavalcanti A, Chen F-C, Bouman P, Li W-H. Extent of gene duplication in the genomes of drosophila, nematode, and yeast. Mol Biol Evol. 2002;19:256–262. doi: 10.1093/oxfordjournals.molbev.a004079. [DOI] [PubMed] [Google Scholar]
- Guo HH, Choe J, Loeb L. Protein tolerance to random amino acid change. PNAS. 2004;101:9205–9210. doi: 10.1073/pnas.0403255101. [DOI] [PMC free article] [PubMed] [Google Scholar]
- Harrison PM, Gerstein M. Studying genomes through the aeons: protein families, pseudogenes, and proteme evolution. J Mol Biol. 2002;318:1155–1174. doi: 10.1016/s0022-2836(02)00109-2. [DOI] [PubMed] [Google Scholar]
- Heard SB. Patterns in tree balance among cladistic, phenetic, and randomly generated phylogenetic trees. Evolution. 1992;46:1818–1826. doi: 10.1111/j.1558-5646.1992.tb01171.x. [DOI] [PubMed] [Google Scholar]
- Heard SB, Cox GH. The shapes of phylogenetic trees of clades, faunas, and local assemblages: exploring spatial pattern in differential diversification. Am Nat. 2007;169:E107–E118. doi: 10.1086/512690. [DOI] [PubMed] [Google Scholar]
- Heard SB, Mooers A. Imperfect information and the balance of cladograms and phenograms. Syst Biol. 1996;45:115–118. [Google Scholar]
- Huang C-H, Peng J. Evolutionary conservation and diversification of Rh family genes and proteins. PNAS. 2005;102:15512–15517. doi: 10.1073/pnas.0507886102. [DOI] [PMC free article] [PubMed] [Google Scholar]
- Huelsenbeck JP, Kirkpatrick M. Do phylogenetic methods produce trees with biased shapes? Evolution. 1996;50:1418–1424. doi: 10.1111/j.1558-5646.1996.tb03915.x. [DOI] [PubMed] [Google Scholar]
- Huelsenbeck JP, Joyce P, Lakner C, Ronquist F. Bayesian analysis of amino acid substitution models. Philos Trans R Soc Lond B Biol Sci. 2008;363:3941–3953. doi: 10.1098/rstb.2008.0175. [DOI] [PMC free article] [PubMed] [Google Scholar]
- Hughes AL. Gene duplication and the origin of novel proteins. Proc Natl Acad Sci USA. 2005;102:8791–8792. doi: 10.1073/pnas.0503922102. [DOI] [PMC free article] [PubMed] [Google Scholar]
- Kimura M. The neutral theory of molecular evolution. Cambridge University Press; Cambridge: 1985. [Google Scholar]
- Kishino H, Miyata T, Hasegawa M. Maximum likelihood inference of protein phylogeny and the origin of chloroplasts. J Mol Evol. 1990;31:151–160. [Google Scholar]
- Kreitman M. The neutral theory is dead. Long live the neutral theory. Bioessays. 1996;18:678–683. doi: 10.1002/bies.950180812. discussion 683. [DOI] [PubMed] [Google Scholar]
- Laity JH, Lee BM, Wright PE. Zinc finger proteins: new insights into structural and functional diversity. Curr Opin Struct Biol. 2001;11:39–46. doi: 10.1016/s0959-440x(00)00167-6. [DOI] [PubMed] [Google Scholar]
- Lehmann EL, Casella G. Theory of Point Estimation. Springer; Berlin: 1998. [Google Scholar]
- Mooers AO, Heard SB. Inferring evolutionary process from the phylogenetic tree shape. Q Rev Biol. 1997;72:31–54. [Google Scholar]
- Mooers AO, Page RDM, Purvis A, Harvey PH. Phylogenetic noise leads to unbalanced cladistic tree reconstructions. Syst Biol. 1995;44:332–342. [Google Scholar]
- Orgel LE. Gene-duplication and the origin of proteins with novel functions. J Theor Biol. 1977;67:773. doi: 10.1016/0022-5193(77)90262-4. [DOI] [PubMed] [Google Scholar]
- Raup DM, Gould SJ, Schopf TJM, Simberloff DS. Stochastic models of phylogeny and the evolution of diversity. J Geol. 1973;81:525–542. [Google Scholar]
- Ricklefs RE. Estimating diversification rates from phylogenetic information. Trends Ecol Evol. 2007;22:601–610. doi: 10.1016/j.tree.2007.06.013. [DOI] [PubMed] [Google Scholar]
- Rosen DE. Vicariant patterns and historical explanation in biogeography. Syst Zool. 1978;27:159–188. [Google Scholar]
- Rubin GM, Yandell MD, Wortman JR, et al. Comparative genomics of the eukaryotes science. 2000;287:2204–2215. doi: 10.1126/science.287.5461.2204. [DOI] [PMC free article] [PubMed] [Google Scholar]
- San Mauro D, Agorreta A. Molecular systematics: a synthesis of the common methods and the state of knowledge. Cell Mol Biol Lett. 2010;15:311–341. doi: 10.2478/s11658-010-0010-8. [DOI] [PMC free article] [PubMed] [Google Scholar]
- Schmidt EE, Davies CJ. The origins of polypeptide domains. Bioessays. 2007;29:262–270. doi: 10.1002/bies.20546. [DOI] [PMC free article] [PubMed] [Google Scholar]
- Schopf TJM. Evolving paleontological views on deterministic and stochastic approaches. Paleobiology. 1979;5:337–352. [Google Scholar]
- Shakhnovich BE, Koonin EV. Origins and impact of constraints in evolution of gene families. Genome Res. 2006;16:1529–1536. doi: 10.1101/gr.5346206. [DOI] [PMC free article] [PubMed] [Google Scholar]
- Shapiro SS, Wilk MB. An analysis of variance test for normality (complete samples) Biometrika. 1965;52:591–611. [Google Scholar]
- Simberloff D. Calculating probabilities that cladograms match: a method of biogeographical inference. Syst Zool. 1987;36:175–195. [Google Scholar]
- Sleator RD. An overview of the processes shaping protein evolution. Sci Prog. 2010;93:1–6. doi: 10.3184/003685009X12605492662844. [DOI] [PMC free article] [PubMed] [Google Scholar]
- Tokuriki N, Tawfik DS. Protein dynamism and evolvability. Science. 2009;324:203–207. doi: 10.1126/science.1169375. [DOI] [PubMed] [Google Scholar]
- Van de Peer Y, Taylor JS, Braasch I, Meyer A. The ghost of selection past: rates of evolution and functional divergence of anciently duplicated genes. J Mol Evol. 2001;53:436–446. doi: 10.1007/s002390010233. [DOI] [PubMed] [Google Scholar]
- Wang ET, Kodama G, Baldi P, Moyzis RK. Global landscape of recent inferred Darwinian selection for Homo sapiens. Proc Natl Acad Sci USA. 2006;103:135–140. doi: 10.1073/pnas.0509691102. [DOI] [PMC free article] [PubMed] [Google Scholar]
- Yang Z. PAML. Comput. Appl. Biosci. 1997;13:555–556. doi: 10.1093/bioinformatics/13.5.555. [DOI] [PubMed] [Google Scholar]
- Yule GU. A mathematical theory of evolution, based on the conclusions of Dr. J.C. Willis. Phil Tran. R Soc L B. 1924;213:21–87. [Google Scholar]
- Zeng LW, Comeron JM, Chen B, Kreitman M. The molecular clock revisited: the rate of synonymous vs. replacement change in Drosophila. Genetica. 1998;102–103:369–382. [PubMed] [Google Scholar]