

Abstract
Non-genotoxic carcinogens (NGCs) promote tumour growth by altering gene expression which ultimately leads to cancer without directly causing a change in DNA sequence. As a result NGCs are not detected in mutagenesis assays. Whilst there are proposed biomarkers of carcinogenic potential, the definitive identification of non-genotoxic carcinogens still rests with the rat and mouse long term bioassay. Such assays are expensive, time consuming, require a large number of animals and their relevance to human health risk assessments is debatable.
Metabolomics and lipidomics in combination with pathology and clinical chemistry were used to profile perturbations produced by 10 compounds which represented a range of rat non-genotoxic hepatocarcinogens (NGC), non-genotoxic non-hepatocarcinogens (non-NGC) and a genotoxic hepatocarcinogen. Each compound was administered at its maximum tolerated dose level for 7, 28 and 91 days to male Fisher 344 rats.
Changes in liver metabolite concentration differentiated the treated groups across different time points. The most significant differences were driven by pharmacological mode of action, specifically by the peroxisome proliferator activated receptor alpha (PPAR-α) agonists. Despite these dominant effects, good predictions could be made when differentiating NGCs from non-NGCs. Predictive ability measured by leave one out cross validation was 87% and 77% after 28 days of dosing for NGCs and non-NGCs, respectively. Amongst the discriminatory metabolites we identified free fatty acids, phospholipids, triacylglycerols, as well as precursors of eicosanoid and the products of reactive oxygen species linked to processes of inflammation, proliferation and oxidative stress. Thus, metabolic profiling is able to identify changes due to the pharmacological mode of action of xenobiotics and contribute to early screening for non-genotoxic potential.
Keywords: non-genotoxic carcinogens, metabolomics, lipidomics, PPAR alpha agonist, CAR receptor
INTRODUCTION
DNA reactive carcinogens (genotoxic carcinogens) are routinely screened for using a standard battery of genotoxicity assays, including evaluations for mutagenicity in bacteria and mammalian cells and chromosomal damage in mammalian cells. Non-genotoxic carcinogenicity is a multi-stage process requiring initiation and subsequent promotion, and is associated with suppressed apoptosis and increased proliferation, where the replication of cells arises by spontaneous mutations and increased DNA synthesis1. Non-genotoxic carcinogens (NGCs) induce cancer in the absence of direct DNA damage; often by causing changes in gene expression that promote the growth of initiated cells. Therefore, they are not detected by genotoxicity assays2.
Identification of early stage biomarkers of NGCs has been previously studied to aid the identification of molecules with carcinogenic potential3. Potential biomarkers include increased relative liver weight, hepatocyte labelling index4, hepatocellular necrosis, hypertrophy and cytomegally in short term toxicity studies in both rats and mice5. More recently, functional genomic studies including transcriptomics6–12, proteomics13 and microRNA profiling14 have been employed to examine their potential in the early identification of chemical carcinogenesis.
One of the most notable proteomic studies was carried out using 63 compounds13 reporting predictability as high as 79.3% for genotoxic and 76.5% from non-genotoxic compounds, respectively, using protein expression profiles of the rat liver after 28 days of dosing. The study was well layered as the 63 compounds were divided into 3 different groups each of which could be further split into subgroups. In total 9 genotoxic hepatocarcinogens, 6 non-liver carcinogens with positive Ames tests, 14 Ames positive compounds with no carcinogenic property, 21 non-genotoxic hepatocarcinogens in rat and/or mice as well as 13 Ames negative non carcinogens were profiled. The results suggested PDZ domain-containing protein 1 as a potential biomarker for NGCs. In addition, the most favourable prediction accuracy has been reported using transcriptomics8 where 6 different NGCs and 54 non hepatocarcinogens were profiled after 28 days of dosing. Prediction accuracies yielded 99% sensitivity and 97% specificity highlighting p38 Mapk- and Myc-centered networks to be significant indicators of early stage hepatocarcinogenesis. These genes were suggested to be candidate biomarkers for both non-genotoxic hepatocarcinogens and genotoxic hepatocarcinogens.
The development of genetically modified knockout mice of several nuclear receptors (NRs) has revealed NR mediation as a common mechanism of hepatocarcinogenesis caused by numerous NGCs15–16, and the sustained activation of several NRs involve various pathways leading to cancer17–18. NR-mediated cancer promotion involves altered metabolic pathways mostly affecting energy homeostasis, inflammation and lipid metabolism, through the induction of liver growth, cellular hypertrophy (peroxisome and smooth endoplasmic reticulum proliferation) and hyperplasia leading to cancer (reviewed by Hall et al.17).
Some of the major NRs that have been identified as participants of hepatic carcinogenesis by non-genotoxic tumour promoting mechanisms are the constitutive androstane receptor (CAR) and peroxisome proliferator-activated receptor-alpha (PPAR-α)15–16. Upon activation (receptor binding) by xenobiotics or certain endogenous metabolites, CAR, and PPAR-α receptors heterodimerize with retinoid X receptor (RXR) prior to DNA binding19–20 to induce gene expression.
Despite this accumulating knowledge and new approaches which are being developed, a comprehensive mechanistic understanding is lacking, and the method for regulatory assessment of NGCs remains the 2 species lifetime bioassays. This study used a metabolomics/metabonomics methodology to investigate and compare the early metabolic effects of non-genotoxic hepatocarcinogens with those of non-hepatocarcinogens. The utility of this approach to predict the outcome of two year in vivo bioassays as well as shed light on mechanistic processes was also investigated.
The study design and the selection of test animals was based on a National Toxicology Program (NTP) 91 day rat toxicology assay, which is a standard regulatory rodent study, carried out prior to a long term bioassay (http://ntp.niehs.nih.gov/)21. The chemicals selected for the study included 5 non-genotoxic hepatocarcinogens (NGCs), 1 known genotoxic hepatocarcinogen and 4 non-genotoxic non-hepatocarcinogens (non-NGCs). All compounds were administered in the diet.
The NGCs and non-genotoxic tumour promoters studied included phenobarbital (PB, 1000 ppm), chlorendic acid (CA, 1250 ppm), diethylhexylphthalate (DEHP, 1200 ppm), monuron (Mon, 1500 ppm) and methapyrilene hydrochloride (MP HCl, 250 ppm). 2-aminoacetylfluorene (2-AAF, 40 ppm) was the genotoxic hepatocarcinogen. The non-NGCs included cinnamyl anthranilate (Cinn, 30,000 ppm), diethylhexyadipate (DEHA, 25,000 ppm), benzophenone (BP, 1250 ppm) and diethylthiourea (DETU, 250 ppm) (Table 1). Compounds were selected so that the NGC and non-NGC groups were balanced in terms of mode of action of compounds, effects on liver weight, cell proliferation and cytochrome P450 induction. This was to insure that the models did not simply detect markers of these effects.
Table 1.
List of compounds administered during the study along with key references used to determine the doses used.
| Summary of cancer data and effects in liver in male F344 rat | ||||||
|---|---|---|---|---|---|---|
| 2 year bioassays | Effects in liver up to 90 days | |||||
|
| ||||||
| Chemical | Dose level (ppm) | Liver carcin oma | Cancer data reference | Increase in liver weight (>120%) | Hepatic enzymes induced | Liver enzyme data reference |
| PB | 1000 | 11/33 | Butler et al, 1978 | Yes | CYP2B, 3A | Kolaja et al, 1996; Smith et al, 1991 |
| CA | 1250 | 23/50 | NTP TR-304, 1987 | No | CYP2B, 3A | Elcombe et al, 2002 |
| DEHP | 12000 | 12/49 | NTP TR-217, 1982 | Yes | PCoA, 4A | Elcombe et al, 2002; Marsman et al, 1988 |
| Mon | 1500 | 9/50 | NTP TR-266, 1988 | Transient | CYP1A | Elcoombe et al, 2002 |
| MP HCl | 250 | 90% | Lijinsky, 1984 | No | Decreasess in CYP2C11, 1A1 | NTP TOX-46, 2000 |
| 2-AAF | 40 | 100% | Ogiso et al, 1985 | CYP1A | ||
| Cinn | 30000 | None | Elcombe et al, 2002 | Yes | PCoA, 2B, 3A | Elcombe et al, 2002 |
| DEHA | 25000 | None | NTP TR-212, 1982 | Yes | PCoA | Lake et al, 1997 |
| BP | 1250 | None | NTP TR-533, 2006 | Yes | CYP2B, 3A | NTP TOX-61, 2000 |
| DETU | 250 | None | NTP TR-149, 1979 | No | No effect on CYP1A, 2B, 3A, 4A | Elcombe et al, 2002 |
Chemicals, their administered dose levels, related results of 2 year bioassays and 90 days studies are listed. References are also supplied where relevant. The male Fischer (F344) rat was selected for consistency with the lifetime bioassays. Rats were exposed to one of each of the 10 chemicals for up to a maximum of 90 days at their maximum tolerated dose level. Abbreviations: 2-AAF, 2-aminoacetylfluorene; BP, benzophenone; CA, chlorendic acid; Cinn, cinnamon anthranilate; DEHA, diethylhexyadipate; DEHP, diethylhexylphthalate; DETU, diethylthiourea; Mon, monuron; MP HCl, methapyrilene hydrochloride; PB, phenobarbital.
Gross physiological changes due to NGCs were investigated to ascertain the ability of metabolic profiling to distinguish the modes of action of the NGCs and its ability to further characterise non-genotoxic mechanisms. Particular emphasis was based on the lipidome, because of the significance of lipid biogenesis in proliferating cells for the provision of organelle membranes. Moreover, lipid oxidation products and their effects have been implicated in membrane disruption, inactivation of enzymes, damage to proteins and cancer development, which also makes lipidomic investigation of primary importance for mechanistic investigations22. This approach produced models with predictive capability of 87% and 77% after 28 days of dosing for NGCs and non-NGCs, respectively, demonstrating the promise of this approach.
MATERIALS AND METHODS
Animal studies conformed to both local and national ethical use of animal guidelines and were performed in accordance with the UK Home Office Animals (Scientific Procedures) Act 1986.
Test substances
Sodium phenobarbital, chlorendic anhydride, diethylhexylphthalate, monuron, methapyrilene HCl, diethylhexyladipate, benzophenone, diethylthiourea and 2-acetylaminofluorene were obtained from Sigma Aldrich (Poole, Dorset, UK). Cinnamyl anthranilate had been obtained from Lancaster synthesis (Morecambe, UK). Chlorendic anhydride was hydrolysed to the acid prior to use.
Internal standards used in lipidomic studies were obtained from Avanti Polar Lipids Inc. (Alabaster Alabama, US). Internal standards for the measurements of aqueous metabolites were purchased from Cambridge Isotope Laboratories (Andover, Massachusetts, US). All other standard chemicals were obtained from Sigma Aldrich (Poole, Dorset, UK). Solvents used were of HPLC grade.
Experimental Design
Fifteen male F344 rats per group were continuously supplied in their diet with one of the 10 compounds at the dose levels stated in table 1. The maximum tolerated dose levels were selected following literature review in order to select a dose that induced strong effects and for the NGCs were known to be a carcinogenic dose. A further fifteen rats formed the control group and received no test substance in their diet. Five rats from each of the eleven groups were killed after 7, 28 and 91 days respectively by an overdose of anesthetic (halothane Ph. Eur. Vapour) followed by exsanguination.
Sample collection for histopathology and clinical chemistry
For histopathology liver sections were taken from the three main liver lobes, embedded on paraffin wax, sections at 5Nm were prepared, stained with haematoxylin and eosin, and examined by light microscopy. For clinical chemistry plasma was collected and the following parameters were analysed: glutamate dehydrogenase, alanine aminotransferase, aspartate aminotransferase, triglycerides, cholesterol, gamma-glutamyl transferase, bilirubin, albumin, total protein and creatinine using a Konelab clinical chemistry analyser (Thermo Scientific, Waltham, MA).
Tissue extraction for metabolomics
Multiple samples were taken from of the liver and snap frozen in liquid nitrogen. All samples were taken as quickly as possible and stored at −80°C until analysis. Liver samples were prepared using methanol-chloroform-water extraction23. Methanol-chloroform solution (2:1, 600 μL) was added to approximately 50 mg of frozen tissue and homogenised with a tissue lyser. Chloroform-water (1:1, 400 μL) was added, samples were sonicated for 15 minutes and centrifuged (13 500 rpm, 20 minutes). The resulting aqueous and organic layers were separated and the extraction procedure was repeated. Samples were dried under nitrogen before processing for gas-chromatography-mass spectrometry (GC-MS), flow infusion-mass spectrometry (FI-MS) and liquid chromatography-mass spectrometry (LC-MS) analysis.
Gas Chromatography–Mass Spectrometry (GC-MS)
Organic-phase metabolites were derivatised by acid catalysed esterification to form fatty acid methyl esters (FAMEs) of carboxylic acids and measured using a DSQ II single-quadrupole mass spectrometer (ThermoScientific, Hemel Hempstead, UK) as described by Waterman et al.24.
Flow injection-mass spectrometry (FI-MS)
FI-MS experiments for the measurement of free fatty acids, monoacyl phospholipids and diacyl phospholipids were carried out with electrospray ionisation (ESI) in negative ion mode on a Thermo Scientific LTQ linear ion trap mass spectrometer coupled to at Micro AS Autosampler and Surveyor Pump (Thermo Scientific, Waltham, MA). A 10 μL aliquot, comprising one hundredth of the organic fraction, was diluted into 90 μL of methanol-chloroform (2:1), and 10μL of sample was injected. As mobile phase MeOH:CHCl3 2:1 was used with 0.1% formic acid. Data was collected in profiling mode between 100 and 1200 m/z for 2 minutes following sample injection. The spray voltage was 4.5 kV and the capillary temperature was 290°C. The sheath gas, auxiliary gas and sweep gas were set at 12, 1 and 1 arbitrary units, respectively. FI-MS spectrums were peak picked by using in-house software. The data was normalised to wet tissue weights and to total signal intensity. Ion tree experiments were conducted to acquire MS/MS for structural elucidation, identification and conformation of the lipid species present. In this analysis the sample was directly infused at a rate of 15 μL/min and MS/MS data collected in centroid mode between m/z values of 100 and 1200 for up to 5 min with a parent mass step value of 1 m/z. The isolation width was 1.5 m/z and the collision energy was 35 eV. All other parameters were set as detailed above.
Liquid chromatography mass spectrometry (LC-MS)
Intact liver lipids were also analysed by LC-MS in positive ion mode. A 10 μL aliquot, comprising one hundredth of the organic fraction, was diluted into 90 μL of methanol-chloroform (2:1) containing 20 μM 1,2-diheptadecanoyl-sn-glycero-3-phosphocholine (PC (17:0/17:0)) (Avanti Polar Lipids Inc., Alabaster, Alabama, US). The instrumentation comprised of a Xevo G2 Quadrupole Time of Flight (QToF) mass spectrometer with a Z-spray ESI source coupled to an ACQUITY Ultra Performance Liquid Chromatography (UPLC) system. Separation of species was achieved using an ACQUITY CSH™ C18, 1.7 Nm (2.1 × 100 mm) column (Waters Ltd., Elstree, Hertfordshire, UK). Mobile phase A consisted of 10 mM ammonium formate in acetonitrile:water (6:4), whilst mobile phase B contained 10 mM ammonium formate in isopropanol:acetonitrile (9:1). The concentration of mobile phase B was increased from 40–100% in 18 min then equilibrated at 40% for 2 min with a flow rate of 0.4 mL/min. The ESI source was operated in positive ion mode with the source temperature set at 80°C and a cone gas flow of 100 L/h. The desolvation gas temperature was 250°C and the nebuliser gas flow rate was set at 700 L/h. The capillary voltage was 3 kV and the cone voltage 50 V. Mass spectrometric data was collected from 50–1200 m/z in profiling scan mode. Data were processed using MarkerLynx™ within the software suit MassLynx™ (version 4.1) by Waters Ltd. (Elstree, Hertfordshire, UK). Collection parameters were set with a mass window of 0.05 Da and retention time window of 0.2 min. Data were automatically deisotoped and normalised to wet tissue weights and the intensity of the internal standard. For structural elucidation, identification and conformation of the lipid species present, data dependant acquisition (DDA) experiments were conducted.
Analysis of acylcarnitines by flow injection-mass spectrometry
Acylcarntines were analysed according to the Neolynx™ method described by Waters Ltd. (Elstree, Hertfordshire, UK). Briefly, 40μL of lipid extract was evaporated under nitrogen and derivatised with 100 μl of 3 M butanolic HCl (Sigma-Aldrich, Louis, Missouri, USA) for 15 min at 60°C. The samples were dried under nitrogen and reconstituted in 200 μL acetonitrile containing internal standard mix (1.63 μM [d9] free carnitine, 0.3 μM [d3] acetyl carnitine, 0.06 μM [d3] propionyl carnitine, 0.06 μM [d3] butyryl carnitine, 0.06 μM [d9] isovarelyl carnitine, 0.06 μM [d3] octaboyl carnitine, 0.06 μM [d9] myristoyl carnitine, and 0.12 μM [d3] palmitoyl carnitine) (Cambridge Isotope Laboratories, Inc., Andover, Massachusetts, USA). A 5 μL sample was injected using an Acquity UPLC System and analysed on a Quattro™ Premier XE triple quadrupole mass spectrometer (Waters Ltd., Herefordshire, UK) using ESI. A parent scan in positive ion mode for a common loss of +85 Da was utilised, with the following optimisation parameters: capillary voltage 3.5 kV, cone voltage 35 V, collision energy 25 V, source temperature 110°C and desolvation temperature 300°C. Samples were introduced by flow injection with a run time of 5 min and a flow rate of 10 μL/min that increased to 100 μL/min via a linear gradient over the last minute. The infusion solvent consisted of 1:1 acetonitrile:iso-propanol with 0.2% formic acid. Flow injection acylcarnitine data were processed using the Neolnyx™ software addition to Masslynx™ version 4.1 (Waters Ltd., Elstree, Herfordshire, UK) and normalised to wet tissue weights and to the intensity of the internal standards.
Targeted analysis of aqueous metabolites
For LC-MS/MS analysis aqueous phase metabolites resulting from the chloroform:methanol extraction were used. The entire fraction was dissolved in 300 μL of 70:30 acetonitrile:water containing 20 μM universally 13C and 15N labelled glutamate following protocols described by West et al.25 The instrumentation comprised of an ABSciex 5500 Qtrap mass spectrometer (ABSciex UK Limited, Warrington, Cheshire) coupled to a SIL20-A LC system (Shimadzu Corp., Kyoto, Japan). Mobile phase A consisted of a 100 mM ammonium acetate, mobile phase B was acetonitrile with a flow rate of 0.3 mL/min. Two μL of the samples were injected and analytes separated using a 100 mm ZIC-HILIC column with 2.1 mm ID and 3.5 μm particle size (Sequant, Umeå, Sweden) with a linear gradient starting with 20% A for 2 min followed by an increase to 50% A over 10 min and finally a 3 min re-equilibration. Metabolites were measured with unscheduled multiple reaction monitoring events (MRMs) (Supplementary table 1) using a source temperature of 500°C, an ion spray voltage of +4.5 kV and a dwell time of 50 ms. Peaks were integrated by Quantitation Wizard within Analyst™ version 1.6 by ABSciex Ltd. (Warrington, Cheshire, UK). Data was normalised against wet tissue weight and to correct for instrumental variance further normalised to the intensity of the internal standard. Concentration ratios are reported and are defined as the area of the analyte peak against the area of an internal reference standard.
Univariate statistical analysis
For univariate statistical analysis Microsoft Excel 2010 (Microsoft UK, Reading) and Graph Pad Prism 5 (La Jolla, California, US) software packages were used. Student’s t-test and 1 way and 2 way ANOVA were used to test for statistical significance.
Multivariate statistical analysis
Multivariate data analysis was performed using SIMCA 13 (Umetrics AB, Umeå, Sweden). Data sets were scaled by either unit variance (UV) or Pareto scaling (Par)26 and analyzed using principal components analysis (PCA) and partial least-squares-discriminant analysis (PLS-DA). Model validity was assessed using 100 random permutations to ensure that the class separation is genuine and not a chance occurrence. Variables relevant in explaining the differences between groups were determined by the use of variable importance in the projection (VIP) score26. Variables with VIP higher or equal to one (VIP≥ 1) were considered significant. The goodness of the models is numerically represented by values for the fit (R2) and prediction (Q2). For discriminant analysis models, misclassification tables were built within the SIMCA package. A misclassification table contains the number of correctly classified and the number of incorrectly classified groups. The numbers are based on the multivariate model calculations and provide quantitative means to show the proportion of correctly classified groups.
Receiver operating characteristic (ROC) analysis
ROC analysis was employed in both a univariate and a multivariate manner to measure the strength of one or multiple markers (metabolites and other parameters). The ROC curve analysis tool, ROCCET (ROC curve explorer & tester available at http://www.roccet.ca) was used to perform these tests. ROC curves visualise the sensitivity (true positive rate) against the specificity (false positive rate) representing the ability of a marker to determine the presence or absence of toxicity. A ROC curve can be described by the area under the curve (AUC) as a measure of the strength of a test, with an ideal marker having an area of one and an area of less than 0.5 being worse than a random guess.
RESULTS
Body and liver weights
By day 28 DEHA and Cinn caused body weights to decrease by 30% (p<0.001) and 20% (p<0.05) of controls, respectively, due to poor palatability. For humane reasons, administration of these 2 compounds could not be maintained for the full 91 days. Animals in the Cinn group were killed at day 28 and at the same time animals in the DEHA group were returned to control diet. This presented the opportunity to investigate whether the measured changes induced by exposure to DEHA are reversible upon withdrawal of the compound. The other compounds did not adversely affect body weight by more than 10% of concurrent controls.
Both liver carcinogen promoters DEHP, PB and non liver carcinogens DEHA, BP and Cinn caused increases in adjusted liver weights of equal or greater than 120% of concurrent control values at one or more time points. Liver carcinogens Mon and 2-AAF (genotoxic) and liver non-carcinogen DETU caused slight increases in liver weights. Liver carcinogens MP HCl and CA caused no effect and a slight initial decrease in adjusted liver weight, respectively (Supplementary table 2).
Histology
There were no abnormalities detected in the livers of control animals or from animals receiving the rat liver carcinogen CA or the non-rat liver carcinogen DETU. The rat liver carcinogen monuron was without effect on the liver except for the presence of minimal vacuolation in all animals at day 91 only. DEHP and DEHA caused a minimal transient increase in mitosis at day 7. Diffuse hepatocyte hypertrophy was a feature produced by administration of these peroxisome proliferators at most time points studied. Hepatocyte hypertrophy slightly increased in severity and incidence from day 7 to day 28 for both chemicals and was greater for DEHA compared to DEHP at both of these time points. By day 91 the liver morphology of the DEHA group of rats had returned to normal following the return to control diet at day 35.
The P450 enzyme inducers PB and BP also caused hepatocyte hypertrophy at all time points studied, but unlike the peroxisome proliferators the effect was localised to the centrilobular regions of the liver. The incidence and severity of the hypertrophy was the same for both chemicals at day 7 but was slightly greater for PB at day 28 and 91. Both chemicals also caused minimal vacuolation at day 28 that progressed to slight vacuolation at day 91. A transient increase in mitosis was observed at day 7 following treatment with BP but not PB.
Cinn produced minimal hypertrophy at days 7 and 28 that had a diffuse distribution. This effect was similar to that produced by the peroxisome proliferators, although, there was no evidence of a transient increase in mitosis at day 7. The rat liver carcinogen, MP HCl, cause minimal hepatocyte necrosis/apoptosis at the time points investigated. The genotoxic carcinogen 2-AAF caused biliary hyperplasia and inflammation from day 28 onwards following a transient increase in minimal mitosis at day 7.
Clinical chemistry
The effects of dietary administration of the various compounds on all clinical chemistry parameters measured are shown in supplementary table 3. The most prominent effect on the markers for liver toxicity was a sustained increase in glutamate dehydrogenase (GLDH) caused by MP HCl (69% (p<0.01), 215% (p<0.01) and 260% (p<0.01) higher than concurrent control values at days 7, 28 and 91, respectively). Much smaller increases were also evident in the other 2 markers ALT on day 91 and AST on days 7 and 91, respectively, within the MP HCl group. CA produced slight increases in GLDH at days 28 and 91.
All compounds, except for the genotoxic carcinogen, 2-AAF, produced decreases in triglycerides (TGs) at one or more time-points. The decreases in TGs caused by the carcinogens were exacerbated as the study progressed to 91 days whereas the decreases triggered by the non-carcinogens became less prominent. The most marked reduction in TGs was produced by CA, with values of 42%, 20% and 15% of concurrent controls at days 7, 28 and 91, respectively. In order of decreasing potency, the liver carcinogens DEHP, PB, MP HCl also reduced plasma TGs at most time points. The non-genotoxic liver carcinogen with the least notable effect on TGs was MON. This chemical caused a reduction at 91 days only. In addition to the reduction in TGs the peroxisome proliferators (DEHP, Cinn & DEHA) also caused reductions in cholesterol (CHOL) and non-esterfied fatty acids (NEFAs) at most time points. BP and DETU caused sustained increases in CHOL throughout the study.
The largest increases in serum total bile acids (TBA) (6-fold above control levels) occurred at day 28 in rats given Cinn or DEHA. This increase followed earlier increases, at day 7, of 3- and 2-fold, for each compound, respectively. Cinn also caused small increases in plasma bilirubin (Bil) levels at days 7 and 28 and it was the only chemical to cause an increase in plasma gamma-glutamyl-transferase (GGT) levels. The increase of all 3 of these markers indicates that Cinn caused hepatocellular cholestasis. The increase in TBA caused by DEHA was shown to be reversible by day 91 following the return to control diet from day 36 onwards. CA and DEHP caused smaller increases in TBA, but not GGT or Bil, at day 91 only.
Lipidomics results
Fatty acid changes in liver analysed by GC-MS
The total fatty acid profiles as measured by GC-MS were investigated by multivariate data analysis (Q2=40%) (Figure 1 a). Models were also built for each compound compared with the control group. Greatest similarity was shown by the PPAR-α agonists DEHP, DEHA and Cinn, with all three agonists causing increased concentrations of arachidonic acid (AA) (20:4 n-6), γ-linoleic acid (GLA) (18:3 n-6) and dihomo γ-linoleic acids (DGLA) (20:3 n-6). Decreases were detected in α-linoleic acid (ALA) (18:3 n-3), linoleic acid (LA) (18:2, n-6) and eicosadienoic acid (20:2 n-6) (Figure 1 b).
Figure 1. Overview of gas chromatography-mass spectrometry (GC-MS) analysis results.
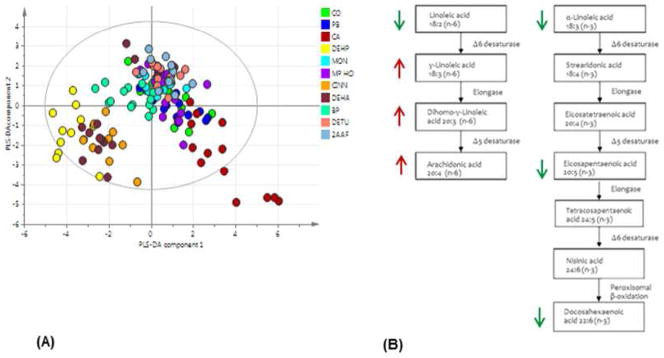
Partial least squares-discriminant analysis (PLS-DA) scores plot (A) shows total fatty acid data from lipid extracts of liver tissue samples at all time points. Diethylhexylphthalate (DEHP), cinnamon anthranilate (Cinn) and diethylhexyadipate (DEHA), the three PPAR-α agonists, show tight clustering. Metabolic changes caused by PPAR--α agonists (B) DEHP DEHA and Cinn on day 8 and 29 are increased -linoleic acid (GLA), dihomo-γ-linoleic acid (DGLA) and arachidonic acid (AA) (in red). Linoleic acid (LA), -α-linoleic acid (-α-LA), eicosapentaenoic acids (EPA) and docosahexaenoic acid (DHA) concentration were decreased (in green). End products AA and DHA are synthesised from the dietary essential fatty acids LA and -α-LA, respectively. Arrows show the direction of changes in lipid concentrations relative to control samples.
Constitutive androstane receptor (CAR) inducer agonists PB and BP both caused decreases in the concentrations of palmitic acid (16:0) as the only common feature. Non-genotoxic carcinogens PB and CA both caused increased concentrations of linoleic (18:2 n-6) and oleic acids (18:1 n-9), while 2-AAF and Mon both increased arachidic acid (20:0) concentrations. No models could be built for compounds MP HCl and DETU compared with the control group indicating these compounds did not significantly change the fatty acid profile of the liver.
Free fatty acid and phospholipid changes measured by FI-MS
FI-MS in negative ion mode detected 127 peaks of which 84 were identified by MS-MS experiments as either free fatty acids or phospholipids. PLS-DA models were built (Q2=32%) to examine the changes in control and all of the treatment groups (Figure 2 a). Similar changes were caused by the PPAR-α agonists (DEHP, Cinn and DEHA) with all agonists increasing the relative concentrations of free fatty acids eicosatrienoic (20:3 n-3) and arachidonic acid (20:4 n-6) as well as glycerophospholipids PI(18:0_20:3), PI(16:0_18:1) and PE(18:0_20:4). All PPAR-α agonists caused a relative decrease in free fatty acids palmitic (16:0), linoleic (18:2 n-6), eicosapentaenoic (20:5 n-3), docosapentaenoic (22:5 n-3) acid and glycerophospholipids PI(18:0_20:4), and PE(16:0_22:6). The nuclear hormone receptor CAR agonist BP and non-genotoxic carcinogen MP HCl also increased the concentrations of arachidonic acid, whereas the other 4 compounds (Mon, 2AAF, CA and DETU) all showed decreased relative concentrations. No model could be build comparing PB and control samples
Figure 2. Summary of the result of intact lipid data collected from lipid extracts of rat liver tissue samples at all time points.

Partial least squares-discriminant analysis (PLS-DA) scores plot of the flow injection-mass spectrometry (FI-MS) of intact lipid data collected from lipid extracts of rat liver tissue samples at all time points (A). The major trend is driven by the separation of samples from animals exposed to the three peroxisome proliferator activated receptor agonists (PPARs) diethylhexyl phthalate (DEHP) Cinnamylanthranilate (Cinn) and diethylhexyl adipate (DEHA). Misclassification tables were built (B, C) using FI-MS data. Misclassification table (B) shows the proportion of correctly classified observations in the predictionset for all treatment groups. Misclassification table (C) shows the proportion of correctly classified observations when non-genotoxic carcinogens (NGCs) and non-NGCs are predicted.
PLS-DA scores plot of the liquid chromatography-mass spectrometry (LC-MS) of intact lipid data collected from lipid extracts of rat liver tissue samples at all time points (D). Misclassification tables were built (E, F) using LC-MS data. Misclassification tables show the proportion of correctly classified observations in the prediction set for all treatment groups (E) and the proportion of correctly classified observations when non-genotoxic carcinogens (NGCs) and non-NGCs are predicted (F). For list of treatment abbreviations see table 1.
Misclassification tables were generated in order to assess how well the PLS-DA model performs in terms of classifying the treatment groups correctly according to the detected lipid profiles. The worst performing group was PB with over half the samples misclassified. All other treatment groups were classified with 80% or higher accuracy (Figure 2 b).
Further data analysis to identify potential generic classifiers of non-genotoxic liver carcinogens was performed. The PB treated samples were excluded from this analysis because this group did not produce detectable differences from the control group as illustrated by the high number of misclassified samples. Day 91 samples were also excluded since the Cinn group had been killed early and the DEHA group had been returned to control diet leaving only two compounds in the non-NGC group at this time point. A PLS-DA model was built (R2=56% Q2=32%) comparing NGCs (CA, DEHP, Mon and MP-HCl) and non-NGCs (Cinn, DEHA, BP and DETU) at days 7 and 28. Specificity was assessed by using a misclassification table. NGC samples were correctly assigned to their group in 85% of cases, whilst Non-NGCs 87.5% of the time (Figure 2 c). Decreased levels of lipids (VIP≥1) in the NGC group include all three of the 20-carbon free fatty acids, arachidonic (AA, 20:4 n-6), dihomo γ-linoleic acids (DGLA, 20:3 n-6) and eicosapentaenoic acids (EPA, 20:5 n-3). Unsaturated fatty acids 15:1 and 16:1 (palmitoleic acid, n-7) and glycerophospholids including PI(16:0_20:3), PI(18:0_22:5), PE(16:0_22:5) and PE(16:0_20:4) have also decreased compared to the non-NGCs. Increased levels due to NGCs were measured in palmitic (16:0), stearic (18:0), oleic (18:1 n-9) and adorenic acids (22:4 n-6) and phospholipids PI(18:0_20:3), PC(22:4_22:2) and PE(16:0_18:1).
Phospholipid and triacylglycerol changes measured by LC-MS
Similar to the GC-MS and FI-MS data processing approaches, multivariate data analysis was used to identify the main trends in the LC-MS dataset. Again, PLS-DA analysis of all treatments (Q2=34%) visualised clustering of the PPAR-α agonist DEHP, Cinn and DEHA groups whilst CA also showed good separation from the rest of the samples (Figure 2 d). A list of metabolites that changed due to exposure to PPAR-α agonists are shown in supplementary table 4.
The first set of statistical analyses examined the changes in control and treatment groups using PLS-DA models. Model validity and the degree of over fit were assessed by using 100 random permutations. All models passed validation with the exception of the PB group which was excluded from further comparisons. The misclassification table also shows that the PB was correctly assigned only 26.6% of the time with most of the samples in this group misclassified as controls (Figure 2 e).
The second set of statistical analysis examined changes across groups to identify potential generic classifiers of non-genotoxic liver carcinogens. NGCs (excluding PB) were compared with non-NGCs at days 7 and 28. A robust PLS-DA model was generated (R2=79%, Q2=50%). Misclassification was calculated for this model, correctly assigning 90% and 95% of the samples for NGC and non-NGC groups, respectively (Figure 2 f). A list of metabolites that were changed in the NGC group compared to the non-NGC group is shown in supplementary table 4.
Changes in carnitine species measured by flow-injection mass spectrometry
By flow-injection mass spectrometry, 37 carnitine derivatives were identified comprising of free carnitine and esterified species ranging in size from 2 to 22 carbons. Multivariate statistics was used in order to assess patterns associated with the non-genotoxic carcinogens. However, the PLS-DA model generated did not pass validation when all samples were considered and treatment groups could not be separated based on their potential for non genotoxic carcinogenesis. Various treatment groups were then compared to the control group by 2-way ANOVA with Bonferroni post-test. The sum of acylcarnitine concentrations and individual acylcarnitine concentrations were used to identify groups which are significantly different to the time matched controls. Univariate statistical analysis of the data was feasible in this class of metabolites, as only 37 variables were measured, unlike the lipidomics which necessitated multivariate statistics. As expected the most marked increases were caused by PPAR-α agonists DEHP, Cinn and DEHA. On day 7 DEHP increased total carnitine pools by 271% (p<0.001) and DEHA by 230% (p <0.001). On day 29 DEHP, Cinn and DEHA caused increases by 241% (p <0.001), 91% (p <0.05) and 179% (p <0.001), respectively (Figure 3 a). Furthermore, there was also an increase in total carnitine content caused by CA despite the fact it did not show any similarity with the PPAR-α agonists in all other lipidomic analysis.
Figure 3. Overview of changes in relative carnitine levels.

Total carnitine levels increased due to peroxisome proliferator activated receptor alpha (PPAR-α) agonists diethylhexylphthalate (DEHP), cinnamon anthranilate (Cinn) and diethylhexyadipate (DEHA). Carnitine levels of DEHA group (which was returned to control diet after 35 days) returned to control levels (A). DEHP cause the strongest effects, which were due to an increase in the short and medium chain carnitines throughout the three timepoints studied (B), as well long chain carnitines which showed a time dependent increase (C). Total carnitine level increases in Cinn were due to increased free, acetyl-, and propionyl-carnitines (D). Short and medium chain carnitines decreased in monuron (Mon) treated samples from day 7 to day 91 (E). Statistical significance was determined by ANOVA with Bonferroni’s post test for multiple comparisons, labelled * p<0.05, ** p<0.01, and *** p<0.001.
End products of β-oxidation acetyl-, propionyl-carnitine and free carnitine ratios were calculated to determine the rate of oxidation. As expected, DEHP Cinn and DEHA were found to have significantly (p<0.001) increased relative concentrations of carnitine ratios, associated with increased oxidation at all relevant time points. The carnitine profile associated with DEHA did not differ significantly from the control group on day 91 at which time animals were returned to control diet (Figure 3 a).
Total levels of short and medium (C4-C12) and long chain (C14-C22) carnitines were calculated and compared to concurrent controls for all treatment groups and time points. These revealed differences in a number of treatment groups. DEHP had the biggest effect increasing both short/medium and long chain carnitines at all time points. Short/medium chain carnitines were increased by 280% (p<0.001) 190% (p<0.01) and 190% (p<0.01) (Figure 3 b), long chain carnitines were increased in a time dependent manner by 100% (p<0.05) 160% (p<0.05) and 200% (p<0.001) on days 7, 28 and 91, respectively (Figure 3 c).
Cinn showed no differences in the carnitine metabolites ranging from C4-C22. The increase in total carnitine levels were due to increased concentrations of free carnitine and β-oxidation products acetyl- and propionyl-(C2 & C3) carnitines (Figure 3 d). CA caused changes on days 29 and 91 increasing short/medium and long chain carnitines by 140% (p<0.01), 130% (p<0.01), 166% (p<0.001) and 88% (p<0.01), respectively. Long chain carnitine contents were reduced by 78% due to DETU treatment (p<0.001) on day 28. However, no differences were measured in short/medium chain species.
Monuron showed a time dependent decrease in the liver’s short/medium chain carnitine profile. These values compared to concurrent control showed no significance by 2-way ANOVA. However, 1-way ANOVA comparing different time points within the treatment group showed a decrease (p<0.01) from day 7 to 91 (Figure 3 e) which could relate to aberrant oxidising ability.
Metabolomics results
Analysis of aqueous metabolites
Targeted metabolic profiling was used to measure aqueous metabolites associated with energy homeostasis, nucleic acid metabolism and methionine cycle intermediates. Changes were less profound than that of lipid changes, and treatment groups could not be separated based on their potential for non genotoxic carcinogenesis or pharmacological mode of action. However, strong models could be built in most cases when comparing individual treatment groups to concurrent controls.
For the measured 31 aqueous metabolites 2 way ANOVA with Bonferroni post test was used to indentify metabolites differentiating between treatment and concurrent control samples.
Decreased levels of methyl-cytosine and oxo-methionine were measured as effects of DEHP and DEHA treatment. Methyl-cytosine levels were decreased by 42% (p<0.01) and 34% (p<0.05) on day 28 by DEHP and DEHA, respectively (Figure 4 a). Oxo-methionine decreased by 30% (p<0.05) on day 28 by DEHP and 25% (p<0.05) / 33% (p<0.01) on days 7 and 28 by DEHA (Figure 4 b). No changes were measured on day 91 in either DEHA or DEHP treated groups as compared to controls.
Figure 4. Changes in aqueous metabolites affected by peroxisome proliferator activated receptor alpha (PPAR-α) agonists.

Methyl-cytosine (A) and oxo-methionine (B) concentrations were decreased by diethylhexylphthalate (DEHP) and diethylhexyadipate (DEHA). Cytosine (C) and guanine (D) concentrations were decreased by all 3 PPAR-α agonists: DEHP cinnamon anthranilate (Cinn) and DEHA. Statistical significance was determined by ANOVA with Bonferroni’s post test for multiple comparisons, labelled * p<0.05, ** p<0.01, and *** p<0.001.
Common features of PPAR-α agonists DEHP, Cinn and DEHA were decreased cytosine (Figure 4 c) and guanine (Figure 4 d) levels (p<0.001) at all relevant time points (days 7, 28 and 91 for DEHP and days 7 and 28 for Cinn and DEHA).
Only DEHP effected the concentration of NAD, which was increased at all time points by 29, 25 and 43% (p<0.05, p<0.01, p<0.001) on days 7, 28 and 91 compared to concurrent controls.
Finally there was a marked increase in uridine content due to MP HCl treatment (75%, p<0.01) and a lesser increase by Cinn (59%, p<0.05) only on day 7.
An interesting common feature of NGCs in terms of aqueous metabolism include changes in nucleoside content i.e. increased adenine and decreased guanine, cytidine and uracil levels when compared to the control samples during the course of the study.
Discrimination of NGCs from non-NGCs and assessment of potential biomarkers by ROC analysis
As expected from previous literature, the dominant trends in the data were driven by PPAR-α activation and the differences between the NGCs and non-NGCs were minor in comparison. However, despite this, good predictions were made using data from GC-MS, FI-MS and LC-MS analyses. The combined datasets were Pareto scaled and the predictive capability was assessed by multiple PLS-DA models. PLS-DA models were built comparing NGCs to non-NGCs by using training sets where group membership was retained and subsequently predicted (Table 2). Predictions were repeated 5 times, by retaining the group membership of a different observation each time for the test dataset and using the remaining four observations as the training data (each group contained 5 animals). A training observation was either 0 or 1 indicating whether it belonged to a non-NGC or a NGC class. If the predicted value was close to 0 the sample was predicted to be a non-NGC if it was close to 1 the sample was predicted to be a non-mutagenic non-hepatocarcinogen. Predicted values were averaged and expressed as a percentage.
Table 2.
Predictive capability of combined datasets using PLS-DA, including GC-MS, FI-MS, and LC-MS.
| (A) NGCs vs. non-NGCs
| |||
| NGCs day 7 | 82% ± 5% | non-NGCs day 7 | 75% ± 8% |
| NGCs day 28 | 87% ± 4% | non-NGCs day 28 | 77% ± 8% |
| NGCs days 7 & 28 | 85% ± 3% | non-NGCs days 7 & 28 | 76% ± 6% |
| NGCs all days | 82% ± 3% | non-NGCs all days | 71% ± 4% |
| (B) PPARs vs. non-PPARs
| |||
| PPARs day 7 | 86% ± 10% | non-PPARs day 7 | 101% ± 2% |
| PPARs day 28 | 90% ± 5% | non-PPARs day 28 | 95% ± 2% |
| PPARs days 7 & 28 | 88% ± 5% | non-PPARs days 7 & 28 | 98% ± 1% |
| (C) individual PPARs vs. non-PPARs
| |||
| DEHP day 7 | 94% ± 3% | Cinn day 7 | 54% ± 14% |
| DEHP day 28 | 94% ± 6% | Cinn day 28 | 84% ± 4% |
| DEHP days 7 & 28 | 94% ± 6% | Cinn days 7 & 28 | 73% ± 12% |
| DEHA day 7 | 102% ± 3% | ||
| DEHA day 28 | 94% ± 2% | ||
| DEHA days 7 & 28 | 99% ± 3% | ||
Predictive capability of combined dataset to distinguish between NGCs and non-NGCs (A), PPARs and non-PPARs (B) and the individual PPARs (C) form other compounds. The predictive capability of the combined dataset was assessed by building training sets where group membership was retained and subsequently predicted. Analyses were carried out separately for the day 7, 28, and 91 kill animals. Abbreviations: Cinn, cinnamon anthranilate; DEHA, diethylhexyadipate; DEHP, diethylhexylphthalate; FI-MS, flow injection-mass spectrometry; GC-MS, gas chromatography-mas spectrometry; LC-MS, liquid chromatography-mass spectrometry; NGC, non-genotoxic carcinogen; PPAR, peroxisome proliferator-activated receptor.
The best predictions were made using the combined dataset at day 28 achieving 87.2% predictability for NGCs and 76.9% for non-NGCs. It is likely that the predictive ability is weakened in this study by the PB group which did not produce strong effects. Day 91 was not considered on its own, as by this point, animals in the Cinn group were terminated and animals in the DEHA group were returned to the control diet.
The performance of metabolites to discriminate between NGCs (PB, CA, DEHP, Mon, MP HCl) and non-NGCs (Cinn, DEHA, BP, DETU) were tested using receiver operating characteristic (ROC) analysis (Table 3). ROC curves were assessed using metabolite levels as measured on day 28 only because this time point achieved the best predictive ability at 87% and 77% for NGCs and non-NGCs, respectively.
Table 3.
Performance of potential biomarkers based on ROC (Receiver Operating Characteristic) curves. GC-MS data is reported relative to universally deuterated tridecanoic acid as a standard and LC-MS data is reported relative to (PC (17:0/17:0)) as a standard. Thus, AUC curves are generated from semi-quantitative data.
| (A) Discriminators of NGCs from non-NGCs
| |||||
|---|---|---|---|---|---|
| Classical toxicology parameters | |||||
| AUC | p-value | C.I. | Fold change | ||
| 1 | ALP | 0.77 | 5.12E-02 | 0.62–0.91 | 0 |
| 2 | GGT | 0.75 | 1.02E-02 | 0.61–0.88 | 0.52 |
| 3 | Creatine | 0.72 | 7.37E-01 | 0.56–0.87 | −0.03 |
| 4 | Body weight | 0.68 | 4.53E-01 | 0.51–0.84 | 0.16 |
| 5 | AST | 0.68 | 2.44E-01 | 0.47–0.82 | 0.07 |
| 6 | Combined | 0.66 | 0.15–0.84 | ||
| Gas chromatography-mass spectrometry | |||||
| 1 | Eicosenoic acid 20:1 (n-9) | 0.79 | 3.68E-03 | 0.65–0.93 | 0.09 |
| 2 | Stearic acid 18:0 | 0.79 | 6.42E-04 | 0.64–0.90 | −0.28 |
| 3 | α-linoleic acid 18:3 (n-3) | 0.77 | 2.56E-03 | 0.63–0.91 | 0.07 |
| 4 | Eicosadienoc acid 20:2 (n-6) | 0.76 | 8.76E-03 | 0.61–0.91 | 0.09 |
| 5 | Linoleic acid 18:2 (n-6) | 0.75 | 4.16E-03 | 0.61–0.88 | 0.3 |
| 6 | Combined | 0.74 | 0.33–0.89 | ||
| Flow injection-mass spectrometry | |||||
| 1 | 22:4 (m/z 305.5) | 0.75 | 1.42E-03 | 0.60–0.90 | 0.44 |
| 2 | LPC 18:1 (m/z 512.5) | 0.69 | 9.47E-02 | 0.50–0.83 | −0.38 |
| 3 | PC(18:1_18:2) (m/z 768.75) | 0.67 | 6.19E-02 | 0.47–0.83 | −0.2 |
| 4 | PE(18:0_20:4) (m/z 776.67) | 0.67 | 6.14E-02 | 0.48–0.84 | −0.21 |
| 5 | LPI 16:0 (m/z 571.5) | 0.66 | 1.57E-01 | 0.50–0.83 | 0.18 |
| 6 | Combined | 0.88 | 0.73–0.99 | ||
| Liquid chromatography-mass spectrometry | |||||
| 1 | LPA (12:0) (m/z393.301) | 0.82 | 2.33E-02 | 0.71–0.94 | 5.7 |
| 2 | PE(44:0) (m/z 860.775) | 0.82 | 3.21E-03 | 0.70–0.93 | 4.72 |
| 3 | TG(53:3) (m/z888.805) | 0.82 | 5.25E-03 | 0.69–0.93 | 4.55 |
| 4 | TG(51:2) (m/z 862.791) | 0.8 | 9.89E-04 | 0.66–0.91 | 3.59 |
| 5 | TG(55:6) (m/z 910.797) | 0.8 | 2.98E-04 | 0.66–0.92 | 4.42 |
| 6 | Combined | 0.85 | 0.69–0.95 | ||
| (B) Discriminators of PPAR-α agonists from non-PPAR-α agonists
| |||||
|---|---|---|---|---|---|
| Classical toxicology parameters | |||||
| AUC | p-value | C.I. | Fold change | ||
| 1 | Liver to body weight | 0.79 | 1.02E-03 | 0.63–0.91 | 0.61 |
| 2 | Cholesterol | 0.7 | 3.76E-02 | 0.54–0.86 | −0.35 |
| 3 | AST | 0.68 | 3.71E-01 | 0.54–0.82 | 0.24 |
| 4 | Bile acids | 0.67 | 1.54E-02 | 0.51–0.83 | 0.9 |
| 5 | ALT | 0.63 | 6.35E-01 | 0.46–0.78 | 0.33 |
| 6 | Combined | 0.79 | 0.54–0.96 | ||
| Gas chromatography-mass spectrometry | |||||
| 1 | eicosatrienoic acid 20:3 (n-3) | 0.94 | 6.11E-07 | 0.88–0.99 | 0.38 |
| 2 | γ-linoleic acid 18:3 (n-6) | 0.87 | 1.78E-04 | 0.77–0.95 | 0.12 |
| 3 | α-linoleic acid 18:3 (n-3) | 0.87 | 1.46E-03 | 0.75–0.95 | −0.09 |
| 4 | linoleic acid 18:2 (n-6) | 0.78 | 3.55E-02 | 0.63–0.91 | −0.3 |
| 5 | arachidonic acid 20:4 (n-6) | 0.76 | 2.72E-02 | 0.60–0.90 | 0.3 |
| 6 | Combined | 0.91 | 0.79–0.98 | ||
| Flow injection-mass spectrometry | |||||
| 1 | 20:3 (m/z 305.5) | 0.95 | 2.28E-08 | 0.89–0.99 | 0.54 |
| 2 | PI(18:0_22:4) (m/z 913.75) | 0.93 | 3.65E-07 | 0.84–0.98 | −0.87 |
| 3 | PI(16:0_18:1) (m/z 835.75) | 0.92 | 1.06E-07 | 0.82–0.98 | 0.68 |
| 4 | 18:2 (m/z 279.42) | 0.89 | 1.22E-05 | 0.76–0.97 | −0.62 |
| 5 | 18:1 (m/z 281.42) | 0.86 | 3.62E-05 | 0.77–0.94 | 0.4 |
| 6 | Combined | 1 | 1 | ||
| Liquid chromatography-mass spectrometry | |||||
| 1 | TG(48:6) (m/z 812.661) | 0.91 | 5.51E-08 | 0.83–0.98 | 1.19 |
| 2 | PE(28:3) (m/z 647.464) | 0.9 | 5.16E-04 | 0.81–0.97 | −2.01 |
| 3 | TG(51:7) (m/z 852.719) | 0.9 | 7.70E-05 | 0.81–0.97 | −1.49 |
| 4 | PC(36:6) (m/z795.635) | 0.9 | 3.63E-07 | 0.80–0.96 | 3.85 |
| 5 | PC(47:2) (m/z 830.575) | 0.9 | 1.73E-07 | 0.78–0.97 | 2.47 |
| 6 | Combined | 1 | 0.98–1 | ||
Performance of potential biomarkers based on receiver operating characteristic (ROC) curves. Biomarkers were assessed for the discrimination of non-genotoxic carcinogens (NGCs) from non-NGCs (A) and the discrimination of peroxisome proliferator activated receptor-α (PPAR-α) agonists form other compounds (B). The utility of a biomarker based on its AUC (area under curve) was used according to the following value ranges: 0.9–1.0 = excellent, 0.8–0.9 = good, 0.7–0.8 fair, 0.6–0.7 = poor. Abbreviations: ALP, alkaline phosphatase; AST, aspartate aminotransferase; C.I. confidence interval; GGT, gamma-glutamyltransferase; LPA, lysophosphatidic acid; LPC, lyso-phosphocholine; LPI, lysophosphatidylinositol; PC, phosphocholine; PE phosphoethanolamine; TG, triacylglycerol.
ROC analyses were conducted on an assay by assay basis using classical biochemical parameters and those methods which were able to separate NGCs from non-NGCs (i.e., GC-MS, FI-Ms and LC-MS). Classical biochemical parameters were poor predictors of NGCs achieving AUCs in the range of 0.5 to 0.75. Total fatty acid content has higher, but still low predictive ability between 0.75 and 0.79 AUC values and predictive ability stays low even with multivariate ROC. Individual free fatty acids and phospholipids measured FI-MS were also poor predictors with AUCs between 0.66 and 0.75. However, combined markers by multivariate ROC analysis achieved good predictor ability of AUC = 0.87 (Figure 5 a).
Figure 5. Receiver operating characteristic (ROC) analysis discriminating non-genotoxic carcinogens (NGCs) from non-NGCs.
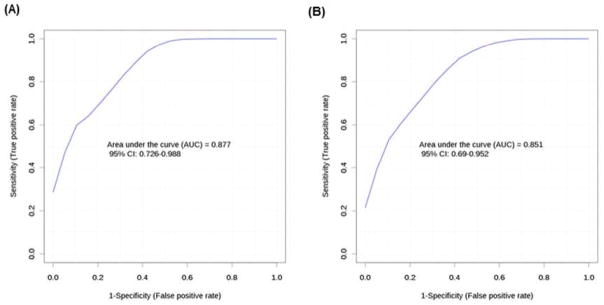
Free fatty acids and phospholipids measured by flow injection-mass spectrometry (FI-MS) achieved good predictor ability and the area under the curve (AUC) equalled 0.88 when the top five best predictors were combined (A). While the top five phospholipid and triacylglycerol markers in combination measured by liquid chromatography mass spectrometry (LC-MS) achieved AUC = 0.85 (B).
Phospholipids and triacylglycerols measured by LC-MS provided the best predictors with AUC ranging from 0.79 to 0.82 for the top five metabolites, the markers in combination achieving AUC = 0.85 (Figure 5 b).
Predicting PPAR-α induction
The predictive capability of PPAR-α induction of the combined dataset was assessed on days 7 and 28 by building training sets where group membership was retained and subsequently predicted (Table 2). On balance the best predictions were made using the day 28 dataset. PPAR-α agonists were correctly assigned 90% ± 5% of the time, whereas non PPAR-α agonists were correctly assigned 95% ± 2% of the time.
Predictability of the individual compounds was also assessed (Table 2). The overall quality of the predictions suggests that there are differences between the effects of the PPAR-α agonists. DEHA was the best predicted compound and was correctly assigned to be a PPAR-α agonist 100% of the time on day 7. CINN was poorly predicted with correct predictions ranging from 54% to 84% from day 7 to day 28.
The performance of metabolites to discriminate between PPAR-α agonists (DEHP, Cinn DEHA) from all other treated groups (PB, CA, Mon, MP HCl, BP, DETU, 2-AAF) was also tested using ROC analysis (Table 3).
Classical toxicology parameters were poor predictors producing areas under ROC curves between 0.6–0.79 which could not be improved upon by multivariate ROC approach. GC-MS data AUCs were in the range of 0.76–0.94 (fair to good predictors). The top 5 best predictive metabolites were eicosatrienoic 20:3 (n-3), γ-linoleic 18:3 (n-6), α-linoleic 18:3 (n-3), linoleic 18:2 (n-6) and arachidonic acids 20:4 (n-6). The combination of metabolites improved the AUC to 0.907. FI-MS data produced the highest range of AUC values between 0.86–0.95 for the top five discriminators. In agreement with the GC-MS data fatty acids 20:3 and 18:2 are amongst the top five discriminators. Multivariate ROC using a combination of these metabolites achieved maximum AUC value (AUC=1). Finally LC-MS data also achieved high AUC values between 0.89–0.91 for the top five metabolites, a combination of which achieved AUC 0.995.
DISCUSSION
The identification of NGCs in safety assessment in the pharmaceutical and agrochemical industries is costly, lengthy and animal intensive. There has been great interest in applying–omic technologies to this problem to identify potential signatures associated with NGCs which could streamline the process to reduce costs and the time requirements by eliminating carcinogenic compounds from development before embarking on lengthy bioassays. In this study we have applied a combined metabolomics/metabonomics and lipidomic screen to investigate metabolic changes induced by either NGCs or non-NGCs in a study to mimic 28- and 91-day toxicology studies in safety assessment. Compounds were administered at their maximum tolerated dose levels in order to reflect the known carcinogenic and toxicity effects4, 27–40. The described approach demonstrated metabolomics to be a useful tool for further elucidating liver toxicity, and evaluating and exploring mode of action specific effects of molecules. In addition we have identified a signature of metabolomics and lipidomic changes that characterise NGCs from non-NGCs in the present study.
Body and liver weights
The increases in liver weight observed from the majority of compounds were as expected from the literature4, 32, 37, 41. While a number of NGCs produce sustained increases in liver weight, non-NGC which were also associated with increased liver weight were deliberately chosen for this study. This was to avoid the situation where the metabolic changes detected between the NGCs and non-NGCs were simply markers of liver growth. Thus, in the ROC analyses increase in liver weight was poorly predictive (AUC=0.619; confidence interval=0.466–0.772) equivalent of predictions achievable by chance as would be expected for our compound selection. The decreases in body weight due to decreased food consumption observed in rats exposed to CINN and DEHA were not anticipated and meant that comparisons between the NGCs and non-NGCs could not be made at day 91. However, this did offer the opportunity to study the reversibility of exposure to DEHA, which has not previously been reported.
Histopathology and plasma clinical biochemistry
Overall the changes in the plasma clinical biochemistry were small and the compounds demonstrated the expected hepatic effects known to occur following sub-chronic dietary administration.
MP HCL was the only compound for which evidence of necrosis/apoptosis was observed following histopathological examination. The increased levels of glutamate dehydrogenase, aspartate aminotransferase, and alkaline aminotransferase reflected these changes in accordance with previously observed effects of MP HCl 42.
Pharmacological mode of action and compound specific effects
The largest effects in the datasets from all the analytical platforms were compound specific, and in particular the three PPAR-α agonists produced similar profiles which were distinct from the other groups as demonstrated by GC-MS, FI-MS and LC-MS lipidomic datasets. This concurs with findings in transcriptomic studies designed to look for characteristic signatures of NGCs which found distinctive profiles associated with peroxisome proliferators dominated the effects of other compounds8, 10, 43. However, the pharmacological mode of action specific effects do not correspond to the hepatocarcinogenicity of a compound as the PPAR-α agonists subgroups contain both non-genotoxic hepatocarcinogens and non-mutagenic non-hepatocarcinogens.
The dominating effects of PPAR-α agonists reflect the major role that PPAR-α has in regulating central metabolism19. As measured by GC-MS DEHP, Cinn and DEHA all caused changes in fatty acids partially associated with the highly unsaturated fatty acid (HUFA) pathways, especially arachidonic (20:4 n-6, increased) and docosahexaenoic acid (22:6 n-3, decreased) synthesis. Decreases of dietary essential fatty acids linoleic acid (18:2 n-6) and α-linolenic (18:3 n-3) acid following exposure to PPAR-α agonists is consistent with research which reported Δ6 desaturase (D6D) to be markedly induced by PPAR-α 44 and it is also well established that the synthesis of both n-6 and n-3 HUFA is catalyzed by the same D6D 45. Other metabolites of n-6 (linoleic acid) increased in concentration while n-3 (α-linoleic acid) metabolites decreased. There is considerable evidence on the differential roles of n-3 and n-6 fatty acids. While n-3 polyunsaturated fatty acids (PUFAs) have anti-inflammatory properties46 and reduce mRNA levels of c-myc oncogene 47, the n-6 PUFAs have the opposite effects. This is also in line with research showing overexpression of c-myc due to PPAR-α induction48. Thus, n-6 PUFAs and n-3 PUFAs may promote and suppress carcinogenesis, respectively. Overproduction of arachidonic acid (20:4 n-6) measured may also be linked to tumor initiation by arachidonic acid-derived eicosanoids that are known to cause inflammation49.
Carnitine and acylcarnitine concentrations also changed markedly due exposure to PPAR-α agonists. These were expected results as PPAR-α agonists are known to increase peroxisomal β-oxidation of fatty acids (Latruffe and Vamecq, 1997; Mandard et al., 2004). However, increased β-oxidation cannot be completely attributed to the induction in peroxisomal enzymes as the mitochondrion also contains all the enzymes necessary for fatty acid β-oxidation and these enzymes are targets of PPAR-α. The increased capacity for the breakdown of fatty acids was also indicated by decreased relative concentrations of triacylglycerols (TGs) as well as phospholipids (PLs) in the case of all three PPAR-α agonists.
In general exposure to Cinn had a reduced impact on the relative concentrations of altered metabolites in all lipidomic experiments compared to DEHP and DEHA, which could be reflective of the fact that Cinn is a weaker peroxisome proliferator50.
The PPAR-α agonist DEHA group showed decreased body weight in response to treatment and the animals were returned to control diet after five weeks. This presented the opportunity to investigate whether its effects are reversible. DEHA causes an increase in relative liver weight and it has previously been shown that increase is sustained if exposure is continued for 13 weeks 35. For the PPAR-α agonist DEHP the effects of exposure (increased liver weight, peroxisomal β-oxidation, inhibition of gap junction intercellular communication and changes in plasma clinical chemistry) have been shown to be reversible on discontinuation of treatment51. The effects of exposure to the PPAR-α agonist DEHA also showed reversibility. The effects of 5 weeks dietary exposure to DEHA on relative liver weight, plasma cholesterol and triglycerides all reversed and there were no significant differences from control values when DEHA was withdrawn. The metabolic profile of the liver also showed reversibility on all platforms studied.
PB and BP also have shared mode of action both causing induction of cytochrome P450s37. However, this was not reflected in their co-clustering in many of the multivariate models produced of the different analytical platforms. Cytochrome P450s are located on the endoplasmic reticulum (ER) and PB is known to induce proliferation of the ER. In the present study the PB group, or indeed the combined PB and BP group, was not associated with major alterations in the lipidome. Minor changes were detected in the FI-MS lipid data, and both PB and BP caused decreases in phosphoinositols and increases in phosphocholines and phosphoethanolamines by day 91. This suggests that PB and BP have similar effects on the phospholipid content of the liver in a time dependent manner, possibly due to the induction of cytochrome P450s and the associated changes in the ER.
MP HCl caused strong metabolic alterations that allowed its ready classification in multivariate models. MP HCl causes liver toxicity and regenerative hyperplasia. It has been suggested that it causes liver mitochondrial proliferation in the rat and has high binding affinity for mitochondrial proteins52. In our study, the carnitine profile remained the same and did not indicate changes in mitochondrial biogenesis or increased mitochondrial fatty acid β-oxidation. Increased relative concentrations of TAGs and decreased concentrations of PCs also suggest against any increase in β-oxidation and mitochondrial proliferation. However, TG increase agree with studies that show micro vesicular lipid droplet formation in response to MP HCl53. Decreased concentrations of PCs measured indicate breakdown of PCs which suggest enhanced choline metabolism. Enhanced choline metabolism has previously been reported by Craig et al.54 who measured increased concentrations of urine dimethylglycine (formed during choline catabolism) and trimethylamine oxide (formed by the oxidation of trimethylamine, the product of choline degradation) after MP HCl treatment of rats.
The mode of action by which CA causes hepatotoxicity is unknown, although it has been found to induce replicative DNA synthesis55 and is considered a NGC56. To our knowledge metabolic effects of this compound have not been documented previously, but in the present study CA caused strong responses across all metabolic platforms, characterised by opposing effects compared to the PPAR-α agonists. CA increased dietary essential fatty acids linoleic acid (18:2, n-6) and α-linolenic acid (18:3, n-3) concentrations and decreased concentrations of arachidonic acid (20:4, n-6) and eicosapentaenoic acid (20:5, n-3), indicative of decreased 6 desaturase activity. In contrast to PPAR-α agonist induced effects, the peroxisome β-oxidation end product docosahexaenoic acid (DHA, 26:6 n-3) was decreased, indicating decreased peroxisomal activity. At the same time however, a time dependent increase in short-medium and long chain carnitine concentrations suggested an increase in mitochondrial β -oxidation, which is the only response common to the PPAR-α agonists.
The mode of action of Mon is also unknown, although other urea herbicides such as diuron are suggested to act by causing cell death and consequently regenerative cell proliferation that leads to carcinogenesis57. Changes in total lipid content were similar to MP HCl, associated with increased TAG and decreased PC concentrations. There were no changes detected in total carnitine concentrations, although the short to medium chain carnitine content decreased from day 7 to day 91 indicative of a slight up regulation in short- and medium-chain acyl-CoA dehydrogenase activity.
Potential biomarkers of NGCs and PPAR-α induction
A central aim of this study was to investigate whether metabolomics and lipidomic changes could be used to discriminate NGCs from non-NGCs. A number of previous studies have attempted to determine biomarker signatures associated with NGCs. Both proteomics and transcriptomics have been previously applied to studies of NGCs8, 13.
FI-MS marker lipids detected in negative ESI mode in combination (22:4, LPC(18:1), PC(18:1_18:2), PE(18:0_20:4) and LPI(16:0)) (Table 3) predicted non-genotoxic carcinogenic potential across the entire dataset with the best accuracy (AUC=0.88) with individual markers ranging from AUC 0.75–0.66. Whereas the lipid LC-MS data (positive ESI mode) of PLs and TGs in combination were slightly less accurate (AUC=0.85), however, the diagnostic ability of the markers individually were better (AUC=0.8–0.82). To date there have been relatively few studies of lipid metabolism in liver cancer models. Beyoglu and colleagues have previously used GC-MS to observe changes in linoleic acid, palmitic acid, 1-stearoylglycerol and 1-palmitoylglycerol associated with human hepatocellular carcinoma58. Palmitate containing lipids have previously been implicated in aggressive breast tumours, being correlated with cell proliferation and tumour growth59. However, it should be noted that the present lipid changes detected in our study pre-date the formation of any tumourous material and most likely are associated with the very earliest stages of non-genotoxic carcinogenicity.
In terms of predicting mode of action, lipid classifiers yielded 100% prediction accuracies for predicting actual PPAR-α induction and false positive prediction was almost completely absent across the entire dataset. The best markers of PPAR-α induction were free eicosatrienoic acid (20:3 n-3) and phosphoinositol (18:0_22:4), both detected by FI-MS, and achieved AUC 0.95 and 0.93, respectively. Combination of the best predictive metabolites measured by FI-MS achieved an AUC of 1. The ability of metabolomics to identify PPAR-α agonists with such high sensitivity and specificity reflects the important metabolic role the receptor plays within the liver. However, the capability to classify NGCs from non-NGCs was hindered by this large mode of action effect as the PPAR-α agonist group contained both NGCs and non-NGCs which co-clustered when we performed unsupervised analysis such as PCA.
It should be noted that there is a distinct difference between human PPAR-α and rodent forms of the gene in terms of the induction of non genotoxic carcinogenicity. Morimura and colleagues demonstrated that the human form of PPAR-α expressed in a murine PPAR-α knock out mouse restored normal metabolic responses to PPAR-α agonists but were remarkable resistant to non genotoxic carcinogenicity60. Such mice could be used to determine metabolic and lipdomic markers associated with NGCs, although it should be noted in the current study the PPAR-α agonist group consisted of both NGCs and non-NGCs, and so models describing differences between these two classes should not have been influenced by purely metabolic PPAR-α agonists effects.
In the current study only 10 compounds were examined and as such should be viewed as a proof of concept study. The models distinguish NGCs from non-NGCs using metabolomics suggests that the predictions of the models could be improved by using a larger dataset covering more compounds and modes of actions (MOAs).
Evaluation of carcinogenesis in relation to PPAR-α dependent and PPAR-α independent pathways would also help understand differences in susceptibility of various species, where the major factor is considered to be caused by differences in PPAR-α expression61.
Practical considerations
In this study, the assessments of the lipidome by various analytical techniques has consistently shown similar patterns which were caused in a compound and mode of action specific manner. This consistency across analytical platforms strengthens the validity and robustness of our approach. The best performing metabolic biomarkers for the separation of NGCs and non-NGCs were measured by intact lipid profiling methods FI-MS and LC-MS, followed by the total fatty acid measurements of GC-MS.
Implementation of lipidomic screening methods by FI-MS could provide a rapid and feasible approach for the screening of biomarkers as it provides the simplest laboratory technology for intact lipid analysis. FI-MS does not require derivatisation methods like techniques such as GC-MS nor does it require the technical expertise of a separation scientist. Despite this, there remains a general limited knowledge about the function of most intact lipid species which makes interpretation of the data most challenging.
The above discussion has focused on methods that can map molecular events, help to elucidate the MOA of a given substance and ultimately help to improve testing strategies for NGC screening. Such approaches reported previously, however, are scarcely applied. One of the reasons for this is perhaps the traditional view on MOA frameworks which represent a linear cause and effect paradigm. Our current understanding of toxic response (as reflected by -omics approaches) however, defines a complex, nonlinear adaptive system requiring integration of multiple biological mechanisms62. Applying multivariate ROC analysis63 could be a useful platform in bridging the gap between the concepts of linear key events and nonlinear complex mechanism and take -omics technologies more accessible, particularly when internal company decisions are made on whether compounds should be taken forward into the expensive long term animal studies.
Monitoring of multiple biomarkers and retaining complexity by using multivariate ROC analysis is perhaps particularly important in the case of NGCs which have a wide array of MOAs. This is illustrated well by this study, where even though only 10 compounds containing 5 NGCs were profiled, they represented 5 different MOAs. Although the underlying key events may be common, a single biomarker is unlikely to be able to accurately predict toxicity outcome across all MOAs.
A significant challenge remains in the interpretation of the data which is greatly impeded by the general lack of knowledge about the biological role of many of the molecules measured, particularly for the lipidomics datasets. Combining various -omic disciplines to include transcriptomics and proteomics datasets alongside metabolomics/metabonomics, and better pathway mapping tools will help improve biological understanding of species of unknown functions and the physiological implications of the results. Although it has been argued that metabolomics approach yield faster and cheaper results than transcriptomics and proteomics, these tools are increasingly used alongside one another.
We have previously used transcriptomics and metabolomics to understand orotic acid induced fatty liver disease64–65 and phenobarbital induced NGC24. As for predictability, as we are still unclear about the biological functions of most genes, proteins and metabolites involved in NGC, these techniques are believed to be complimentary methods rather competing screening tools.
Conclusions
This study has shown that metabolomic profiling of the lipidome, reflecting sub-cellular changes, has utility in elucidating and understanding toxicity and carcinogenic events, and also has potential in contributing in a design of a new battery of screening methods. Such -omic signatures for NGCs may provide a significant financial and time saving in assessing compounds for non genotoxic carcinogenicity. Further work, including validation, exposure studies and a dose response would help to better define the utility of this methodology.
Supplementary Material
Acknowledgments
The authors would like to thank Jackie Dow for her expertise in designing the test system, as well as Professor Andy Smith, the director of the Integrative Toxicology Training Partnership (ITTP) for the funding provided as part of a PhD studentship. JLG is funded by the Medical Research Council (UD99999906). Work in the JLG lab is funded by the BBSRC (BB/H013539/1), the Welcome Trust (093148/Z/10/Z) and the National Institute of Health (ES022186). ZA is a recipient of an MRC ITTP training PhD studentship.
Footnotes
Conflict of interest
The authors declare that they have no competing interests.
Supporting Information Available: This material is available free of charge via the Internet at http://pubs.acs.org.
References
- 1.Shaw IC, Jones HB. Mechanisms of non-genotoxic carcinogenesis. Trends in Pharmacological Sciences. 1994;15(3):89–93. doi: 10.1016/0165-6147(94)90284-4. [DOI] [PubMed] [Google Scholar]
- 2.Ramel C. Genotoxic and nongenotoxic carcinogens: mechanisms of action and testing strategies. IARC scientific publications. 1992;(116):195–209. [PubMed] [Google Scholar]
- 3.Hoenerhoff MJ, Hong HH, Ton T-v, Lahousse SA, Sills RC. A review of the molecular mechanisms of chemically induced neoplasia in rat and mouse models in National Toxicology Program bioassays and their relevance to human cancer. Toxicologic Pathology. 2009;37(7):835–848. doi: 10.1177/0192623309351726. [DOI] [PMC free article] [PubMed] [Google Scholar]
- 4.Elcombe CR, Odum J, Foster JR, Stone S, Hasmall S, Soames AR, Kimber I, Ashby J. Prediction of Rodent Nongenotoxic Carcinogenesis: Evaluation of Biochemical and Tissue Changes in Rodents Following Exposure to Nine Nongenotoxic NTP Carcinogens. Environmental Health Perspectives. 2002;110(4):363–375. doi: 10.1289/ehp.02110363. [DOI] [PMC free article] [PubMed] [Google Scholar]
- 5.Allen DG, Pearse G, Haseman JK, Maronpot RR. Prediction of rodent carcinogenesis: An evaluation of prechronic liver lesions as forecasters of liver tumors in NTP carcinogenicity studies. Toxicologic pathology. 2004;32(4):393–401. doi: 10.1080/01926230490440934. [DOI] [PubMed] [Google Scholar]
- 6.Magkoufopoulou C, Claessen SMH, Tsamou M, Jennen DGJ, Kleinjans JCS, van Delft JHM. A transcriptomics-based in vitro assay for predicting chemical genotoxicity in vivo. Carcinogenesis. 2012;33(7):1421–1429. doi: 10.1093/carcin/bgs182. [DOI] [PubMed] [Google Scholar]
- 7.Suenaga K, Takasawa H, Watanabe T, Wako Y, Suzuki T, Hamada S, Furihata C. Differential gene expression profiling between genotoxic and non-genotoxic hepatocarcinogens in young rat liver determined by quantitative real-time PCR and principal component analysis. Mutation Research. 2013;751(1):73–83. doi: 10.1016/j.mrgentox.2012.11.003. [DOI] [PubMed] [Google Scholar]
- 8.Uehara T, Minowa Y, Morikawa Y, Kondo C, Maruyama T, Kato I, Nakatsu N, Igarashi Y, Ono A, Hayashi H, Mitsumori K, Yamada H, Ohno Y, Urushidani T. Prediction model of potential hepatocarcinogenicity of rat hepatocarcinogens using a large-scale toxicogenomics database. Toxicology and applied pharmacology. 2011;255(3):297–306. doi: 10.1016/j.taap.2011.07.001. [DOI] [PubMed] [Google Scholar]
- 9.Ellinger-Ziegelbauer H, Stuart B, Wahle B, Bomann W, Ahr HJ. Comparison of the expression profiles induced by genotoxic and nongenotoxic carcinogens in rat liver. Mutation Research. 2005;575(1–2):61–84. doi: 10.1016/j.mrfmmm.2005.02.004. [DOI] [PubMed] [Google Scholar]
- 10.Nie AY, McMillian M, Parker JB, Leone A, Bryant S, Yieh L, Bittner A, Nelson J, Carmen A, Wan J, Lord PG. Predictive toxicogenomics approaches reveal underlying molecular mechanisms of nongenotoxic carcinogenicity. Molecular Carcinogenesis. 2006;45(12):914–933. doi: 10.1002/mc.20205. [DOI] [PubMed] [Google Scholar]
- 11.Fielden MR, Nie A, McMillian M, Elangbam CS, Trela BA, Yang Y, Dunn RT, Dragan Y, Fransson-Stehen R, Bogdanffy M. Interlaboratory evaluation of genomic signatures for predicting carcinogenicity in the rat. Toxicological Sciences. 2008;103(1):28–34. doi: 10.1093/toxsci/kfn022. [DOI] [PubMed] [Google Scholar]
- 12.Ellinger-Ziegelbauer H, Fostel JM, Aruga C, Bauer D, Boitier E, Deng S, Dickinson D, Le Fevre AC, Fornace AJ, Jr, Grenet O, Gu Y, Hoflack JC, Shiiyama M, Smith R, Snyder RD, Spire C, Tanaka G, Aubrecht J. Characterization and interlaboratory comparison of a gene expression signature for differentiating genotoxic mechanisms. Toxicological Sciences: An Official Journal of the Society of Toxicology. 2009;110(2):341–352. doi: 10.1093/toxsci/kfp103. [DOI] [PMC free article] [PubMed] [Google Scholar]
- 13.Yamanaka H, Yakabe Y, Saito K, Sekijima M, Shirai T. Quantitative proteomic analysis of rat liver for carcinogenicity prediction in a 28-day repeated dose study. Proteomics. 2007;7(5):781–795. doi: 10.1002/pmic.200600235. [DOI] [PubMed] [Google Scholar]
- 14.Koufaris C, Wright J, Currie RA, Gooderham NJ. Hepatic microRNA profiles offer predictive and mechanistic insights after exposure to genotoxic and epigenetic hepatocarcinogens. Toxicological Sciences: An Official Journal of the Society of Toxicology. 2012;128(2):532–543. doi: 10.1093/toxsci/kfs170. [DOI] [PubMed] [Google Scholar]
- 15.Huang W, Zhang J, Washington M, Liu J, Parant JM, Lozano G, Moore DD. Xenobiotic stress induces hepatomegaly and liver tumors via the nuclear receptor constitutive androstane receptor. Molecular Endocrinology (Baltimore, Md) 2005;19(6):1646–1653. doi: 10.1210/me.2004-0520. [DOI] [PubMed] [Google Scholar]
- 16.Gonzalez FJ, Shah YM. PPAR [alpha]: mechanism of species differences and hepatocarcinogenesis of peroxisome proliferators. Toxicology. 2008;246(1):2–8. doi: 10.1016/j.tox.2007.09.030. [DOI] [PubMed] [Google Scholar]
- 17.Hall AP, Elcombe CR, Foster JR, Harada T, Kaufmann W, Knippel A, Küttler K, Malarkey DE, Maronpot RR, Nishikawa A, Nolte T, Schulte A, Strauss V, York MJ. Liver hypertrophy: a review of adaptive (adverse and non-adverse) changes--conclusions from the 3rd International ESTP Expert Workshop. Toxicologic Pathology. 2012;40(7):971–994. doi: 10.1177/0192623312448935. [DOI] [PubMed] [Google Scholar]
- 18.Shah I, Houck K, Judson RS, Kavlock RJ, Martin MT, Reif DM, Wambaugh J, Dix DJ. Using nuclear receptor activity to stratify hepatocarcinogens. PLoS ONE. 2011;6(2) doi: 10.1371/journal.pone.0014584. [DOI] [PMC free article] [PubMed] [Google Scholar]
- 19.Ament Z, Masoodi M, Griffin JL. Applications of metabolomics for understanding the action of peroxisome proliferator-activated receptors (PPARs) in diabetes, obesity and cancer. Genome Medicine. 2012;4(4) doi: 10.1186/gm331. [DOI] [PMC free article] [PubMed] [Google Scholar]
- 20.Omiecinski CJ, Heuvel JPV, Perdew GH, Peters JM. Xenobiotic Metabolism, Disposition, and Regulation by Receptors: From Biochemical Phenomenon to Predictors of Major Toxicities. Toxicological Sciences. 2011;120(suppl 1):S49–S75. doi: 10.1093/toxsci/kfq338. [DOI] [PMC free article] [PubMed] [Google Scholar]
- 21.Bucher JR. The National Toxicology Program rodent bioassay: designs, interpretations, and scientific contributions. Annals of the New York Academy of Sciences. 2002;982:198–207. doi: 10.1111/j.1749-6632.2002.tb04934.x. [DOI] [PubMed] [Google Scholar]
- 22.Volinsky R, Kinnunen PKJ. Oxidized phosphatidylcholines in membrane-level cellular signaling: from biophysics to physiology and molecular pathology. The FEBS journal. 2013 doi: 10.1111/febs.12247. [DOI] [PubMed] [Google Scholar]
- 23.Le Belle JE, Harris NG, Williams SR, Bhakoo KK. A comparison of cell and tissue extraction techniques using high-resolution 1H-NMR spectroscopy. NMR in Biomedicine. 2002;15(1):37–44. doi: 10.1002/nbm.740. [DOI] [PubMed] [Google Scholar]
- 24.Waterman C, Currie R, Cottrell L, Dow J, Wright J, Waterfield C, Griffin J. An integrated functional genomic study of acute phenobarbital exposure in the rat. BMC Genomics. 2010;11(1):9–9. doi: 10.1186/1471-2164-11-9. [DOI] [PMC free article] [PubMed] [Google Scholar]
- 25.West JA, Griffin JL. A metabolomic investigation of a model of heart failure using targeted tandem mass spectrometry. American Society for Mass Spectrometry 2012 meeting abstracts. 2012:88. [Google Scholar]
- 26.Eriksson L, Johansson E, Kettaneh-Wold N, Wold S. Introduction to multi-and megavariate data analysis using projection methods (PCA & PLS) Umeå. Sweden: Umetrics AB; 1999. [Google Scholar]
- 27.NTP. NTP Toxicology and Carcinogenesis Studies of Chlorendic Acid (CAS No. 115-28-6) in F344/N Rats and B6C3F1 Mice (Feed Studies) National Toxicology Program Technical Report Series. 1987;304:1–225. [PubMed] [Google Scholar]
- 28.NTP. Carcinogenesis Bioassay of Di(2-ethylhexyl)phthalate (CAS No. 117-81-7) in F344 Rats B6C3F1 and Mice (Feed Studies) National Toxicology Program Technical Report Series. 1982;217:1–127. [PubMed] [Google Scholar]
- 29.Marsman DS, Cattley RC, Conway JG, Popp JA. Relationship of hepatic peroxisome proliferation and replicative DNA synthesis to the hepatocarcinogenicity of the peroxisome proliferators di(2-ethylhexyl)phthalate and [4-chloro-6-(2,3-xylidino)-2-pyrimidinylthio]acetic acid (Wy-14,643) in rats. Cancer Research. 1988;48(23):6739–6744. [PubMed] [Google Scholar]
- 30.NTP. NTP Toxicology and Carcinogenesis Studies of Monuron (CAS No. 150-68-5) in F344/N Rats and B6C3F1 Mice (Feed Studies) National Toxicology Program Technical Report Series. 1988;266:1–166. [PubMed] [Google Scholar]
- 31.Lijinsky W. Chronic toxicity tests of pyrilamine maleate and methapyrilene hydrochloride in F344 rats. Food and chemical toxicology: an international journal published for the British Industrial Biological Research Association. 1984;22(1):27–30. doi: 10.1016/0278-6915(84)90048-6. [DOI] [PubMed] [Google Scholar]
- 32.NTP. NTP Hepatotoxicity Studies of the Liver Carcinogen Methapyrilene Hydrochloride (CAS No. 135-23-9) Administered in Feed to Male F344/N Rats. Toxicity Report Series. 2000;46:1–C7. [PubMed] [Google Scholar]
- 33.Ogiso T, Tatematsu M, Tamano S, Tsuda H, Ito N. Comparative effects of carcinogens on the induction of placental glutathione S-transferase-positive liver nodules in a short-term assay and of hepatocellular carcinomas in a long-term assay. Toxicologic Pathology. 1985;13(4):257–265. doi: 10.1177/019262338501300402. [DOI] [PubMed] [Google Scholar]
- 34.NTP. Carcinogenesis Bioassay of Di(2-ethylhexyl)adipate (CAS No. 103-23-1) in F344 Rats and B6C3F1 Mice (Feed Study) National Toxicology Program Technical Report Series. 1982;212:1–121. [PubMed] [Google Scholar]
- 35.Lake BG, Price RJ, Cunninghame ME, Walters DG. Comparison of the effects of di-(2-ethylhexyl)adipate on hepatic peroxisome proliferation and cell replication in the rat and mouse. Toxicology. 1997;123(3):217–226. doi: 10.1016/s0300-483x(97)00125-x. [DOI] [PubMed] [Google Scholar]
- 36.NTP. Toxicology and carcinogenesis studies of benzophenone (CAS No. 119-61-9) in F344/N rats and B6C3F1 mice (feed studies) National Toxicology Program Technical Report Series. 2006;(533):1–264. [PubMed] [Google Scholar]
- 37.Chhabra RS. NTP technical report on the toxicity studies of benzophenone (CAS No. 119-61-9). Administered in feed to F344/N rats and B6C3F mice. Toxicity Report Series. 2000;(61):1–53. A1–13. [PubMed] [Google Scholar]
- 38.NCI. Bioassay of N, N′-diethylthiourea for possible carcinogenicity. National Cancer Institute carcinogenesis technical report series. 1979;149:1–103. [PubMed] [Google Scholar]
- 39.Butler WH. Long-term effects of phenobarbitone-Na on male Fischer rats. British journal of cancer. 1978;37(3):418–423. doi: 10.1038/bjc.1978.62. [DOI] [PMC free article] [PubMed] [Google Scholar]
- 40.Kolaja KL, Stevenson DE, Johnson JT, Walborg EF, Klaunig JE. Subchronic Effects of Dieldrin and Phenobarbital on Hepatic DNA Synthesis in Mice and Rats. Toxicol Sci. 1996;29(2):219–228. doi: 10.1006/faat.1996.0025. [DOI] [PubMed] [Google Scholar]
- 41.Lake BG, Price RJ, Cunninghame ME, Walters DG. Comparison of the effects of cinnamyl anthranilate on hepatic peroxisome proliferation and cell replication in the rat and mouse. Fundamental and applied toxicology: official journal of the Society of Toxicology. 1997;39(1):60–66. doi: 10.1006/faat.1997.2340. [DOI] [PubMed] [Google Scholar]
- 42.Waring JF, Ulrich RG, Flint N, Morfitt D, Kalkuhl A, Staedtler F, Lawton M, Beekman JM, Suter L. Interlaboratory evaluation of rat hepatic gene expression changes induced by methapyrilene. Environmental Health Perspectives. 2004;112(4):439–448. doi: 10.1289/ehp.6643. [DOI] [PMC free article] [PubMed] [Google Scholar]
- 43.Fielden MR, Brennan R, Gollub J. A gene expression biomarker provides early prediction and mechanistic assessment of hepatic tumor induction by nongenotoxic chemicals. Toxicological Sciences: An Official Journal of the Society of Toxicology. 2007;99(1):90–100. doi: 10.1093/toxsci/kfm156. [DOI] [PubMed] [Google Scholar]
- 44.Kawashima Y, Musoh K, Kozuka H. Peroxisome proliferators enhance linoleic acid metabolism in rat liver. Increased biosynthesis of omega 6 polyunsaturated fatty acids. The Journal of Biological Chemistry. 1990;265(16):9170–9175. [PubMed] [Google Scholar]
- 45.Cho HP, Nakamura MT, Clarke SD. Cloning, Expression, and Nutritional Regulation of the Mammalian -6 Desaturase. Journal of Biological Chemistry. 1999;274(1):471–477. doi: 10.1074/jbc.274.1.471. [DOI] [PubMed] [Google Scholar]
- 46.Wall R, Ross RP, Fitzgerald GF, Stanton C. Fatty acids from fish: the anti-inflammatory potential of long-chain omega-3 fatty acids. Nutrition Reviews. 2010;68(5):280–289. doi: 10.1111/j.1753-4887.2010.00287.x. [DOI] [PubMed] [Google Scholar]
- 47.Fernandes G, Chandrasekar B, Luan X, Troyer DA. Modulation of antioxidant enzymes and programmed cell death by n-3 fatty acids. Lipids. 1996;31(1):S91–S96. doi: 10.1007/BF02637058. [DOI] [PubMed] [Google Scholar]
- 48.Miller RT, Glover SE, Stewart WS, Corton JC, Popp JA, Cattley RC. Effect on the expression of c-met, c-myc and PPAR-a in liver and liver tumors from rats chronically exposed to the hepatocarcinogenic peroxisome proliferator WY-14, 643. Carcinogenesis. 1996;17(6):1337–1341. doi: 10.1093/carcin/17.6.1337. [DOI] [PubMed] [Google Scholar]
- 49.Larsson SC, Kumlin M, Ingelman-Sundberg M, Wolk A. Dietary long-chain n-3 fatty acids for the prevention of cancer: a review of potential mechanisms. The American journal of clinical nutrition. 2004;79(6):935–945. doi: 10.1093/ajcn/79.6.935. [DOI] [PubMed] [Google Scholar]
- 50.Viswalingam A, Caldwell J. Cinnamyl anthranilate causes coinduction of hepatic microsomal and peroxisomal enzymes in mouse but not rat. Toxicology and applied pharmacology. 1997;142(2):338–347. doi: 10.1006/taap.1996.8043. [DOI] [PubMed] [Google Scholar]
- 51.Isenberg JS, Kamendulis LM, Ackley DC, Smith JH, Pugh G, Jr, Lington AW, McKee RH, Klaunig JE. Reversibility and persistence of di-2-ethylhexyl phthalate (DEHP)- and phenobarbital-induced hepatocellular changes in rodents. Toxicological Sciences: An Official Journal of the Society of Toxicology. 2001;64(2):192–199. doi: 10.1093/toxsci/64.2.192. [DOI] [PubMed] [Google Scholar]
- 52.Richardson FC, Horn DM, Anderson NL. Dose-responses in rat hepatic protein modification and expression following exposure to the rat hepatocarcinogen methapyrilene. Carcinogenesis. 1994;15(2):325–329. doi: 10.1093/carcin/15.2.325. [DOI] [PubMed] [Google Scholar]
- 53.Hamadeh HK, Knight BL, Haugen AC, Sieber S, Amin RP, Bushel PR, Stoll R, Blanchard K, Jayadev S, Tennant RW, Cunningham ML, Afshari CA, Paules RS. Methapyrilene toxicity: anchorage of pathologic observations to gene expression alterations. Toxicologic Pathology. 2002;30(4):470–482. doi: 10.1080/01926230290105712. [DOI] [PubMed] [Google Scholar]
- 54.Craig A, Sidaway J, Holmes E, Orton T, Jackson D, Rowlinson R, Nickson J, Tonge R, Wilson I, Nicholson J. Systems toxicology: integrated genomic, proteomic and metabonomic analysis of methapyrilene induced hepatotoxicity in the rat. Journal of Proteome Research. 2006;5(7):1586–1601. doi: 10.1021/pr0503376. [DOI] [PubMed] [Google Scholar]
- 55.Uno Y, Takasawa H, Miyagawa M, Inoue Y, Murata T, Yoshikawa K. An in vivo-in vitro replicative DNA synthesis (RDS) test using rat hepatocytes as an early prediction assay for nongenotoxic hepatocarcinogens screening of 22 known positives and 25 noncarcinogens. Mutation Research/Genetic Toxicology. 1994;320(3):189–205. doi: 10.1016/0165-1218(94)90046-9. [DOI] [PubMed] [Google Scholar]
- 56.Tennant RW. A perspective on nonmutagenic mechanisms in carcinogenesis. Environmental Health Perspectives. 1993;101(Suppl 3) doi: 10.1289/ehp.93101s3231. [DOI] [PMC free article] [PubMed] [Google Scholar]
- 57.Nascimento MG, de Oliveira MLCS, Lima AS, de Camargo JLV. Effects of Diuron [3-(3,4-dichlorophenyl)-1,1-dimethylurea] on the urinary bladder of male Wistar rats. Toxicology. 2006;224(1–2):66–73. doi: 10.1016/j.tox.2006.04.029. [DOI] [PubMed] [Google Scholar]
- 58.BeyoNlu D, Imbeaud S, Maurhofer O, Bioulac-Sage P, Zucman-Rossi J, Dufour JF, Idle JR. Tissue metabolomics of hepatocellular carcinoma: tumor energy metabolism and the role of transcriptomic classification. Hepatology (Baltimore, Md) 2013;58(1):229–238. doi: 10.1002/hep.26350. [DOI] [PMC free article] [PubMed] [Google Scholar]
- 59.Hilvo M, Denkert C, Lehtinen L, Müller B, Brockmöller S, Seppänen-Laakso T, Budczies J, Bucher E, Yetukuri L, Castillo S, Berg E, Nygren H, Sysi-Aho M, Griffin JL, Fiehn O, Loibl S, Richter-Ehrenstein C, Radke C, Hyötyläinen T, Kallioniemi O, Iljin K, Oresic M. Novel theranostic opportunities offered by characterization of altered membrane lipid metabolism in breast cancer progression. Cancer Research. 2011;71(9):3236–3245. doi: 10.1158/0008-5472.CAN-10-3894. [DOI] [PubMed] [Google Scholar]
- 60.Morimura K, Cheung C, Ward JM, Reddy JK, Gonzalez FJ. Differential susceptibility of mice humanized for peroxisome proliferator-activated receptor alpha to Wy-14,643-induced liver tumorigenesis. Carcinogenesis. 2006;27(5):1074–1080. doi: 10.1093/carcin/bgi329. [DOI] [PMC free article] [PubMed] [Google Scholar]
- 61.Klaunig JE, Babich MA, Baetcke KP, Cook JC, Corton JC, David RM, DeLuca JG, Lai DY, McKee RH, Peters JM, Roberts RA, Fenner-Crisp PA. PPARalpha agonist-induced rodent tumors: modes of action and human relevance. Critical Reviews in Toxicology. 2003;33(6):655–780. doi: 10.1080/713608372. [DOI] [PubMed] [Google Scholar]
- 62.Ramos KS. Introduction to Molecular Toxicology. In: McQueen CA, editor. Comprehensive Toxicology. Vol. 2 Elsevier Ltd; 2010. [Google Scholar]
- 63.Xia J, Broadhurst DI, Wilson M, Wishart DS. Translational biomarker discovery in clinical metabolomics: an introductory tutorial. Metabolomics: Official journal of the Metabolomic Society. 2013;9(2):280–299. doi: 10.1007/s11306-012-0482-9. [DOI] [PMC free article] [PubMed] [Google Scholar]
- 64.Griffin JL, Bonney SA, Mann C, Hebbachi AM, Gibbons GF, Nicholson JK, Shoulders CC, Scott J. An integrated reverse functional genomic and metabolic approach to understanding orotic acid-induced fatty liver. Physiological Genomics. 2004;17(2):140–149. doi: 10.1152/physiolgenomics.00158.2003. [DOI] [PubMed] [Google Scholar]
- 65.Griffin JL, Scott J, Nicholson JK. The influence of pharmacogenetics on fatty liver disease in the wistar and kyoto rats: a combined transcriptomic and metabonomic study. Journal of Proteome Research. 2007;6(1):54–61. doi: 10.1021/pr0601640. [DOI] [PubMed] [Google Scholar]
Associated Data
This section collects any data citations, data availability statements, or supplementary materials included in this article.