

Abstract
Background and Purpose
MRI was used to evaluate the effects of experimental intracerebral hemorrhage (ICH) on brain tissue injury and recovery.
Methods
Primary ICH was induced in rats (n=6) by direct infusion of autologous blood into the striatum. The evolution of ICH damage was assessed by MRI estimates of T2 and T1sat relaxation times, cerebral blood flow, vascular permeability, and susceptibility-weighted imaging before surgery (baseline) and at 2 hours and 1, 7, and 14 days post-ICH. Behavioral testing was done before and at 1, 7, and 14 days post-ICH. Animals were euthanized for histology at 14 days.
Results
The MRI appearance of the hemorrhage and surrounding regions changed in a consistent manner over time. Two primary regions of interest were identified based on T2 values. These included a core, corresponding to the bulk of the hemorrhage, and an adjacent rim; both varied with time. The core was associated with significantly lower cerebral blood flow values at all post-ICH time points, whereas cerebral blood flow varied in the rim. Increases in vascular permeability were noted at 1, 7, and 14 days. Changes in T1sat were similar to those of T2. MRI and histological estimates of tissue loss were well correlated and showed approximately 9% hemispheric tissue loss.
Conclusions
Although the cerebral blood flow changes observed with this ICH model may not exactly mimic the clinical situation, our results suggest that the evolution of ICH injury can be accurately characterized with MRI. These methods may be useful to evaluate therapeutic interventions after experimental ICH and eventually in humans.
Keywords: edema, intracerebral hemorrhage, MRI
Spontaneous intracerebral hemorrhage (ICH) affects roughly 80 000 patients (10% to 15% of all strokes) in the United States every year, and most patients either die or are left with significant neurological deficit. Clinical treatment of ICH presently consists of decompressive surgery in selected cases and supportive measures to reduce bleeding and control hypertension.1 Given the enormity of the clinical problem, it is imperative that new therapeutic approaches be developed to reduce the functional deficits caused by ICH. As ICH therapies are studied in experimental models, correlative MRI measurements of physiological changes in the perihematomal regions would be useful and would allow for meaningful comparison between the animal models of ICH and clinical posthemorrhage imaging.
Very few studies have used MRI to explore the temporal evolution of ICH in animal models out to or beyond 24 hours.2,3 Such studies are necessary to characterize injury to the neurovascular unit in terms of brain edema, tissue loss, and vascular permeability changes over time in the same subject. Establishing these vital parameters may be useful for testing new therapies. In the present study, MRI was used to evaluate the effects of ICH on brain tissue injury and recovery in rats after the injection of autologous blood into the striatum. The temporal evolution of ICH damage was assessed by quantitative MRI estimates of T2, cerebral blood flow (CBF), vascular permeability, and T1sat over a period of 14 days. Susceptibility-weighted imaging (SWI) was used to estimate acute hemorrhage volume. Neurobehavioral effects were also assessed over this period. The MRI data demonstrated excellent contrast between hemorrhagic and edematous regions and surrounding normal tissue with significant changes in these parameters detected at various times from the onset of ICH out to 2 weeks. These results were compared with histological estimates of tissue loss.
Materials and Methods
Intracerebral Hemorrhage Model
All experimental procedures were performed in accordance with institutional guidelines in an American Association for Laboratory Animal Care-approved facility. Animals were anesthetized with isoflurane (1.0% to 1.5%) in a 2:1 N2O:O2 mixture through spontaneous respiration and core temperature was maintained at 36°C to 37°C throughout all surgical and MRI procedures.
Primary ICH was induced in Wistar rats (270 to 320 g, n=6) by direct infusion of autologous blood into the striatum region adjacent to the subventricular zone.4,5 A stereotaxic apparatus was used to position the tip of the needle at coordinates 0.5 mm anterior, 3.5 mm lateral, and 5.5 mm deep relative to bregma through a 1-mm craniotomy. Primary ICH was produced by infusion of 100 μL of fresh (nonheparinized) autologous whole blood into the right striatum at a constant rate of 10 μL/min. The needle was left in place for 10 minutes after the infusion and was then withdrawn and the incision closed with sutures. For the acute post-ICH time point, the right femoral artery and vein were cannulated for monitoring of blood pressure and gases and for MRI contrast agent administration, respectively. For follow-up studies ≥24 hours post-ICH, the contrast agent was administered through a tail vein catheter.
MRI Methods
All MRI studies were performed using a 7-Tesla, 20-cm bore magnet (Magnex Scientific, Inc, Abingdon, UK) interfaced to a Bruker (Bruker Biospin MRI, Inc, Billerica, Mass) console. A birdcage radiofrequency coil and a surface coil were used for radiofrequency transmission and reception, respectively. Ear bars and a nose cone, through which the anesthetic gas mixture was supplied, were used to minimize head movement during MRI measurements. A 3-plane scout imaging sequence was obtained at the start of each MRI session to reproducibly position the animal in the magnet. Quantitative MRI studies included spin-lattice (T1) and spin-spin (T2) relaxation-weighted imaging (T1WI and T2WI, respectively), magnetization transfer-weighted imaging, and SWI. Studies were performed before ICH, from 1 to 3 hours after ICH onset, and at 1, 7, and 14 days post-ICH. The MRI contrast agent gadolinium diethyl-enetriaminepentaacetic acid (Gd-DTPA) was given at all post-ICH time points to assess changes in vascular permeability.
T2
The T2 measurements were acquired using a multislice (13 1-mm thick sections) multiecho T2WI sequence (TR=8000 ms, TE=20, 40, 60, 80, 100, 120 ms). The images were acquired using 128×64 image matrix over a 32×32 mm2 field of view and reconstructed using a 128×128 matrix. Scan time for the T2 sequence was approximately 9 minutes.
T1 and T1sat Measurement
The proton spin-lattice relaxation time (T1) data were acquired using an imaging variant of the TOMROP pulse sequence.6 The sequence provides an efficient and unbiased estimator of T1, because it is based on the Look-Locker method.7 Quantitative estimates of T1 in the presence of off-resonance saturation of the bound proton signal (T1sat), an magnetization transfer-related parameter, were also generated using this method.8 This was done by inserting 2 continuous wave saturation radiofrequency pulses with an 8-kHz frequency offset into the Look-Locker sequence (TR=11 seconds, TE=2.2 ms, 128×64 matrix, 32×32 mm2 field of view, 2-mm slice thickness). With this sequence, a single-slice T1sat map was obtained in approximately 12 minutes.
Perfusion
Estimates of CBF were obtained using an arterial spin labeling technique.9,10 Labeling of inflowing arterial water protons was performed through an axial gradient of ±0.3 kHz/mm using a continuous-wave radiofrequency pulse at a power of 0.3 kHz and frequency offset of ±6 kHz followed by a spin-echo sequence with TR/TE=1000 ms/20 ms.11 The labeled slice was 1 cm thick and was located approximately 2 cm distal to the imaging slice. The image section was 2 mm thick and was acquired over a 32×32 mm2 field of view using a 64×64 image matrix. The sequence required approximately 18 minutes.
Blood–Brain Barrier Permeability
Estimates of the blood-to-brain transfer constant (Ki) were obtained using a T1WI Look-Locker sequence (TR/TE=2000 ms/2.2 ms, 24 echoes, 128×64 matrix, 32×32 mm2 field of view, 5 slices, 2.0 mm thick) to produce T1 estimates at approximately 2.5-minute intervals.12,13 After obtaining a baseline T1 map, a bolus injection of Gd-DTPA (0.2 mmol/kg, intravenously) was given and a series of 10 T1 maps was acquired. The entire protocol required approximately 28 minutes. Temporal changes in the Gd-DTPA-influenced relaxation rates were used to estimate Gd-DTPA concentrations in the brain and blood. Estimates of Ki were produced using MRI Patlak plot methods.12,13
Susceptibility-Weighted Imaging
The SWI data were acquired using a specialized 3-dimensional gradient-echo sequence that is very sensitive to the presence of paramagnetic agents (ie, deoxyhemoglobin). The method uses TR/TE=20 ms/10 ms and a 25° flip angle. The data were acquired using a 256×256×64 matrix over a 32×32×16 mm3 field of view.
MRI Data Analysis
The MR data were transferred to a Unix-based system for analysis. Regions of interest representing the lesion core and adjacent rim (Figure 1) were identified by windowing of T2 values. The selected regions of interest from the T2 maps were then superimposed onto the other MRIs to assure that the estimates were taken from the same area. Tissue loss in the ipsilateral hemisphere 2 weeks post-ICH was estimated by measuring ipsilateral and contralateral hemisphere volumes (minus ventricular volumes) over 7 1-mm thick T2 maps. The measurement was expressed as a ratio of the contralateral hemisphere volume minus the ipsilateral hemisphere volume divided by the contralateral hemisphere. Acute hemorrhage volume was estimated from SWI data.
Figure 1.
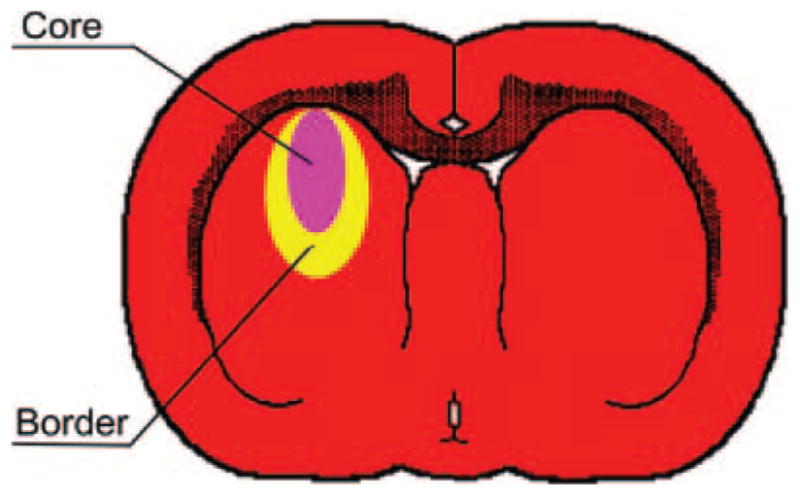
Representative diagram of ICH-affected regions in the rat brain. The core area (pink) represents the injected blood clot and is surrounded by a border of reactive tissue (yellow). The MRI “rim” was comprised of the border and an additional edematous zone that was sometimes seen adjacent to the border.
Histopathology and Neurobehavioral Testing
Animal weight and functional neurological testing, consisting of a neurological severity score and cornering test, were measured before and at 1, 7, and 14 days after ICH. The neurological severity score represents a composite scoring of motor, sensory, balance, and reflexive indices that range from 1 to 18 with higher scores indicative of greater neurological injury.14 The cornering test15 measures the number of times that an animal turns to the right or left when placed in a corner (normal state=0.5). The animals were euthanized under anesthesia after the 2-week post-ICH MRI study through transcardial perfusion with saline (for vascular washout) followed by 4% paraformaldehyde. The brain was removed from the skull afterward and placed in fixative overnight. The fixed brain tissue was cut into 7 equally spaced (2-mm thick) coronal blocks and embedded in paraffin. Coronal sections (10-μm thick) were taken at 0.5-mm intervals through the entire region of ICH and stained with hematoxylin and eosin. Histopathological assessment was performed to estimate the degree of tissue injury and loss from the hematoxylin and eosin-stained sections in the same manner as described for the MRI data.
For the purpose of mitotic labeling of newly formed DNA, all rats received daily intraperitoneal injections of 100 mg/kg of bromodeoxyuridine starting 24 hours after ICH and then subsequently for the next 13 days. Brain sections through the ICH region were labeled histochemically for bromodeoxyuridine and von Willebrand factor in the core, border, and edematous region surrounding the border zone. All antibodies were diluted in tris-buffered saline containing 0.1% Triton X-100, 0.05% Tween 20, and 3% donkey serum (TBS-plus). The primary antibodies used included monoclonal mouse anti-bromodeoxyuridine (Dako, 1:100) and polyclonal rabbit anti-von Willebrand factor (DAKO, dilution 1:400).
Statistical Analysis
All pairwise testing between ipsilateral and contralateral regions of interest and between time points was performed using t tests. Correlational analysis between MRI and histological estimates of tissue loss were done by linear regression. Significance was inferred for P≤0.05.
Results
All animals demonstrated a sizable region of ICH that was associated with significant neurological deficit. Average weight changes, relative to pre-ICH values measured on day 0, were 0.938±0.007, 0.952±0.071, and 0.982±0.047 at 1, 7, and 14 days post-ICH, respectively, indicating significant weight loss between pre-ICH and 24-hour values with significant recovery toward pre-ICH levels between 1 and 14 days. Average neurological severity score values were 9.2±1.6, 6.3±1.4, and 5.2±1.5 and corner test scores were 1.0±0, 0.77±0.2, and 0.73±0.18 on days 1, 7, and 14, respectively. Both tests indicated significant improvement (P<0.02) in function between day 1 and either day 7 or 14, but not between 7 and 14 days.
Examples of quantitative CBF, T2, and Ki maps from a representative animal are shown in Figure 2 before and at various times after ICH. The top row shows CBF maps with normal flow before ICH and severely decreased CBF afterward, particularly in the central core region. The lesion core was associated with significantly decreased CBF values and, to a lesser extent, in the rim. The middle row shows T2 maps obtained at the same time points with a dark core and adjacent hyperintense rim acutely that reversed in intensity at 24 hours and beyond. In 4 of the 6 rats studied, a secondary hyperintense rim with elevated T2 values was also observed at 24 hours and was probably due to edema. The bottom row shows Ki maps acquired after ICH. Increases in blood–brain barrier permeability were noted in both core and rim areas at 24 hours, which increased further in the core while stabilizing or decreasing slightly in the rim.
Figure 2.

Examples of quantitative cerebral blood flow, T2, and blood-to-brain transfer constant (Ki) maps at various times before and after experimental ICH. The CBF maps (top row) indicated normal flow before ICH that decreased severely after ICH, particularly in the central core region. The T2 maps (middle row) showed a dark central core region (low T2) and adjacent surrounding bright rim (high T2) acutely that reversed in intensity at 24 hours and beyond. The Ki maps (bottom row) were only acquired after ICH. Increased blood–brain barrier permeability was noted in both core and rim areas at 24 hours that increased further in the core while stabilizing or decreasing slightly in the rim.
Figure 3 shows an example of SWI obtained before and after ICH from the same animal presented in Figure 2. This imaging modality produces T2* weighting, which is highly sensitive to the presence of blood with deoxyhemoglobin at the acute time and hemoglobin breakdown products at later times.16 The hyperintense core region visible from 24 hours to 2 weeks is believed to be due to presence of extracellular methemoglobin. Although this type of 3-dimensional SWI does not produce a quantitative parameter estimate, the images were visually striking, demonstrating excellent contrast between hemorrhagic tissue and the surrounding edematous regions and were useful for estimating acute ICH volumes.
Figure 3.

Susceptibility-weighted images obtained before and at various times after ICH from the same animal shown in Figure 2. The images demonstrated excellent contrast between hemorrhagic tissue and the surrounding regions. Acutely, the ICH was evident as a region of decreased signal intensity, whereas at later times, the signal intensity in the core area reversed, becoming hyperintense.
The results for various quantitative MRI parameter estimates are presented in Figures 4 through 7. Figure 4 shows the ipsilateral/contralateral T2 ratios plotted as a function of time after the onset of ICH for regions located in the central core of the lesion and the surrounding rim. The T2 changes in the core and rim areas were significant and distinct between the 2 areas; these changes were used to segment the ICH-affected regions from surrounding normal tissue and CSF. The T2 values in the core significantly declined acutely and then became significantly elevated at later times relative to corresponding contralateral regions, whereas T2 in the rim was significantly elevated acutely and then decreased significantly at later times relative to contralateral regions. The elevated T2 rim seen acutely and as a secondary rim in some animals at 24 hours was probably due to a combination of serum, which squeezed out as the clot retracted, and edema.
Figure 4.

Plot of T2 ratios (ipsilateral/contralateral) as a function of time after ICH onset for regions in the central core and surrounding rim of the lesion. In the core region, T2 values declined significantly at the acute time point and then became significantly elevated at later times relative to the corresponding contralateral region. Conversely, T2 in the rim was significantly elevated acutely and then decreased significantly at later times relative to contralateral regions.
Figure 7.

T1sat ratios (ipsilateral/contralateral) are shown plotted as a function of time after ICH. Acute T1sat values decreased significantly in the core region and then became significantly elevated at later times. Only minor T1sat changes were noted in the rim.
The ipsilateral/contralateral CBF ratios for core and adjacent rim areas plotted as a function of time are shown in Figure 5. Average CBF values in the ipsilateral core regions were 19±28, 19±17, 54±40, and 77±26 and in the rim 56±23, 76±27, 100±55, and 105±16 mL/100 g/min at days 0, 1, 7, and 14, respectively. CBF values in both the core and rim regions decreased significantly relative to contralateral regions at all time points, except in the rim at 7 days. Furthermore, CBF values in the core were significantly lower than the rim on days 0, 1, and 14.
Figure 5.

Cerebral blood flow ratios (ipsilateral/contralateral) plotted as a function of time. CBF in both the core and rim regions was significantly decreased relative to contralateral regions at all time points, except for the rim at 7 days. Furthermore, CBF values in the core were significantly lower than the rim at days 0, 1, and 14.
Estimates of Ki for Gd-DTPA plotted as a function of time are presented in Figure 6. A progressive increase in vascular permeability was noted in the core of the lesion. Small increases in Ki were noted at day 1 for both core and rim areas. The Ki values in the core area continued to increase at 7 and 14 days, whereas they appeared to remain relatively constant or decrease slightly in the rim area at 7 and 14 days.
Figure 6.

Estimates of the blood-to-brain transfer constant (Ki) for Gd-DTPA are plotted as a function of time. Small increases in Ki were noted at day 1 for both core and rim areas. The Ki values in the core area continued to increase at 7 and 14 days, whereas they remained relatively constant or decreased slightly in the rim area at 7 and 14 days.
Figure 7 shows the ipsilateral/contralateral T1sat ratios for core and rim regions plotted as a function of time after ICH. T1sat is a magnetization transfer-related parameter that is very sensitive to changes in tissue water content and/or shifts between the “bound” and “free” proton pools. The T1sat values decreased significantly in the core region acutely and then became significantly elevated at later times, whereas only minor T1sat changes were noted in the rim.
Significant tissue loss was noted at 2 weeks by both MRI and histological methods. The percent ipsilateral hemisphere tissue loss by MRI was significantly correlated (P=0.013) with histological estimates (Figure 8). The average tissue loss for the 5 animals that were injected with the full 100-μL volume of blood relative to the contralateral hemisphere volume was 9.0±1.3% by MRI and 8.4±1.2% by histology. Data from the one animal (DS04) that did not receive the full 100-μL volume of blood was not included in this average. A substantial portion (one third to half) of this tissue loss could be accounted for by the expansion of the ipsilateral ventricle. The average acute ICH volume was 24.2±8.5 mm3, which corresponded to a tissue volume loss of 40.2±8.2 mm3. With the exception of one outlying data point that showed a small ICH volume and large tissue loss, the acute ICH volume estimates were significantly correlated with tissue volume loss at 2 weeks (R2=0.78, P<0.05).
Figure 8.

Plot of the percentage of hemispheric tissue loss, relative to the contralateral hemisphere, measured 2 weeks post-ICH by histological versus MRI methods. The 2 methods were significantly correlated (P=0.013).
The immunohistochemical stained sections showed colocalization of bromodeoxyuridine and von Willebrand factor staining (Figure 9) at 2 weeks post-ICH in the border zone, located adjacent to the core region, in all animals. This colocalization was interpreted as an indication of ongoing angiogenic activity in response to the ICH-induced tissue injury. We did not detect such activity in either the core region or the edematous region outside the border zone.
Figure 9.
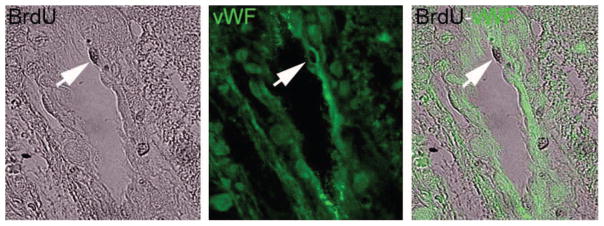
Microscopic images (400×) of von Willebrand factor and bromodeoxyuridine histochemical labeling taken from a representative animal 2 weeks after ICH. This figure demonstrates the colocalization technique (arrow) for assessing angiogenesis. The colocalization of the 2 staining methods was interpreted as representative of ongoing angiogenic activity in the border zone surrounding the ICH core.
Discussion
This study describes a set of quantitative and qualitative MRI parameters that were used to follow the progression of brain injury in a rat model of ICH. Although the experimental ICH model used in these studies may not exactly mimic the clinical presentation of ICH, it nevertheless provides a reproducible model for tracking and characterizing ICH-induced tissue changes that may be useful for testing potential therapeutic interventions. The consistent patterns of change in these parameters and their correlation with terminal histological measures suggest their potential as noninvasive indices to assess the response to drugs in this model. It also seems likely that they can be used to estimate the final extent of tissue injury based on acute hemorrhage and injury volumes.
In comparison to previous reports that used MRI to study ICH using the injection model in rats, these studies were performed at higher field strength and provided quantitative estimates of ICH-induced changes in CBF and blood–brain barrier permeability. We also correlated acute ICH volume measurements from acute SWI with histological estimates of tissue loss at 2 weeks post-ICH and present immunohistochemical evidence of angiogenesis in the border zone.
The pathophysiology and morphology of cerebral damage after ICH has been studied in animal models and in humans using radiological imaging techniques. As the blood clot developed within the closed intracranial space, predictable changes occurred in the brain parenchyma. Edema forms around a cerebral hemorrhage within hours after onset and is associated with mass effect, elevated intracranial pressure, and secondary brain injury.17–21 Experimental models of ICH indicate that the triggers of perihematomal edema and cell death include clot-secreted factors of thrombin and fibrin, red blood cell lysis, protease induction, apoptosis, and complement activation leading to a component of acute inflammation.22–25
Whether ischemia plays a causative role in neuronal damage has been a matter of some controversy.26,27 A study by Patel et al showed CBF levels to be below an ischemic threshold of 20 mL/100g/min in the core region of the hemorrhage.21 In addition, some earlier animal model studies of ICH as a mass lesion in the brain demonstrated measurable ischemia in the penumbra region.28–31 However, more recent injection model studies have shown no significant decrease in CBF and no histopathological or metabolic signs of ischemic damage in the perihematoma region.21,32–34 One recent experimental study that used a double injection model in rats and post-ICH MRI revealed no MRI characteristics suggesting the presence of perihematomal ischemia.35
Human studies of regional CBF after ICH show that CBF decreases initially but returns to normal values by 72 hours, and the region initially hypoperfused corresponds to where the edema ultimately forms.36 A large clinical study measuring CBF around the ICH failed to find levels of reduced CBF indicative of infarction, but did note a significant association between perihematomal CBF and functional status of the patients at the time of discharge from the hospital.37 The region of reduced CBF around the ICH regains its perfusion in the subacute and late clinical follow-up using MRI and single photon emission CT brain imaging.27,38
Positron emission tomography studies have demonstrated decreased local cerebral metabolic rate of oxygen relative to CBF, indicating reduced metabolic demand in the region adjacent to the ICH.39 A recent human study found reduced mitochondrial function in perihematomal brain tissue samples, which is consistent with the reduced metabolic rate and the reduced oxygen extraction fraction noted in clinical ICH reports.40 Although this may be a rim of tissue in a “hibernation” state for the first 48 hours after ICH, it likely remains susceptible to further injury as the pathophysiological events around the clot evolve.26,41
Our data suggest that our experimental ICH lesion is divided into 2 distinct pathological regions: the core and a boundary/rim adjacent to the core, consistent with previous experimental and clinical studies reviewed here. The core exhibited similar pathophysiological characteristics of ischemic tissue characterized by low tissue perfusion, initially very severe, but remaining hypoperfused with a compromised blood–brain barrier. The T1sat showed a dramatic increase over the 2-week period indicative of protein in the core. However, there are some differences between the ICH and classic ischemic lesions, the primary one being that blood–brain barrier disruption persists in the ICH core but is transient in the core of ischemic stroke.42 The MRI changes in the rim seem to clearly demarcate this region from the core. This region, although distinct by MRI from the core, exhibits clear evidence of persistent tissue damage; T2 ratio to the contralateral homologous tissue remains suppressed, hypo-perfusion persists, and the blood–brain barrier is mildly but consistently impaired. This region appears to identify severely compromised cerebral tissue that is likely to remain vulnerable for an extended period of time. Our data demonstrate the loss of cerebral tissue yet an improvement in functional recovery with time. The hypoperfusion noted in this study does not necessarily indicate tissue ischemia, but still may be a useful index of the severity of injury to follow in this experimental ICH model.
The data produced by the various MRI parameters studied showed distinct changes in both the core and adjacent border regions that were used to characterize the progression of ICH-induced injury to cerebral tissue. Although it is not conclusive whether a causal relationship exists, our data suggest that cerebral tissue injury due to ICH is associated with decreased CBF, increased blood–brain barrier permeability (ie, suggesting the presence of a vascular component), and cerebral edema. Given the degree and duration of CBF deficit, recovery seems unlikely in the core region but may be possible in the rim. Monitoring these differences in CBF recovery after ICH may be useful for evaluating potential experimental therapies. Furthermore, although there was no direct injury to any major blood vessels, the increasing Ki values and extended period of poor perfusion in the core would suggest a significant vascular component to ICH-related tissue injury with little chance for recovery as opposed to that seen in the rim. Histological evidence of angiogenesis was observed in the border zone 2 weeks after ICH in this model. Finally, the initial significant decline of T1sat in the core was probably due to the presence of blood, which would be expected to drastically alter the bound-to-free proton pool balance, whereas the elevated values at later times probably reflects increased tissue water (ie, edema) and extracellular protein.16
Estimates of tissue volume loss at 2 weeks by MRI and histology were well correlated suggesting that MRI can be used to assess late-term effects of ICH. Furthermore, with the exception of one animal, acute MRI estimates of ICH volume were significantly correlated with tissue loss at 2 weeks. We hypothesize that this variation of the initial ICH volume may have been due to differences in the duration that the blood was allowed to stand in the syringe before being injected into the brain, although we did not control for this parameter in this study. With further development, this approach may be useful for evaluating therapeutic interventions in experimental animals and eventually in humans.
Understanding the dynamic processes of injury and recovery in the vulnerable perihematomal rim will benefit from experimental real-time in vivo measurements of perfusion, blood–brain barrier breakdown, tissue edema, and clot volume. Future investigations using MRI after experimental ICH will explore the predictive relationship between the initial ICH volume and cerebral tissue loss and ultimately functional outcome. These types of experimental ICH studies, and ultimately the understanding of mechanisms of action of the interventions, will be enhanced by the application of early post-ICH MRI as described here.
Acknowledgments
We gratefully acknowledge Kishor Karki for his efforts in preparing the manuscript.
Sources of Funding
This work was supported in part by National Institutes of Health grants P50 NS23393, PO1 NS42345, and RO1 NS058581.
Footnotes
Disclosures
None.
References
- 1.Broderick J, Connolly S, Feldmann E, Hanley D, Kase C, Krieger D, Mayberg M, Morgenstern L, Ogilvy C, Vespa P, Zuccarello M. Guidelines for the management of spontaneous intracerebral hemorrhage in adults: 2007 update. Stroke. 2007;38:2001–2023. doi: 10.1161/STROKEAHA.107.183689. [DOI] [PubMed] [Google Scholar]
- 2.Strbian D, Tatlisumak T, Ramadan UA, Lindsberg PJ. Mast cell blocking reduces brain edema and hematoma volume and improves outcome after experimental intracerebral hemorrhage. J Cereb Blood Flow Metab. 2007;27:795–802. doi: 10.1038/sj.jcbfm.9600387. [DOI] [PubMed] [Google Scholar]
- 3.Belayev L, Obenaus A, Zhao W, Saul I, Busto R, Wu C, Vigdorchik A, Lin B, Ginsberg MD. Experimental intracerebral hematoma in the rat: characterization by sequential magnetic resonance imaging, behavior, and histopathology. Effect of albumin therapy. Brain Res. 2007;1157:146–155. doi: 10.1016/j.brainres.2007.04.077. [DOI] [PubMed] [Google Scholar]
- 4.Seyfried D, Ding J, Han Y, Li Y, Chen J, Chopp M. Effects of intravenous administration of human bone marrow stromal cells after intracerebral hemorrhage in rats. J Neurosurg. 2006;104:313–318. doi: 10.3171/jns.2006.104.2.313. [DOI] [PubMed] [Google Scholar]
- 5.Seyfried D, Han Y, Lu D, Chen J, Bydon A, Chopp M. Improvement in neurological outcome after administration of atorvastatin following experimental intracerebral hemorrhage in rats. J Neurosurg. 2004;101:104–107. doi: 10.3171/jns.2004.101.1.0104. [DOI] [PubMed] [Google Scholar]
- 6.Brix G, Schad LR, Deimling M, Lorenz WJ. Fast and precise T1 imaging using a TOMROP sequence. Magn Reson Imaging. 1990;8:351–356. doi: 10.1016/0730-725x(90)90041-y. [DOI] [PubMed] [Google Scholar]
- 7.Look DC, Locker DR. Time saving in measurement of NMR and EPR relaxation times. Review of Scientific Instruments. 1970;41:250–251. [Google Scholar]
- 8.Knight R, Nagesh V, Nagaraja TN, Ewing J, Whitton PA, Bershad E, Fagan S, Fenstermacher JD. Acute BBB opening in experimentally induced focal cerebral ischemia is preferentially identified by quantitative magnetization transfer imaging. Magn Reson Med. 2005;54:822–832. doi: 10.1002/mrm.20630. [DOI] [PubMed] [Google Scholar]
- 9.Detre JA, Williams DS, Leigh JS, Koretsky AP. Perfusion imaging. Magn Reson Med. 1992;23:37–45. doi: 10.1002/mrm.1910230106. [DOI] [PubMed] [Google Scholar]
- 10.Williams D, Detre J, Leigh J, Koretsky A. Magnetic resonance imaging of perfusion using spin inversion of arterial water. Proc Natl Acad Sci U S A. 1992;89:212–216. doi: 10.1073/pnas.89.1.212. [DOI] [PMC free article] [PubMed] [Google Scholar]
- 11.Ding G, Nagesh V, Jiang Q, Zhang L, Zhang ZG, Li L, Knight RA, Li Q, Ewing JR, Chopp M. Early prediction of gross hemorrhagic transformation by noncontrast agent MRI cluster analysis after embolic stroke in rat. Stroke. 2005;36:1247–1252. doi: 10.1161/01.STR.0000166199.10017.c5. [DOI] [PubMed] [Google Scholar]
- 12.Ewing JR, Knight RA, Nagaraja TN, Yee JS, Nagesh V, Whitton PA, Li L, Fenstermacher JD. Patlak plots of Gd-DTPA MRI data yield blood–brain transfer constants concordant with those of 14C-sucrose in areas of blood–brain opening. Magn Reson Med. 2003;50:283–292. doi: 10.1002/mrm.10524. [DOI] [PubMed] [Google Scholar]
- 13.Knight R, Nagaraja TN, Ewing J, Nagesh V, Whitton P, Bershad E, Fagan S, Fenstermacher J. Quantitation and localization of blood-to-brain influx by magnetic resonance imaging and subsequent quantitative autoradiography in a rat model of transient focal ischemia. Magn Reson Med. 2005;54:813–821. doi: 10.1002/mrm.20629. [DOI] [PubMed] [Google Scholar]
- 14.Chen J, Li Y, Wang L, Zhang Z, Lu D, Lu M, Chopp M. Therapeutic benefit of intravenous administration of bone marrow stromal cells after cerebral ischemia in rats. Stroke. 2001;32:1005–1011. doi: 10.1161/01.str.32.4.1005. [DOI] [PubMed] [Google Scholar]
- 15.Zhang L, Schallert T, Zhang Z, Jiang Q, Arniego P, Li Q, Lu M, Chopp M. A test for detecting long-term sensorimotor dysfunction in the mouse after focal cerebral ischemia. J Neurosci Methods. 2002;117:207–214. doi: 10.1016/s0165-0270(02)00114-0. [DOI] [PubMed] [Google Scholar]
- 16.Atlas S, Thulborn K. Intracranial hemorrhage. In: Atlas S, editor. Magnetic Resonance Imaging of the Brain and Spine. Philadelphia: Lippincott Williams & Wilkins; 2002. pp. 773–832. [Google Scholar]
- 17.Mendelow A, Gregson B, Fernandes H, Murray G, Teasdale G, Hope D, Karimi A, Shaw D, Barer D. Early surgery versus initial conservative treatment in patients with spontaneous supratentorial intracerebral haematomas in the international surgical trial in intracerebral haemorrhage (STICH): a randomized trial. Lancet. 2005;365:387–397. doi: 10.1016/S0140-6736(05)17826-X. [DOI] [PubMed] [Google Scholar]
- 18.Sansing L, Kaznatchcheeva E, Perkins C, Komaroff E, Gutman F, Newman G. Edema after intracerebral hemorrhage: correlations with coagulation parameters and treatment. J Neurosurg. 2003;98:985–992. doi: 10.3171/jns.2003.98.5.0985. [DOI] [PubMed] [Google Scholar]
- 19.Xi G, Keep R, Hoff J. Pathophysiology of brain edema formation. Neurosurg Clin N Am. 2002;13:371–383. doi: 10.1016/s1042-3680(02)00007-4. [DOI] [PubMed] [Google Scholar]
- 20.Zazulia A, Diringer M, Derdeyn C, Powers W. Progression of mass effect after intracerebral hemorrhage. Stroke. 1999;30:1167–1173. doi: 10.1161/01.str.30.6.1167. [DOI] [PubMed] [Google Scholar]
- 21.Patel TR, Schielke GP, Hoff JT, Keep RF, Betz AL. Comparison of cerebral blood flow and injury following intracerebral and subdural hematoma in the rat. Brain Res. 1999;829:125–133. doi: 10.1016/s0006-8993(99)01378-5. [DOI] [PubMed] [Google Scholar]
- 22.Gong C, Hoff J, Keep RF. Acute inflammatory reaction following experimental intracerebral hemorrhage in rat. Brain Res. 2000;871:57–65. doi: 10.1016/s0006-8993(00)02427-6. [DOI] [PubMed] [Google Scholar]
- 23.Lee K, Colon G, Betz A, Keep R, Kim S, Hoff J. Edema from intracerebral hemorrhage and the role of thrombin. J Neurosurg. 1996;84:91–96. doi: 10.3171/jns.1996.84.1.0091. [DOI] [PubMed] [Google Scholar]
- 24.Rosenberg G, Navratil M. Metalloprotease inhibition blocks edema in intracerebral edema in the rat. Neurology. 1997;48:921–926. doi: 10.1212/wnl.48.4.921. [DOI] [PubMed] [Google Scholar]
- 25.Felberg RA, Grotta JC, Shirzadi AL, Strong R, Narayana P, Hill-Felberg SJ, Aronowski J. Cell death in experimental intracerebral hemorrhage: the ‘black hole’ model of hemorrhagic damage. Ann Neurol. 2002;51:517–524. doi: 10.1002/ana.10160. [DOI] [PubMed] [Google Scholar]
- 26.Shah QA, Ezzeddine MA, Qureshi AI. Acute hypertension in intracerebral hemorrhage: pathophysiology and treatment. J Neurol Sci. 2007;261:74–79. doi: 10.1016/j.jns.2007.04.036. [DOI] [PubMed] [Google Scholar]
- 27.Siddique MS, Fernandes HM, Wooldridge TD, Fenwick JD, Slomka P, Mendelow AD. Reversible ischemia around intracerebral hemorrhage: a single-photon emission computerized tomography study. J Neurosurg. 2002;96:736–741. doi: 10.3171/jns.2002.96.4.0736. [DOI] [PubMed] [Google Scholar]
- 28.Bullock R, Mendelow A, Teasdale G, Graham D. Intracranial hemorrhage induced at arterial pressure in the rat, part 1. Neurol Res. 1984;6:184–188. doi: 10.1080/01616412.1984.11739687. [DOI] [PubMed] [Google Scholar]
- 29.Mendelow A, Bullock R, Teasdale G, Graham D, McCulloch J. Intracranial hemorrhage induced at arterial pressure in the rat, part 2. Neurol Res. 1984;6:189–193. doi: 10.1080/01616412.1984.11739688. [DOI] [PubMed] [Google Scholar]
- 30.Ropper A, Zervas N. Cerebral blood flow after experimental basal ganglii hemorrhage. Ann Neurol. 1982;11:266–271. doi: 10.1002/ana.410110306. [DOI] [PubMed] [Google Scholar]
- 31.Sinar EJ, Mendelow AD, Graham DI, Teasdale GM. Experimental intracerebral hemorrhage: effects of a temporary mass lesion. J Neurosurg. 1987;66:568–576. doi: 10.3171/jns.1987.66.4.0568. [DOI] [PubMed] [Google Scholar]
- 32.Qureshi A, Wilson D, Hanley D, Traystman R. Pharmacologic reduction of mean arterial pressure does not adversely affect regional cerebral blood flow and intracranial pressure in experimental intracerebral hemorrhage. Crit Care Med. 1999;27:965–971. doi: 10.1097/00003246-199905000-00036. [DOI] [PubMed] [Google Scholar]
- 33.Qureshi A, Wilson D, Hanley D, Traystman R. No evidence for an ischemic penumbra in massive experimental intracerebral hemorrhage. Neurology. 1999;52:266–272. doi: 10.1212/wnl.52.2.266. [DOI] [PubMed] [Google Scholar]
- 34.Wagner K, Xi G, Hua Y, Kleinholz M, de Courten-Myers G, Myers R. Early metabolic alterations in edematous perihematomal brain regions following experimental intracerebral hemorrhage. J Neurosurg. 1998;88:1058–1065. doi: 10.3171/jns.1998.88.6.1058. [DOI] [PubMed] [Google Scholar]
- 35.Orakcioglu B, Fiebach JB, Steiner T, Kollmar R, Juttler E, Becker K, Schwab S, Heiland S, Meyding-Lamade UK, Schellinger PD. Evolution of early perihemorrhagic changes—ischemia vs edema: an MRI study in rats. Exp Neurol. 2005;193:369–376. doi: 10.1016/j.expneurol.2005.01.017. [DOI] [PubMed] [Google Scholar]
- 36.Mayer S, Lignelli A, Fink M, Kessler D, Thomas C, Swarup R, Heertum V. Perilesional blood flow and edema formation in acute intracerebral hemorrhage: a SPECT study. Stroke. 1998;29:1791–1798. doi: 10.1161/01.str.29.9.1791. [DOI] [PubMed] [Google Scholar]
- 37.Tayal AH, Gupta R, Yonas H, Jovin T, Uchino K, Hammer M, Wechsler L, Gebel JM. Quantitative perihematomal blood flow in spontaneous intracerebral hemorrhage predicts in-hospital functional outcome. Stroke. 2007;38:319–324. doi: 10.1161/01.STR.0000254492.35504.db. [DOI] [PubMed] [Google Scholar]
- 38.Pascual AM, Lopez-Mut JV, Benlloch V, Chamarro R, Soler J, Lainez MJ. Perfusion weighted magnetic resonance imaging in acute intracerebral hemorrhage at baseline and during the first and second week: a longitudinal study. Cerebrovasc Dis. 2007;23:6–13. doi: 10.1159/000095752. [DOI] [PubMed] [Google Scholar]
- 39.Zazulia A, Diringer M, Videen T, Adams R, Yundt K, Aiyagari V, Grubb R, Powers W. Hypoperfusion without ischemia surrounding acute intracerebral hemorrhage. J Cereb Blood Flow Metab. 2001;21:804–810. doi: 10.1097/00004647-200107000-00005. [DOI] [PubMed] [Google Scholar]
- 40.Kim-Han JS, Kopp SJ, Dugan LL, Diringer MN. Perihematomal mitochondrial dysfunction after intracerebral hemorrhage. Stroke. 2006;37:2457–2462. doi: 10.1161/01.STR.0000240674.99945.4e. [DOI] [PubMed] [Google Scholar]
- 41.Qureshi A, Hanel R, Kirmani J, Yahia A, Hopkins L. Cerebral blood flow changes associated with intracerebral hemorrhage. Neurosurg Clin N Am. 2002;13:355–370. doi: 10.1016/s1042-3680(02)00012-8. [DOI] [PubMed] [Google Scholar]
- 42.Rosenberg G, Estrada E, Dencoff J. Matrix metalloproteinases and TIMPs are associated with blood–brain barrier opening after reperfusion in rat brains. Stroke. 1998;29:2189–2195. doi: 10.1161/01.str.29.10.2189. [DOI] [PubMed] [Google Scholar]