

Abstract
Iron transport into the CNS is still not completely understood. Using a brain perfusion technique in rats, we have shown a significant brain capillary uptake of circulating transferrin (Tf)-bound and free 59Fe (1 nM) at rates of 136 ± 26 and 182 ± 23 μL/g/min, respectively, while their respective transport rates into brain parenchyma were 1.68 ± 0.56 and 1.52 ± 0.48 μL/g/min. Regional Tf receptor density (Bmax) in brain endothelium determined with 125I-holo-Tf correlated well with 59Fe-Tf regional brain uptake rates reflecting significant vascular association of iron. Tf-bound and free circulating 59Fe were sequestered by the choroid plexus and transported into the CSF at low rates of 0.17 ± 0.01 and 0.09 ± 0.02 μL/min/g, respectively, consistent with a 10-fold brain-CSF concentration gradient for 59Fe, Tf-bound or free. We conclude that transport of circulating Tf-bound and free iron could be equally important for its delivery to the CNS. Moreover, data suggest that entry of Tf-bound and free iron into the CNS is determined by (i) its initial sequestration by brain capillaries and choroid plexus, and (ii) subsequent controlled and slow release from vascular structures into brain interstitial fluid and CSF.
Keywords: blood–brain barrier, cerebrospinal fluid, choroid plexus, free iron, transferrin-bound iron, transport
Iron (Fe) is essential for normal brain development and functions. However, high levels of Fe are neurotoxic and associated with development of neurodegenerative disorders (Connor and Benkovic 1992; Gerlach et al. 1994; Beard et al. 1996; Smith et al. 1997; Zheng 2001; Bishop et al. 2002; Thompson et al. 2003). A number of iron-binding transport proteins including transferrin (Tf), divalent metal transporter (DMT1), melanotransferrin (p97) and lactoferrin have been suggested to regulate Fe transport in the CNS (Jefferies et al. 1996; Moos 1996; Berg et al. 2001; Qian and Shen 2001; Ke and Qian 2003).
Circulating Tf-Fe complexes enter brain interstitial fluid (ISF) across the vascular CNS barriers, i.e. the blood–brain barrier (BBB) at the capillary endothelium and the blood–CSF barrier at the choroid plexus epithelium (Fishman et al. 1987; Roberts and Fine 1987; Morris et al. 1992; Skarlatos et al. 1995; Takeda 2001). Tf-Fe complexes are also taken up by neurons and glia (Hill and Switzer 1984; Taylor and Morgan 1990; Connor and Menzies 1995). In addition, a non-Tf-mediated route for Fe transport across the BBB and its uptake by neurons and glial cells has been suggested by a few studies (Ueda et al. 1993; Bradbury 1997; Moos and Morgan 1998; Malecki et al. 1999; Takeda et al. 2002). The role of non-Tf mediated iron transport in the CNS, however, is less well understood. Furthermore, the exact role of brain endothelium and choroid plexus epithelium, and the relative contributions of Tf-mediated versus non-Tf mediated transport in regulating iron delivery across the vascular CNS barriers are not clear.
Here, we studied uptake of circulating 59Fe by cerebral capillaries and choroid plexus, and its transport across the BBB and blood–CSF barrier in the presence and absence of Tf, using a modified Takasato et al. (1984) technique of vascular brain perfusion in rats, as described by Preston et al. (1995). In addition, the heart was cut to eliminate blood contamination of the perfused brain. Various modifications of brain perfusion technique have been used to characterize transport of amino acids, metals, peptides and nutrients at the BBB (Takasato et al. 1984; Zlokovic et al. 1986; Deane and Bradbury 1990; Martel et al. 1997; Egleton and Davis 1999; Allen and Smith 2001; Deane et al. 2003). The present findings suggest that Tf-mediated and non-Tf-mediated transport routes for circulating iron could be equally important for its delivery across the vascular CNS barriers. Moreover, our data reveal that iron, Tf-bound and/or free, is rapidly taken up from local brain microcrulation by brain capillary endothelium and choroid plexus epithelium, and subsequently released from these vascular structures into brain ISF and CSF at controlled moderate to slow rates, which ultimately limits its transport into the CNS.
Materials and methods
Materials
Chemicals were obtained from the following sources: sodium chloride (NaCl), potassium chloride (KCl), sodium bicarbonate (NaHCO3), HEPES, D-glucose, calcium chloride (CaCl2), dextran-70, bovine serum albumin (BSA), rat holo-transferrin, chloramine-T, sucrose, mercaptoethanol, aprotinin, leupeptin, and phenyl-methylsulfanyl fluoride (PMSF) from Sigma (St Louis, MO, USA); magnesium sulfate (MgSO4) and potassium phosphate monobasic (KH2PO4) from Aldrich Chemical Co. (Milwaukee, WI, USA). Radiolabeled products, 59Fe (18.7 mCi/mg), 3H-mannitol and 125I (17.4 Ci/mg), were obtained from NEN Life Products (Boston, MA, USA). All reagents were of analytical grade, HPLC grade, or the best available pharmaceutical grade.
Animals
All rats (male, Sprague-Dawley) used in this study were 9–12 weeks old (285.8 ± SD 29.7 g). They were purchased from Hilltop (Scottdale, PA, USA). Animals were kept in a temperature-controlled, 12-h light/dark cycle facility and fed ad libitum with a Teklad rat chow (Teklad, Madison, WI, USA). The experimental protocols were approved by the Institutional Animal Care and Use Committee at Columbia University and at the University of Rochester (UCAR).
Perfusion procedure
We used a modified method of Takasato et al. (1984) and Preston et al. (1995). Briefly, both common carotid arteries of anesthetized (50 mg sodium pentobarbital (Sagatal)/kg i.p.) rats were cannulated after ligation of the pterygopalatine, occipital, superior thyroid and external carotid arteries, and the brain was perfused with a Ringer solution, contained (g/L): NaCl, 7.31; KCl, 0.356; NaHCO3, 2.1; KH2PO4, 0.166; MgSO4.3H2O, 0.213; glucose, 1.50; and sodium pyruvate, 1 mmol/L and CaCl2, 2.5 mmol/L, at a flow rate of 3.9 mL/min through each carotid artery (Variable Flow, Mini Pump, VWR.USA), 37°C, pH 7.4 and gassed continuously with 5% CO2 and 95% O2. Prior to starting the experiment, this solution was filtered and pre-gassed with 100% O2. In contrast to the original Takasato’s method, oxygen pressure in the perfusate in the present studies was kept at about 240–280 mmHg, which allows a rate of O2 delivery of about 4.6 × 10⁻² μmol/s/g compared with 2.9 × 10⁻² μmol/s/g in Takasato et al. (1984), thus allowing for the extension in perfusion time without relative anoxia, as reported by Preston et al. (1995). With this modification in oxygen delivery, Preston et al. (1995) reported no significant difference in ATP levels between perfused and non-perfused brains over longer perfusion times in 1-, 2- and 3-week-old rats, and adult rats. In addition, we demonstrated by using the MTT (a tetrazolium-based compound) test (depends on cellular reduction of MTT by mitochondrial dehydrogenase) that mitochondrial function in the isolated brain microvessels after 30 min perfusion was the same as in microvessels from non-perfused brains (data not shown).
Prior to the start of perfusion, the jugular veins and left ventricle of the heart were cut to allow adequate perfusion and to prevent re-circulation of the rat’s blood. Therefore, there was no mixing of the rat’s blood with the Ringer solution during the perfusion. This technique was validated and used extensively for CNS transport studies (Takasato et al. 1984; Zlokovic et al. 1986; Deane and Bradbury 1990; Preston et al. 1995). Thirty seconds before the end of each time period, a CSF sample (100–150 μL) was collected from the cisterna magna, using a 25-gauge butterfly needle (Decton Dickinson, Sandy, UT, USA). The brain was then carefully removed from the skull, washed with ice-cold saline, and then placed on an ice-cold filter paper, saturated with cold saline on the surface of a beaker filled with ice and the meninges were rapidly removed with the aid of cold forceps and a microscope. The choroid plexuses from the lateral ventricles were removed and half the brain was used for capillary separation and the other part for regional brain uptake studies. The choroid plexus was removed from ventricles separately from brain regions.
Isotope infusions
Gassed Ringer solution (20 mL) in two separate syringes, containing the isotope (59Fe or 59Fe-Tf complex and 3H-mannitol) was delivered to each cannulated carotid artery via a slow driven pump (Harvard Compact Infusion Pump, Model 975), at 0.4 mL/min (therefore, the total rate of perfusion of each carotid artery was 4.3 mL/min). The final concentration of 59Fe in the arterial inflow was 1 nM. At the end of each perfusion (5, 10, 15 or 30 min) the Harvard pump was switched off and the brain vascular system washed for 30 s with a saline containing 1.0 mM EDTA, to remove iron adsorbed to the luminal surface and the luminal content (Deane and Bradbury 1990). 3H-mannitol served as a reference molecule, and its distribution volume (< 5 μL/g) in the vascular washed brain was subtracted from the total 59Fe uptake.
Transferrin–59Fe complex
The transferrin–59Fe complex was prepared by incubating the same volume of 59Fe–Ringer solution with rat apo-transferrin for 1 h at 37°C to ensure complete binding of 59Fe. Excess free iron was removed, and binding confirmed, by subjecting the solution to ultrafiltration using a membrane with a 30 000-Da cut-off (Micropore, Bedford, MA, USA). This showed that > 99% of 59Fe was bound. The free iron in the perfusate in the presence of Tf is expected to be extremely low, as Tf has a very high affinity for iron, i.e. Kd = 1022/M (Thorstensen and Romslo 1990; Bradbury 1997). The concentration of Tf of 0.5 nM in the present studies would not saturate the TfR as the dissociation constants for di-ferric-Tf and mono-ferric-Tf are about 108 and 106/M, respectively (Sawyer and Krantz 1986; Thorstensen and Romslo 1990). In contrast, there was no binding of 59Fe in the absence of transferrin in the perfusate as > 99% of 59Fe was filterable.
Capillary separation
This was carried out as described (Triguero et al. 1990; Preston et al. 1995; Zlokovic 1995). Briefly, the cold brain was weighed and homogenized in a cold solution of buffer and Dextran 70 (26%) in a ratio of 1 : 3: 4 (brain : buffer : Dextran 70). The buffer solution contains (mmol/L) HEPES, 10; NaCl, 141; KCl, 4; MgSO4.3H2O, 1.0; NaH2PO4.2H2O, 1.0; CaCl2, 2.5; glucose, 10; sodium pyruvate, 1, at pH 7.4 and gassed with 100% O2. The homogenate was then spun at 7245 g for 6 min using an Eppendorf centrifuge (Eppendorf, 54/7C), at 4°C. The pellet was carefully separated from the supernatant. Light microscopic examination confirmed that the pellet consisted mainly of networks of brain vessels, while the supernatant was essentially depleted of vasculature. Aliquots of supernatant (capillary-free brain), pellet (vessels), and perfusate were then counted in triplicates using a Packard Cobra II Gamma counter.
Calculations
59Fe uptake was expressed as a distributing volume, Vd, and calculated as (CTissue or CSF)/CPerfusate) (eq. 1), where CTissue or CSF are d.p.m./g of brain tissue (e.g. cerebral capillaries, capillary free brain homogenate, whole brain tissue, choroid plexus, brain regions) or CSF, and CPerfusate are d.p.m./mL of the perfusion fluid. Vd for the capillaries was calculated from d.p.m./g. Although it is impossible to remove all trapped fluid between isolated microvessels the variation in wet weight between different capillary preparations was only 2–3%. The effect of trapped dextran/buffer on the weight of the microvessels was very small. Inclusion of the extracellular marker indicated that the contribution was less than 0.1% of the capillary weight. As there was no significant difference in water content between different preparations, dry weight was not used. 59Fe uptake was corrected for residual radioactivity by deducting Vd for 3H-mannitol from the total 59Fe distributing volume.
The unidirectional transport rate constant, Kin (ml/g/min × 103), corresponding to the slope of the uptake curve was determined using linear regression analysis of Vd against the perfusion time T (min) as Vd = Kin T + Vi (eq. 2), where Vi is the ordinate intercept of the regression line (Deane and Bradbury 1990; Zlokovic et al. 1996).
Transferrin receptor binding studies
Iodination of Tf
125I (2 mCi) was mixed with 50 μg of holo-Tf (iron saturated transferrin) with a Tf to 125I molar ratio of 1.5. Iodination was initiated by adding 50 μg of chloramine-T and, at exactly 1 min, the reaction was arrested with 250 μg sodium metabisulfite. Iodinated Tf was separated using a Sephadex G25 column (Pharmacia) and eluted with 0.05 M potassium phosphate buffer, pH 7.5, at room temperature (22°C). The concentration of 125I-Tf was estimated by a relationship of E1% = 0.57 (with 1-cm light path) by reading the absorbance at 465 nm (Karin and Mintz 1981). The specific activity was 0.8–1.2 μCi/μg of Tf and it was stored at −75°C.
Preparation of brain regional capillary homogenates
Rats were anesthetized and the brains perfused with 40 mL of ice-cold saline via the heart with the jugular veins cut. The brain was then removed and selected regions (i.e. cerebellum, striatum, hippocampus, and frontal cortex) dissected as before. Adequate amounts of regional capillaries were obtained by pooling brain regions from five rats for each sample. Three to five pooled samples were used for statistical analysis.
Brain regional capillaries were separated from brain parenchyma by the method described above. The pellet was weighed and resuspended in homogenizing buffer (1 : 5 wt/vol) containing 100 mM HEPES, 250 mM sucrose, 150 mM NaCl, 15 mM mercaptoethanol, 10 μg/mL aprotinin, 10 μg/mL leupeptin, and 0.25 mM phenylmethylsulfanyl fluoride (PMSF). The mixture was sonicated, using a Sonifier Model 250 sonicator (Branson, Danbury, CT, USA), on ice, at the 20% duty cycle and output 5 for 25 pulses to break up the endothelial cells. The preparation was further centrifuged at 13 600 g, at 4°C, for 15 min to pellet the membrane fraction and finally re-suspended in homogenizing buffer (1 : 10 wt/vol), before using for receptor binding assay and protein determination.
Receptor binding assay
TfR binding assay was conducted according to the procedure described by Roskams and Connor (1990). For each assay, 100 μg of capillary proteins and 10 pmol/mL 125I-Tf were maintained constant, while the concentrations of unlabeled holo-Tf was varied between 0 and 2000 pmol/mL. The assay was conducted at room temperature for 60 min with a constant shaking and terminated by adding 2 mL of ice-cold homogenizing buffer at 4°C for 15 min. The pellet was separated by centrifugation at 130 000 g, at 4°C for 15 min and washed one more time before the radioactivity counting.
Receptor binding parameters, i.e. the maximum binding (Bmax) and the affinity constant (KD), a concentration of ligand that half maximally occupies the receptor, were estimated by fitting the data to one-site competitive binding curve using Prism software package 3.0 (GraphPad Software, San Diego, CA, USA Motulsky 1999). The protein concentration was determined by using a Bio-Rad (Hercules, CA, USA) assay kit.
Statistics
All data were expressed as a mean ± SEM and the differences compared by multifactorial analysis of variance and Student t-test; p < 0.05 was considered significant.
Results
59Fe accumulation by cerebral microvessels and transport into capillary-depleted brain
59Fe uptake by cerebral capillaries and transport into brain parenchyma (capillary-depleted brain) with and without Tf were linear up to 30 min, i.e. the time period studied (Fig. 1). The uptake rate constants, Kin, obtained from the slopes of the uptake curves by linear regression analysis indicated significant sequestration of iron by brain capillaries, at rates of 182 ± 23 (R2 = 0.999) and 136 ± 26 (R2 = 0.989) μL/g/min with and without Tf, respectively (Fig. 1a, Table 1). The intercepts, on the y-axis were not significantly greater than zero. These data indicate significant accumulation of circulating iron in the cerebral endothelium irrespective of whether its uptake is in the form of free Fe or Tf-Fe complexes.
Fig. 1.

59Fe uptake (as a distributing volume, mL/g) into isolated cerebral capillaries (a) and capillary-depleted brain (b), after brain perfusion, at different time periods, with (Fe-Tf, square) and without transferrin (Fe-only, circle). Values are mean ± SEM, n = 3–5 for each time point.
Table 1.
Unidirectional uptake rates, Kin, of free and Tf-bound iron in brain capillaries and capillary-depleted brain
| Samples |
Kin (μL/min/g)
|
|
|---|---|---|
| 59Fe-only | 59Fe-Tf | |
| Brain capillaries | 182.00 ± 22.93a | 136.00 ± 25.87*a |
| Capillary-depleted brain | 1.68 ± 0.56 | 1.52 ± 0.48* |
Values are mean ± SEM, n = 3–5.
Not significant for 59Fe-only versus 59Fe-Tf.
p < 0.001, for brain capillaries versus capillary-depleted brain.
59Fe transport into capillary-depleted brain was moderate (Fig. 1b). Like in brain capillaries, comparable rates for Fe were obtained in the presence and absence of transferrin, i.e. 1.68 ± 0.56 and 1.52 ± 0.48 μL/g/min, respectively (Table 1). These data suggest initial rapid sequestration of circulating iron by brain capillaries and its controlled transport from brain endothelial cells into brain ISF.
Regional brain 59Fe uptake
Regional brain uptake of 59Fe was studied in the presence and absence of Tf to establish whether there were regional differences in iron transport routes (Table 2). There were no significant differences in the Kin values for free iron versus Tf-bound iron in the cortex, striatum and hippocampus. In contrast, the rates of uptake of free iron in the cerebellum and brain stem were significantly higher than for Tf-bound iron (p < 0.05, n = 3–5). In the presence of Tf, the Kin values for iron in the cerebellum and brain stem were reduced to 54 and 68% of values without Tf, respectively (Table 2).
Table 2.
Brain regional unidirectional uptake rates, Kin, of free and Tf-bound iron
| Brain regions |
Kin (μL/min/g)
|
|
|---|---|---|
| 59Fe-only | 59Fe-Tf | |
| Frontal cortex | 8.54 ± 1.33 | 5.87 ± 0.53*c |
| Striatum | 14.65 ± 3.33 | 16.67 ± 2.67* |
| Hippocampus | 7.75 ± 2.00 | 12.59 ± 2.63* |
| Cerebellum | 16.31 ± 2.13d | 8.80 ± 0.86ab |
| Brain stem | 12.60 ± 1.61 | 4.85 ± 0.26ac |
Values are mean ± SEM, n = 3–5.
Not significant for 59Fe-only versus 59Fe-Tf.
p < 0.05, for 59Fe-Tf versus 59Fe-only.
p < 0.05, for cerebellum versus striatum with 59Fe-Tf.
p < 0.05, for brain stem or frontal cortex versus striatum or hippocampus with 59Fe-Tf.
p < 0.05, for cerebellum versus hippocampus or frontal cortex with 59Fe-only.
Uptake of iron into the brain regions (Table 2) mainly reflects its significant regional uptake and/or sequestration by the microvessels, which is a major component of iron uptake by the brain, as shown in Table 1. The Kin values for transport of iron in either form into capillary depleted brain reflecting its transcytosis across the BBB were about 1% of its respective uptake values by the isolated capillaries expressed per unit weight. In the brain in situ, however, the microvessels represent a relatively small faction compared with non-vascular tissue. Consequently, the rates of uptake of iron by the brain regions expressed per unit weight (Table 2) are one order of magnitude lower than for its uptake by brain capillaries, but still much higher than for its transport into capillary-depleted brain (Table 1).
There were also regional differences in iron uptake patterns for each of these two routes, with or without Tf. For 59Fe-only perfusions, the Kin values in the cortex and hippocampus were about half of that in other brain regions. Transport rates of 59Fe-Tf were greater in the striatum or hippocampus compared with the frontal cortex or brain stem, and for striatum compared with cerebellum (Table 2).
Regional distribution of TfR in brain endothelium
To further elucidate whether the rates of 59Fe-Tf regional brain uptake correlate with the regional distribution of TfR in brain endothelium, we determined the kinetic parameters of Tf binding to TfR on brain capillary endothelium from selected regions using a receptor-binding assay (Motulsky 1999). A typical competitive binding curve of one-class receptors for hippocampal endothelium is shown in Fig. 2. Table 3 summarizes the regional values, Bmax (receptor density) and KD (binding constant) for holo-Tf, i.e. Tf fully saturated by iron. Although the affinity of binding of holo-Tf was by 3–4-fold lower in the striatum and hippocampus compared with the cortex, respectively, the maximal receptor density of TfR was by 3–7-fold higher in the striatum and hippocampus compared with the cortex, respectively. This suggests that the distribution of TfR in cerebral capillaries seems unlikely to be uniform throughout brain regions tested. It is noteworthy that the rates of 59Fe-Tf regional uptake were by 3- and 2-fold higher in the striatum and hippocampus compared with the cortex, respectively (Table 2), which correlates well with the in vitro determined regional density of TfR in brain endothelium (Table 3).
Fig. 2.

A typical one-class receptor binding curve of bound 125I-holo-transferrin to transferrin receptor on isolated brain capillaries from hippocampus at different concentrations of holo-transferrin. Data were best fitted to one-site competitive binding equation using Prism 3.0 software.
Table 3.
Kinetic parameters of 125I-holo-transferrin binding to selected brain endothelial cell homogenates
| Brain regions | KD (nM) | Bmax (pmol/mg protein) |
|---|---|---|
| Frontal cortex | 1.42 ± 0.46 | 1.81 ± 1.00 |
| Striatum | 4.39 ± 0.49a | 5.78 ± 1.43a |
| Hippocampus | 5.83 ± 1.77a | 13.30 ± 4.01a |
Values are mean ± SEM, n = 4.
p < 0.05 compared with frontal cortex.
59Fe uptake by the choroid plexus and CSF
Kin values for 59Fe uptake into the choriod plexus were similar with and without Tf, but two orders of magnitude higher than its uptake into the CSF in either form (Table 4). In the CSF, the presence of Tf significantly reduced by 57% the Kin value for iron entry compared with the rate of entry of free iron (p < 0.05, n = 3). The rates of 59Fe transport into brain parenchyma of both free iron or Tf-bound iron were by about 10-fold greater than the rates of its entry into the CSF (Fig. 3). These observed brain to CSF concentration gradients for iron possibly reflect its significant cellular uptake, in either form, by brain cells and a relatively slow transport via bulk flow from brain ISF into CSF.
Table 4.
Unidirectional uptake rates, Kin, of free and Tf-bound iron for choroid plexus and cerebrospinal fluid (CSF)
| Samples |
Kin (μL/min/g)
|
|
|---|---|---|
| 59Fe-only | 59Fe-Tf | |
| Choroid plexus | 10.39 ± 2.00b | 13.15 ± 2.50*b |
| CSF | 0.17 ± 0.01 | 0.09 ± 0.02a |
Values are mean ± SEM, n = 3–5.
Not significant for choroid plexus 59Fe-Tf versus 59Fe-only.
p < 0.05, for CSF 59Fe-Tf versus 59Fe-only.
P < 0.001 for choroid plexus versus CSF.
Fig. 3.
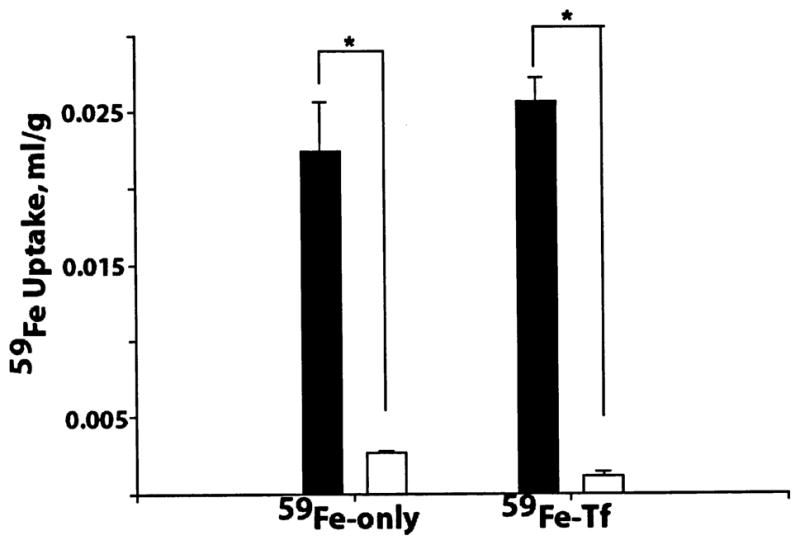
Comparison of 59Fe uptake (mL/g) into capillary-depleted brain (filled column) and cerebrospinal fluid (open column), after 15 min brain perfusion with and without transferrin. Values are mean ± SEM, n = 3–5. *p < 0.001.
Discussion
This study demonstrates that the rates of iron transport across the vascular CNS barriers with or without Tf in the arterial inflow are comparable. Our data reveal that Tf-bound Fe and/or free Fe is first taken up rapidly from brain microcirculation by brain capillary endothelium and choroid plexus epithelium where it initially sequesters. Next, Fe is released from these vascular CNS structures into brain ISF and CSF compartments in a controlled manner and at much slower rates to be utilized by brain cells. 59Fe-Tf uptake by brain capillaries is mediated via TfR located on the luminal membrane of the BBB and possibly at the basolateral membrane of the choroid plexus epithelial barrier (Jefferies et al. 1984; Moos and Morgan 2001; Takeda 2001; Zheng 2001; Pardridge 2002). A correlation between regional TfR brain endothelial density and 59Fe-Tf regional brain uptake rates may support a significant vascular accumulation of circulating iron found in this study.
While the levels of free iron in systemic plasma are very low, its concentration in local brain microcirculation may be different. Iron could dissociate from Tf after binding of Tf-Fe complexes to TfR (Bali et al. 1991; Sipe and Murphy 1991). This would release free Fe within the local brain microcirculation, and unbound free Fe could be taken up and sequestered at the BBB. Based on maximal inhibition of iron transport in the presence of anti-TfR antibodies, Ueda et al. (1993) suggested some 35–65% of Fe (depending on species) could be transported into brain via a non-Tf route. In hypotransferrinemic mice (hpx/hpx), which have < 1% transferrin, there is a significant brain iron uptake after intravenous injection of 59FeCl3 (Malecki et al. 1999). In addition, in our opinion, Takeda et al. (2002) also found evidence of non-Tf mediated uptake of brain iron, when they intravenously injected 59Fe into iron-loaded mice and found that it does not bind to Tf but is still taken up by the brain in appreciable amounts, as supported by the present study.
Although the rates of uptake of unbound and Tf-bound iron by brain microvessels isolated from the whole perfused brains were similar, the regional analysis of Fe-only to Fe-Tf uptake by the cortex, striatum, hippocampus, cerebellum and brain stem revealed subtle differences with respect to their respective free to Tf-bound Fe uptake ratios of 1.45, 0.88, 0.62, 1.85 and 2.60. This may suggest that contribution of non-Tf-mediated versus Tf-mediated routes for iron delivery across the BBB is region-dependent. Whether this reflects regional difference in density and distribution of TfR and ‘non-TfR’ transporters for free iron in brain microvessels remains to be determined. DMT1 is present in blood vessels, choroid plexus, glia and neuronal cells (William et al. 2000; Siddappa et al. 2002; Siddappa et al. 2003) and is associated mainly with endosomes, but is also found on the cell membranes (Gunshin et al. 1997; Andrews 1999; Roth et al. 2000). Ferric iron can be converted to the ferrous state by ferrireductase on the cell membranes and then transported via DMT1 (Low et al. 1987; Takeda 2001). One can speculate that non-Tf-mediated route could be important during the passage of Tf-Fe complexes through the brain microcirculation resulting in release of free Fe. In support of this concept, our preliminary data have shown that an anti-TfR antibody (OX26, 25 μg/mL) inhibits significantly 59Fe-Tf uptake at the BBB, but does not affect the uptake of free 59Fe in the absence of transferrin (data not shown).
Our data on iron uptake into the cerebellum, brain stem and CSF may suggest that Tf could provide a more controlled way for Fe transport into these CNS regions as it reduces the rates of transport by half compared with free Fe. Alternatively, the higher Tf-dependent iron uptake by the striatum and hippocampus may reflect the greater density of TfR in brain microvessels in these regions compared with the frontal cortex as suggested by the present study. This might explain the higher Fe accumulation in these regions in the aging brain and in neurodegenerative diseases (Dexter et al. 1991; Sofic et al. 1991; Connor et al. 1992; Griffiths and Crossman 1993; Loeffler et al. 1995; Smith et al. 1997; Ke and Qian 2003).
In the cytoplasm of the endothelial cells, iron is sequestered by intracellular organelles and iron binding molecules such as citrate and ascorbate or stored as ferritin (Beard et al. 1996; Burdo and Connor 2003). This would explain the significant accumulation of iron (distribution volume exceeds 1), determined in this study, associated with the cerebral capillaries. The presence of TfR on the abluminal membrane (Huwyler and Pardridge 1998) may recycle Fe back into the endothelium and/or favor its export from brain into blood by reverse-transcytosis (Zhang and Pardridge 2001). Thus, the endothelium might act as a protective vascular barrier that restricts the entry of excess Fe into brain ISF by accumulating it from either side of the BBB.
The CSF Fe is regulated by transport across the choroid plexus and bulk flow of brain ISF. The lower Fe uptake rates into the CSF with Tf, compared with free Fe, could be due to Tf-dependent iron uptake into the surrounding ependymal cells or its restricted secretion across the apical membrane at the choroid epithelium into the CSF. The greater transport of Fe, with and without Tf, into capillary-depleted brain compared with its transport across the blood–CSF barrier suggests concentration gradients for iron under physiological conditions, possibly reflecting its slow transport via bulk flow of ISF into CSF and/or its retention in the brain due to uptake and/or utilization by brain parenchymal cells.
In conclusion, the present study reveals the importance of both Tf-mediated and non-Tf-mediated routes in regulating iron transport into the brain. Our data also suggest that the major controling homeostatic points that restrict transport of Fe into the CNS in either form is its sequestration by the CNS vascular structures coupled to its limited efflux across the basolateral and apical membranes of the vascular organs, i.e. the brain capillaries and the choroid plexus, respectively. In addition, there may be differences in brain regional distribution and density of iron transport receptors. It is also suggested that the present brain perfusion model can be utilized to study CNS iron homeostasis in rodent brain with genetically manipulated iron transporters, which would ultimately help to better understand iron reducing strategies for the aging brain and neurodegenerative disorders.
Acknowledgments
We wish to thank Rich Pilsner, Betty Kong, Barb LaRue and Katie Hamm for their technical assistance. This research was supported in part by US National Institute of Environmental Health Sciences Grants ES08146-04 (WZ), NIH AG16223 (BVZ), NIH NS34467 (BVZ) and UK Wellcome Trust and Burroughs Wellcome Foundation Research Award #021366 (RD) and Travel Award #1001670 (WZ).
Abbreviations used
- BBB
blood–brain barrier
- BSA
bovine serum albumin
- CSF
cerebrospinal fluid
- DMT1
divalent metal transporter
- Fe
iron
- ISF
interstitial fluid
- PMSF
phenylmethylsulfanyl fluoride
- Tf
transferrin
- TfR
transferrin receptor
References
- Allen DD, Smith QR. Characterization of the blood–brain barrier choline transporter using the in situ rat brain perfusion technique. J Neurochem. 2001;76:1032–1041. doi: 10.1046/j.1471-4159.2001.00093.x. [DOI] [PubMed] [Google Scholar]
- Andrews NC. The iron transporter, DMT1. Int J Biochem Cell Biol. 1999;31:991–994. doi: 10.1016/s1357-2725(99)00065-5. [DOI] [PubMed] [Google Scholar]
- Bali PK, Zak O, Aisen P. A new role for the transferring receptor in the release of iron from transferrin. Biochemistry. 1991;30:324–328. doi: 10.1021/bi00216a003. [DOI] [PubMed] [Google Scholar]
- Beard JL, Dawson H, Pinero DJ. Iron metabolism: a comprehensive review. Nutr Rev. 1996;54:295–317. doi: 10.1111/j.1753-4887.1996.tb03794.x. [DOI] [PubMed] [Google Scholar]
- Berg D, Gerlach M, Youdim MBH, Double KL, Zecca L, Riederer P, Becker G. Brain iron pathways and their relevance to Parkinson’s disease. J Neurochem. 2001;79:225–236. doi: 10.1046/j.1471-4159.2001.00608.x. [DOI] [PubMed] [Google Scholar]
- Bishop GM, Robinson SR, Liu Q, Perry G, Atwood CS, Smith MA. Iron: a pathological mediator of Alzheimer disease. Dev Neurosci. 2002;24:184–187. doi: 10.1159/000065696. [DOI] [PubMed] [Google Scholar]
- Bradbury MW. Transport of iron in the blood-brain-cerebrospinal fluid system. J Neurochem. 1997;69:443–454. doi: 10.1046/j.1471-4159.1997.69020443.x. [DOI] [PubMed] [Google Scholar]
- Burdo JR, Connor JR. Brain iron uptake and homeostatic mechanisms: an overview. Biometals. 2003;16:63–75. doi: 10.1023/a:1020718718550. [DOI] [PubMed] [Google Scholar]
- Connor JR, Benkovic SA. Iron regulation in the brain: histochemical, biochemical, and molecular considerations. Ann Neurol. 1992;32:S51–S61. doi: 10.1002/ana.410320710. [DOI] [PubMed] [Google Scholar]
- Connor JR, Menzies SL. Cellular management of iron in the brain. J Neurol Sci Suppl. 1995;134:33–44. doi: 10.1016/0022-510x(95)00206-h. [DOI] [PubMed] [Google Scholar]
- Connor JR, Snyder BS, Beard JL, Fine RE, Mufson EJ. Regional distribution of iron and iron-regulatory proteins in the brain in aging and Alzheimer’s disease. J Neurosci Res. 1992;31:327–335. doi: 10.1002/jnr.490310214. [DOI] [PubMed] [Google Scholar]
- Deane R, Bradbury MWB. Transport of lead-203 at the blood–brain barrier during short cerebrovascular perfusion with saline in the rat. J Neurochem. 1990;54:905–914. doi: 10.1111/j.1471-4159.1990.tb02337.x. [DOI] [PubMed] [Google Scholar]
- Deane R, Yan SD, Submamaryan RK, et al. RAGE mediates amyloid-β peptide transport across the blood–brain barrier and accumulation in brain. Nat Med. 2003;9:907–913. doi: 10.1038/nm890. [DOI] [PubMed] [Google Scholar]
- Dexter DT, Carayon A, Javoy-Agid F, Agid Y, Wells FR, Daniel SE, Lees AJ, Jenner P, Marsden CD. Alterations in the levels of iron, ferritin and other trace metals in Parkinson’s disease and other neurodegenerative diseases affecting the basal ganglia. Brain. 1991;114:1953–1975. doi: 10.1093/brain/114.4.1953. [DOI] [PubMed] [Google Scholar]
- Egleton RD, Davis TP. Transport of the δ-opiod receptor agonist D-penicillamine2,5 enkephalin across the blood–brain barrier involves transcytosis. J Pharmaceut Sci. 1999;88:392–397. doi: 10.1021/js980410+. [DOI] [PubMed] [Google Scholar]
- Fishman JB, Rubin JB, Handrahan JV, Connor JR, Fine RE. Receptor-mediated transcytosis of transferrin across the blood–brain barrier. J Neurosci Res. 1987;18:299–304. doi: 10.1002/jnr.490180206. [DOI] [PubMed] [Google Scholar]
- Gerlach M, Ben-Shachar D, Riederer P, Youdim MBH. Altered brain metabolism of iron as a cause of neurodegenerative diseases. J Neurochem. 1994;63:793–807. doi: 10.1046/j.1471-4159.1994.63030793.x. [DOI] [PubMed] [Google Scholar]
- Griffiths PD, Crossman AR. Distribution of iron in the basal ganglia and neocortex in postmortem tissue in Parkinson’s disease and Alzheimer’s disease. Dementia. 1993;4:61–65. doi: 10.1159/000107298. [DOI] [PubMed] [Google Scholar]
- Gunshin H, Mackenzie B, Berger UV, Gunshin Y, Romero MF, Boron WF, Nussberger S, Gollan JL, Hediger MA. Cloning and characterization of a mammalian proton-coupled metal-ion transporter. Nature. 1997;388:482–488. doi: 10.1038/41343. [DOI] [PubMed] [Google Scholar]
- Hill JM, Switzer RC. The regional distribution and cellular location of iron in the rat brain. Neuroscience. 1984;11:595–603. doi: 10.1016/0306-4522(84)90046-0. [DOI] [PubMed] [Google Scholar]
- Huwyler J, Pardridge WM. Examination of blood–brain barrier transferrin receptor by confocal fluorescent microscopy of unfixed isolated rat brain capillaries. J Neurochem. 1998;70:883–886. doi: 10.1046/j.1471-4159.1998.70020883.x. [DOI] [PubMed] [Google Scholar]
- Jefferies WA, Brandon MR, Hunt SV, Williams AF, Gatter KC, Mason DY. Transferrin receptor on endothelium of brain capillaries. Nature. 1984;312:162–163. doi: 10.1038/312162a0. [DOI] [PubMed] [Google Scholar]
- Jefferies WA, Gabathuler R, Rotherberger S, Food M, Kennard ML. Pumping iron in the ‘90s. Trend Cell Biol. 1996;6:223–228. doi: 10.1016/0962-8924(96)10019-2. [DOI] [PubMed] [Google Scholar]
- Karin M, Mint ZB. Receptor-mediated endocytosis of transferrin in developmentally totipotent mouse teratocarcinoma stem cells. J Biol Chem. 1981;256:3245–3252. [PubMed] [Google Scholar]
- Ke Y, Qian ZM. Iron misregulation in the brain: a primary cause of neurodegenerative disorders. Lancet. 2003;2:246–253. doi: 10.1016/s1474-4422(03)00353-3. [DOI] [PubMed] [Google Scholar]
- Loeffler DA, Connor JR, Juneau PL, Snyder BS, Kanaley L, DeMaggio AJ, Nguyen H, Brickman CM, LeWitt PA. Transferrin and iron in normal, Alzheimer’s disease, and Parkinson’s disease brain regions. J Neurochem. 1995;65:710–724. doi: 10.1046/j.1471-4159.1995.65020710.x. [DOI] [PubMed] [Google Scholar]
- Low H, Grebing C, Lindgren A, Tally M, Sun IL, Crane FL. Involvement of transferrin in the reduction of iron by the transmembrane electron transport system. J Bioeng Biomembrane. 1987;19:535–542. doi: 10.1007/BF00770036. [DOI] [PubMed] [Google Scholar]
- Malecki EA, Cook BM, Devenyi AG, Beard JL, Connor JR. Transferrin is required for normal distribution of 59Fe and 54Mn in mouse brain. J Neuro Sci. 1999;170:112–118. doi: 10.1016/s0022-510x(99)00203-8. [DOI] [PubMed] [Google Scholar]
- Martel CL, Mackic JB, Matsubara E, Governale S, Miguel C, Miao W, McComb JG, Frangione B, Ghiso J, Zlokovic BV. Isoform-specific effects of apolipoproteins E2, E3, and E4 on cerebral capillary sequestration and blood–brain barrier transport of circulating Alzheimer’s amyloid β. J Neurochem. 1997;69:1995–2004. doi: 10.1046/j.1471-4159.1997.69051995.x. [DOI] [PubMed] [Google Scholar]
- Moos T. Immunohistochemical localization of intraneuronal transferrin receptor immunoreactivity in the adult mouse central nervous system. J Comp Neurol. 1996;375:675–692. doi: 10.1002/(SICI)1096-9861(19961125)375:4<675::AID-CNE8>3.0.CO;2-Z. [DOI] [PubMed] [Google Scholar]
- Moos T, Morgan EH. Evidence for low molecular weight, non-transferrin-bound iron in rat brain and CSF. Neurosci Res. 1998;54:486–494. doi: 10.1002/(SICI)1097-4547(19981115)54:4<486::AID-JNR6>3.0.CO;2-I. [DOI] [PubMed] [Google Scholar]
- Moos T, Morgan EH. Restricted transport of anti-transferrin receptor antibody (OX26) through the blood–brain barrier. J Neurochem. 2001;79:119–129. doi: 10.1046/j.1471-4159.2001.00541.x. [DOI] [PubMed] [Google Scholar]
- Morris CM, Keith AB, Edwardson JA, Pullen RGL. Uptake and distribution of iron and transferrin in the adult rat brain. J Neurochem. 1992;59:300–3006. doi: 10.1111/j.1471-4159.1992.tb08904.x. [DOI] [PubMed] [Google Scholar]
- Motulsky H. Analyzing Data with Graphpad Prism. GraphPad Software Inc; San Diego: 1999. pp. 269–294. [Google Scholar]
- Pardridge WM. Drug and gene targeting to the brain with molecular Trojan horses. Nature Rev Drug Disc. 2002;1:131–139. doi: 10.1038/nrd725. [DOI] [PubMed] [Google Scholar]
- Preston JE, Al-Sarraf H, Segal MB. Permeability of the developing blood–brain barrier to mannitol using the rat in situ brain perfusion technique. Dev Brain Res. 1995;87:69–76. doi: 10.1016/0165-3806(95)00060-q. [DOI] [PubMed] [Google Scholar]
- Qian ZM, Shen X. Brain iron transport and neurodegeneration. Trends Mol Med. 2001;7:103–108. doi: 10.1016/s1471-4914(00)01910-9. [DOI] [PubMed] [Google Scholar]
- Roberts RL, Fine RE. Receptor-mediated endocytosis of transferrin at the blood–brain barrier. J Cell Sci. 1987;104:521–532. doi: 10.1242/jcs.104.2.521. [DOI] [PubMed] [Google Scholar]
- Roskams, Connor Aluminium access to the brain: a role for transferrin and its receptors. Proc Natl Acad Sci. 1990;87:9024–9027. doi: 10.1073/pnas.87.22.9024. [DOI] [PMC free article] [PubMed] [Google Scholar]
- Roth JA, Hordinski C, Feng L, Dolan KG, Higgins D, Garrick MD. Differential localization of divalent metal transporter 1 with and without iron responsive element in rat PC12 and sympathetic neuronal cells. J Neurosci. 2000;20:7595–7601. doi: 10.1523/JNEUROSCI.20-20-07595.2000. [DOI] [PMC free article] [PubMed] [Google Scholar]
- Sawyer ST, Krant ZSB. Transferrin receptor number, synthesis and endocytosis during erythropoietin-induced maturation of Friend virus-infected erythroid cells. J Biol Chem. 1986;261:9187–9195. [PubMed] [Google Scholar]
- Siddappa AJM, Rao RB, Wobken JD, Leibold EA, Connor JR, Georgieff MK. Developmental changes in the expression of iron regulatory proteins and iron transport proteins in the perinatal rat brain. J Neurosci Res. 2002;68:761–775. doi: 10.1002/jnr.10246. [DOI] [PubMed] [Google Scholar]
- Siddappa AJM, Rao RB, Wobken JD, Casperson K, Leibold EA, Connor JR, Georgieff MK. Iron deficiency alters iron regulatory protein and iron transport protein expression in the in the perinatal rat brain. Pedia Res. 2003;53:800–807. doi: 10.1203/01.PDR.0000058922.67035.D5. [DOI] [PubMed] [Google Scholar]
- Sipe, Murphy Binding to cellular receptor results in increased iron release from transferrin at mildly acidic pH. J Biol Chem. 1991;266:8002–8007. [PubMed] [Google Scholar]
- Skarlatos S, Yoshikawa T, Pardridge WM. Transport of 125I-transferrin through the rat blood–brain barrier. Brain Res. 1995;683:164–171. doi: 10.1016/0006-8993(95)00363-u. [DOI] [PubMed] [Google Scholar]
- Smith MA, Harris PLR, Sayre LM, Perry G. Iron accumulation in Alzheimer disease is a source of redox-generated free radicals. Proc Natl Acad Sci. 1997;94:9866–9868. doi: 10.1073/pnas.94.18.9866. [DOI] [PMC free article] [PubMed] [Google Scholar]
- Sofic E, Paulus W, Jellinger K, Riederer P, Youdim MB. Selective increase of iron in substantia nigra zona compacta of parkinsonian brains. J Neurochem. 1991;56:978–982. doi: 10.1111/j.1471-4159.1991.tb02017.x. [DOI] [PubMed] [Google Scholar]
- Takasato Y, Rapoport SI, Smith QR. An in situ brain perfusion technique to study cerebrovascular transport in the rat. Am J Physiol. 1984;247:H484–H493. doi: 10.1152/ajpheart.1984.247.3.H484. [DOI] [PubMed] [Google Scholar]
- Takeda A. Significance of transferrin in iron delivery to brain. J Health Sci. 2001;47:520–524. [Google Scholar]
- Takeda A, Takatsuka K, Sotogaku N, Oku N. Influence of iron-saturation of plasma transferrin in iron distribution in the brain. Neurochem Int. 2002;41:223–228. doi: 10.1016/s0197-0186(02)00023-2. [DOI] [PubMed] [Google Scholar]
- Taylor EM, Morgan EH. Cellular distribution of transferrin, ferritin and iron in normal and aged human brain. J Neurosci Res. 1990;27:595–611. doi: 10.1002/jnr.490270421. [DOI] [PubMed] [Google Scholar]
- Thompson K, Menzies S, Muckenthaler M, Torti FM, Wood T, Torti SV, Hentze MW, Beard J, Connor J. Mouse brains deficient in H-ferritin have normal iron concentration but a protein profile of efficiency and increased evidence of oxidative stress. J Neurosci Res. 2003;71:46–63. doi: 10.1002/jnr.10463. [DOI] [PubMed] [Google Scholar]
- Thorstensen K, Romslo I. The role of transferrin in the mechanism of cellular iron uptake. Biochem J. 1990;271:1–10. doi: 10.1042/bj2710001. [DOI] [PMC free article] [PubMed] [Google Scholar]
- Triguero D, Buciak J, Pardridge WM. Capillary depletion method for quantification of blood–brain barrier transport of circulating peptides and plasma proteins. J Neurochem. 1990;54:1882–1888. doi: 10.1111/j.1471-4159.1990.tb04886.x. [DOI] [PubMed] [Google Scholar]
- Ueda F, Raja KB, Simpson RJ, Trowbridge IS, Bradbury MWB. Rate of 59Fe uptake into brain and CSF and the influence thereon of antobodies against the transferrin receptors. J Neurochem. 1993;60:106–113. doi: 10.1111/j.1471-4159.1993.tb05828.x. [DOI] [PubMed] [Google Scholar]
- Williams K, Wilson MA, Bressler J. Regional and developmental expression of the DMT1 in rat brain. Cell Mol Biol. 2000;46:563–571. [PubMed] [Google Scholar]
- Zhang Y, Pardridge WM. Rapid transferrin efflux from brain to blood across the blood–brain barrier. J Neurochem. 2001;76:1595–1600. doi: 10.1046/j.1471-4159.2001.00222.x. [DOI] [PubMed] [Google Scholar]
- Zheng W. Neurotoxicology of the brain barrier system: new implications. J Toxicol – Clin Toxicol. 2001;39:711–719. doi: 10.1081/clt-100108512. [DOI] [PMC free article] [PubMed] [Google Scholar]
- Zlokovic BV. Cerebrovascular permeability to peptides: manipulations of transporter systems at the blood–brain barrier. Pharmacol Res. 1995;12:1395–1406. doi: 10.1023/a:1016254514167. [DOI] [PubMed] [Google Scholar]
- Zlokovic BV, Begley DJ, Djuricic BM, Mitrovic DM. Measurement of solute transport across the blood–brain barrier in the perfused Guinea pig brain: method and application to n-methyl-a-aminoisobutyric acid. J Neurochem. 1986;46:1444–1451. doi: 10.1111/j.1471-4159.1986.tb01760.x. [DOI] [PubMed] [Google Scholar]