

Abstract
Nuclear pore complexes (NPCs) mediate cargo traffic between the nucleus and the cytoplasm of eukaryotic cells. Nuclear transport receptors (NTRs) carry cargos through NPCs by transiently binding to phenylalanine-glycine (FG) repeats on intrinsically disordered polypeptides decorating the NPCs. Major impediments to understand the transport mechanism are the thousands of FG binding sites on each NPC, whose spatial distribution is unknown, and multiple binding sites per NTR, which leads to multivalent interactions. Using single molecule fluorescence microscopy, we show that multiple NTR molecules are required for efficient transport of a large cargo, while a single NTR promotes binding to the NPC but not transport. Particle trajectories and theoretical modelling reveal a crucial role for multivalent NTR interactions with the FG network and indicate a non-uniform FG repeat distribution. A quantitative model is developed wherein the cytoplasmic side of the pore is characterized by a low effective concentration of free FG repeats and a weak FG-NTR affinity, and the centrally located dense permeability barrier is overcome by multivalent interactions, which provide the affinity necessary to permeate the barrier.
Keywords: avidity, diffusion, FG nucleoporins, nuclear pore complex, single molecule fluorescence
Introduction
Nuclear pore complexes (NPCs) facilitate bidirectional macromolecular traffic across the nuclear envelope (NE) (for reviews, see Stewart, 2007a; Wente and Rout, 2010 and Jamali et al, 2011). Hundreds of proteins, RNA particles, and metabolites interact with and/or pass through each NPC every second (Hurt et al, 2000; Ribbeck and Görlich, 2001). The vertebrate NPC is ∼120 nm in diameter and extends ∼200 nm along the transport axis due to cytoplasmic filaments and a nuclear basket structure (Stoffler et al, 1999; Fahrenkrog and Aebi, 2003). In humans, the hourglass-shaped central pore (or channel) has a minimum diameter of ∼50 nm and a length of ∼85 nm (Maimon et al, 2012). A network of ∼250–300 intrinsically disordered polypeptide domains anchored to the NPC scaffold occupies the central channel and decorates the internal and external openings (Suntharalingam and Wente, 2003; Lim et al, 2008b; Peleg and Lim, 2010). Together, these disordered nuclear pore proteins (nucleoporins or Nups) contain thousands of phenylalanine-glycine (FG) repeats to which soluble nuclear transport receptors (NTRs) transiently bind during transport. The FG network has an effective mesh size of ∼4–5 nm, allowing small molecules (<∼30 kDa) to diffuse through in a signal-independent manner (Mohr et al, 2009). Larger cargos are carried through NPCs by NTRs, after recognition of a cargo’s nuclear localization signal (NLS) or nuclear export signal (Chook and Süel, 2011; Güttler and Görlich, 2011). In the nucleus, RanGTP promotes disassembly of import complexes, freeing the cargo and allowing NTRs to diffuse back to the cytoplasm (Chook and Blobel, 2001). In the cytoplasm, export complexes are disassembled by RanGAP and Ran binding proteins (RanBPs) (Bischoff et al, 1994; Bischoff and Görlich, 1997; Kutay et al, 1997).
Numerous models describing the spatial distribution, conformations, and possible interactions of the FG polypeptides have been proposed to explain the NPC transport mechanism. There are several basic principles on which all these models agree, such as the facts that the intrinsically unfolded FG polypeptides provide the necessary binding sites for NTR–cargo complexes, and that these polymers are arranged on a scaffold of approximately cylindrical geometry. However, several points of contention remain. The polymer brush model postulates that the FG polypeptides are largely non-interacting, extended, and unentangled (Lim et al, 2006). In a contrasting model, the polymers are posited to exhibit a significant interstrand affinity, which results in a connected network resembling a hydrogel (Frey and Görlich, 2007). In addition, the arrangement of the FG polypeptides on the NPC scaffold and the distribution in space of their extended unfolded domains are still unclear, although it is clear that their density is quite high, at least in some regions. If all of the FG polypeptides were located within the central pore of the NPC, then they would occupy ∼20% of the available space (hydration would increase the occupied volume significantly) (Peleg and Lim, 2010; Tu and Musser, 2010).
Proposed mechanisms of transport also make specific assumptions regarding the distribution of the FG polypeptides within the NPC. In the hydrogel model, the FG network is distributed throughout the whole cross-section of the central pore of the NPC, and small cargos diffuse through spaces within the flexible meshwork (Ribbeck and Görlich, 2001; Mohr et al, 2009). An alternative hypothesis is that small cargos diffuse through a relatively un-occluded region of ∼10 nm diameter in the middle of the central channel (Keminer and Peters, 1999; Yamada et al, 2010; Ma et al, 2012). It is also important to consider the nuclear and cytoplasmic edges of the NPC, where the conformation and arrangement of the FG polypeptides can differ significantly from those in the middle of the pore. These edge regions are important since transport complexes are assembled and disassembled during transport at both the nuclear and cytoplasmic openings (Stewart, 2007b; Sun et al, 2008, 2013; Jamali et al, 2011). For instance, integrating biophysical and bioinformatics data, the two-gate model (Patel et al, 2007) postulates brush-like structures on both cytoplasmic and nuclear sides of the NPC, suitable for binding and (dis)assembly reactions, and a central cohesive structure in the centre of the pore that provides the permeability barrier. Consistent with this picture, immuno-gold electron microscopy studies on the yeast NPC demonstrated that more than half of the FG-Nups are distributed on the two sides of the NPC at a distance of ∼20–60 nm from the centre (Rout et al, 2000).
A major question is how NTR–cargo complexes (especially large ones), consisting of cargo and NTR molecule(s), are able to rapidly and locally displace the FG network allowing for fast translocation without collapsing the permeability barrier. For instance, the nuclear protein nucleoplasmin, which mediates nucleosome assembly, is a pentamer, and thus contains five NLSs, each of which can bind an NTR. Pentamers with a single NLS enter nuclei at about a 10-fold slower rate than those with five NLSs (Dingwall et al, 1982). The importance of multiple transport signals was also examined with a synthetic cargo containing two different NLSs that recognize different NTRs. In this case, both NTRs were required for rapid transport (Ribbeck and Görlich, 2002). For both of these studies, it is unclear whether slower nuclear uptake was a consequence of slower translocation through the pore (which could block or hinder the transport of other molecules) or whether cargos with only one NTR were largely rejected by the pore (aborted transport).
Single molecule studies are ideally suited to directly address this question. We demonstrate here using single particle tracking that large cargos with a single NTR readily bind to the cytoplasmic face of the NPC, but that efficient transport through the permeability barrier requires multiple NTRs. Surprisingly, however, a major increase in import efficiency is not accompanied by a substantial increase in residence time, indicating, as we show, that little time is spent transiting the permeability barrier region.
Results
The approach
We used narrow-field epifluorescence (Yang et al, 2004; Yang and Musser, 2006b) to directly monitor the nuclear import of a beta-galactosidase (βGal) model cargo in permeabilized cells with a 500-Hz imaging rate and ∼44 nm resolution (Supplementary Methods; Supplementary Figure S1). Fully labelled wild-type M9-βGal-16C cargo (Lyman et al, 2002) transported through NPCs in a signal-independent fashion (Supplementary Figure S2), and hence was unsuitable for our experiments. Therefore, a suitable signal-dependent model cargo was generated by four point mutations that reduced the catalytic and binding activity towards disaccharides and lowered the number of cysteines available for fluorescent dye labelling (Materials and methods; Supplementary Figure S2). The resulting cargo, M9-βGal-8C, is an ∼500 kDa tetramer (∼18 × 15 × 9 nm) with four M9 NLSs that are recognized by the transportin (importin β2) NTR. Gel filtration chromatography and single molecule photobleaching experiments indicate that up to four transportin molecules can simultaneously bind to M9-βGal-8C (Supplementary Figure S3). Nuclear import of M9-βGal-8C, labelled with eight Alexa647 dye molecules, requires transportin but not RanGTP (Figures 1A and B). NPCs were fluorescently tagged with GFP at the N-terminus of the pore membrane protein, Pom121, a centrally located Nup (Brohawn et al, 2009). The N-terminus of Pom121 is not accessible to antibodies in permeabilized cells, suggesting that this portion of the protein is located in the ER lumen, and hence, not within the FG network (Söderqvist and Hallberg, 1994), and therefore, that GFP tags on this part of Pom121 are unable to interfere with the binding of NTR–cargo complexes within the FG network. Cargo transport trajectories were determined relative to the NE using the GFP fluorescence of labelled Pom121 (Figure 1C, Supplementary videos 1 and 2).
Figure 1.

Nuclear import of M9-βGal-8C. (A) Transportin-dependent nuclear import of M9-βGal-8C. Bar, 10 μm. (B) Kinetics of nuclear import of M9-βGal-8C in the presence and absence of transportin and RanGTP, as indicated. For (A, B), images were obtained by confocal microscopy. [transportin]=1.0 μM, [RanGDP]=0.5 μM, [GTP]=1 mM, [NTF2]=1 μM, and [M9-βGal-8C]=0.25 μM. (C) Images (2 ms integration time) from abortive and entry events obtained via narrow-field epifluorescence microscopy. The green colour reveals the positions of NPCs in the NE of a permeabilized HeLa cell from the fluorescence of EGFP-rPom121, and the red colour arises from the M9-βGal-8C cargo. Numbers are time in milliseconds. Particle trajectories for the abortive and entry interactions are shown aligned to the NE position. Protein concentrations are the same as in the bulk experiments, except that [M9-βGal-8C]≈0.1 nM. Bar, 1 μm.
Single-molecule nuclear import experiments were performed largely as described earlier (Yang et al, 2004; Yang and Musser, 2006a, 2006b), with minor modifications as described in detail in Materials and methods and Supplementary data. Three major experimental parameters were measured: (1) interaction time was obtained by fitting a histogram of NPC residence times to a first-order exponential equation; (2) import efficiency (defined as the (number of entry events)/(number of abortive and entry events)) is the percentage of NPC binding events for which a cargo enters the nucleus; and (3) interaction frequency is the number of NPC interaction events per μm of NE per second.
The import efficiency of M9-βGal-8C is lower than that of M9-2xGFP
The interaction time of M9-βGal-8C with the NPC in the presence of exogeneous RanGTP and 1 μM transportin was 8.7±0.8 ms, which is similar to that observed for a significantly smaller cargo (2xGFP, ∼60 kDa, 6.8±0.9 ms) with the same M9 NLS (Figure 2A). However, the import efficiency of M9-βGal-8C is ∼50% lower (Figure 2B), consistent with the hypothesis that a larger cargo has more difficulty crossing the permeability barrier.
Figure 2.

Import efficiency and interaction time of M9-βGal-8C and 2xGFP cargos. (A, B) Comparison of interaction times and import efficiencies for M9-2xGFP and M9-βGal-8C in the presence and absence of RanGTP. (C, D) Dependence of interaction time and import efficiency for M9-βGal-8C on the transportin concentration. (E) Interaction frequencies. These data indicate that M9-βGal-8C cannot bind to NPCs in the absence of transportin. (F) Distribution of the number of bound transportin molecules in NTR–cargo complexes based on the binomial distribution. Important statistically different values at the 95% level (two-tailed Welch’s t test—see Materials and methods) are identified by the stars (*) and brackets. See Supplementary Table S1 for details. Conditions of Figure 1C for all panels, unless otherwise indicated.
A single transportin receptor promotes binding but is insufficient for efficient nuclear transport
We next investigated the import of M9-βGal-8C as a function of the transportin:cargo ratio. In these experiments, the cargo concentration was fixed at ∼0.1 nM. To preassemble transportin:cargo complexes, transportin and M9-βGal-8C were incubated together on ice for at least 20 min before addition to permeabilized cells (see Supplementary Table S1 for additional details). As the transportin:cargo (mol:mol) ratio was increased from 1:4 to 10 000:1, the import efficiency increased ∼8-fold, from 3±2 to 24±4% (Figure 2C; Supplementary Table S1). In contrast, the interaction time increased only ∼2-fold, from 4.8±0.4 to 8.7±0.8 ms (Figure 2D; Supplementary Table S1). Note that there was little difference in import efficiency and interaction time for a transportin:cargo ratio of 4:1 and higher, suggesting that any potential accumulation of transportin in the NPC that might have occurred at high transportin concentrations did not affect these parameters. These findings have important implications regarding the spatial conformations and distribution of the FG-Nups in the NPC (described later).
In the absence of exogeneous transportin, the NPC interaction frequency decreased by ≥10-fold, and therefore was essentially non-existent (Figure 2E; Supplementary Table S1). Thus, transportin is required for the cargo to bind to the NPC. Pre-treatment with RanGTP did not significantly reduce the NPC interaction frequency, confirming that binding resulted from the exogeneous transportin rather than residual NTRs within the permeabilized cells (Supplementary Table S1). At a transportin:cargo ratio of 1:4, at most ∼20% of the cargo molecules had a single transportin molecule bound (calculated using the binding affinity of the cargo for the NTR), and no more than ∼2% of cargo molecules had two transportin molecules bound (Figure 2F; Supplementary Table S1). These data support a picture in which a single transportin molecule is sufficient for binding, but not for transport.
Surprisingly, NPC binding at the 1:4 transportin:cargo ratio was very low in the absence of RanGTP, precluding determination of an interaction time and import efficiency under these conditions. For an unknown reason, substantially fewer cargos reached the cytoplasmic space near the NE under these conditions, possibly due to unknown binding interactions within the cytoplasmic compartment. Pre-treatment of permeabilized cells with RanGTP to wash away any NTRs bound at cytoplasmic locations far away from the NE did not increase the NPC interaction frequency (Supplementary Table S1).
Location of the permeability barrier
By analysing many transport trajectories, the locations within the NPC that are accessible to NTR–cargo complexes can be determined. Two-dimensional histograms were generated by calculating the frequency with which single molecule positions were observed at locations in and around an NPC. The peaks in these histograms indicate regions where the interacting particles spend most of the time. Specifically, we analysed the abortive trajectories at both high and low transportin:cargo ratios in order to determine the approximate location of the permeability barrier (Figure 3). It was not practical to obtain frequency maps for the nuclear entry events due to the infrequency of such events, especially at low transportin concentrations. Construction of true density/concentration profiles requires knowing the accessible volume within the various regions, which likely varies based on the location along the transport axis due to structural constraints, and is unknown and difficult to obtain. Nonetheless, these data suggest that the permeability barrier is centrally located, estimated to be ∼0±20 nm from the reference plane determined by the location of Pom121. This is consistent with the recent finding that the permeability barrier involves Nup98, a centrally located cohesive Nup (Hülsmann et al, 2012).
Figure 3.

Location of the permeability barrier. (A) Overlay of entry (red) and abortive (blue) trajectories obtained at a low transportin:cargo ratio (1:4) (N=37). Under these conditions, most of the M9-βGal-8C molecules are bound to a single transportin molecule (Figure 2F). Trajectories were aligned as described in Supplementary data. (B, C) Density maps of M9-βGal-8C positions for abortive events at low (1:4) (B) and high (10 000:1) (C) transportin:cargo ratios (N=34 and 41, respectively). The map in (B) is from the data in (A). Abortive cargos spend very little time within the nuclear basket region, but a significant time within the cytoplasmic filament region. (D) Density map of M9-2xGFP positions for abortive events at a high (10 000:1) transportin:cargo ratio (N=54). For (B–D), an NPC schematic is shown approximately to scale.
Analysis of the effect of multivalency on import efficiency and transport time
Figure 2 indicates that M9-βGal-8C bound to multiple transportin receptors has a clear advantage in import efficiency. What is the source of this advantage? An obvious answer is that the cargo’s overall affinity for the pore is higher due to multivalent interactions, that is, several transport receptors on the NTR–cargo complex can bind simultaneously to the FG network, and that this allows for easier penetration of the permeability barrier. The affinity due to multivalent interactions is known as ‘avidity’ (Kindt et al, 2007).
The expectation for an NTR–cargo complex with multiple simultaneous binding interactions with the FG polypeptides is that its rate of release from the FG network, and thus from the NPC, should be slower than that of a molecule with a single binding interaction (see Supplementary data). Surprisingly, however, similar NPC interaction times were observed for M9-βGal-8C cargo complexes with either one or multiple bound transportin molecules (Figure 2D). One interpretation of this finding is that RanGTP is sufficiently available on the cytoplasmic face of the NPC and effectively controls the rate of cargo release from the NPC. While RanGTP could leak through the NPC, this interpretation appears to be invalid since the M9-βGal-8C interaction time is statistically identical in the presence and absence of RanGTP (Figure 2A; Supplementary Table S1). An alternative explanation is therefore necessary to explain the similar interaction times at different transport concentrations.
Mathematical description of multivalent affinity (avidity) and implications
The paradoxical behaviour of multivalent NTR–cargo complexes in our experiments indicates several important properties of the nuclear transport process. To understand these, a mathematical description of the binding affinity of multivalent cargos is needed. To simplify the discussion, we assume that each transportin molecule on an M9-βGal-8C cargo complex can bind a single FG repeat. As described in Supplementary data, the results are readily extended and do not change substantially with multiple binding sites per NTR (Supplementary Figure S4). At any moment, a cargo with four bound transportin molecules can bind to one, two, three, or four FG repeats with each individual binding event characterized by the binding affinities (equilibrium dissociation constants) KD1, KD2, KD3, and KD4, respectively. In this situation, the apparent affinity (also known as avidity) of the complex for the FG network depends on the local availability, and thus the concentration, [F], of the FG repeats. This apparent affinity is characterized by the apparent dissociation constant, Kapp (see the derivation of Eq. S13 in Supplementary data for details):
 |
where KD1 is the binding affinity for the first FG repeat when there are four transportin molecules in the NTR–cargo complex. As discussed in Supplementary data, the values of the KD’s depend on the number of NTRs in the NTR–cargo complex.
The local dissociation time is also affected by multivalent binding. The average time required for the NTR–cargo complex with four transportin molecules to dissociate from all bound FG repeats, τapp, relates to the average time for an NTR–cargo complex with only one transportin molecule to dissociate from a bound FG repeat, τoff, as follows (see the derivation of Equations 21 and 22 in Supplementary data for details):
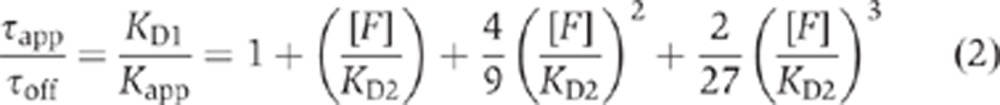 |
Thus, both the apparent affinity and the local off-time depend on the concentration of the FG repeats and the FG-NTR interaction strength. The physics behind this dependence can be understood by examining two limits. If [F]/KD2<<1 (i.e., τapp/τoff≈1 and Kapp/KD1≈1) (colloquially denoted as the ‘low avidity’ regime), then multivalency does not have significant effects on the binding affinity, because, on average and at any given time, only one of the NTRs in the complex is bound to an FG repeat. In the other limit, [F]/KD2>1 (i.e., τapp/τoff >>1 and Kapp/KD1<<1), all four NTRs are bound simultaneously to the FG repeats resulting in a higher apparent affinity (‘high avidity’ regime). The value of τapp/τoff is illustrated in Figure 4 as a function of KD2 and [F].
Figure 4.

Effect of FG concentration and NTR-FG affinity on the multivalent affinity of NTR–cargo complexes. The relationship between KD2 and τoff/τapp, according to Equation (2). The different FG concentrations, [F], for the various curves are identified in colour.
While the lifetimes in Equation (2) describe the average time to release from the last FG repeat, they differ from the overall NPC interaction times since the latter include the time to diffuse out of and away from the FG network, which could be significant. Nonetheless, Equation (2) indicates conditions under which multivalency is expected to be significant. For example, when [F]≈KD2, τapp/τoff≈2.5. Thus, the data in Figure 2D suggest that [F]<KD2 for NTR–cargo complexes with 1–4 bound transportin molecules, indicating similar off times and thus weak multivalency effects for the M9-βGal-8C cargo with four transportin molecules. This presents a serious conundrum since the total average FG concentration in the central pore is expected to be in the order of ∼30 mM (Stewart, 2007a; Peleg and Lim, 2010) and NTR affinities for an FG repeat are typically estimated to be in the micromolar range or less (Bayliss et al, 1999, 2002; Ben-Efraim and Gerace, 2001; Ribbeck and Görlich, 2001; Pyhtila and Rexach, 2003; Tetenbaum-Novatt et al, 2012). A solution to this issue is described below.
NTR-FG affinities and the distribution of FG repeats
Multiple transportin molecules are necessary for the M9-βGal-8C cargo complexes to efficiently cross the permeability barrier. A reasonable interpretation is that in order to efficiently penetrate the FG network, the enthalpic cost of disrupting any intra- or inter-polypeptide interactions and the entropic cost of disturbing the network must be compensated for by interactions of the NTR–cargo complex with the FG polypeptides. According to this picture, an NTR–cargo complex with multiple NTRs forms more compensating interactions, thus allowing it to more easily penetrate the barrier. More precisely, the total free energy of an NTR–cargo complex within the FG network is lower if the complex has a higher affinity for it. This concept is closely related to solubility, as pointed out earlier (Ribbeck and Görlich, 2001), regardless of the molecular description and the specific properties of the permeability barrier. To say that a molecule is soluble in a solvent or a heterogeneous material implies that the free energy of its interaction with it is negative (favourable). A major prediction of this model, however, is that an increased number of favourable interactions is expected to decrease the probability of release, and thus increase the residence time of the interaction. That is, multivalent interactions are expected to result in a substantially higher overall affinity for the NPC, which should result in substantially longer interactions times. This was not observed, as pointed out earlier, as interaction times varied by only ∼2-fold (Figure 2D) between low and high NTR:cargo conditions.
This discrepancy can be resolved if there is a spatially inhomogeneous distribution of the FG-Nups in the NPC. The trajectory data reveal that the overall interaction region of M9-βGal-8C with the NPC is significantly wider than the static spatial error (<20 nm) of our measurements, even for molecules that cannot penetrate the permeability barrier (Figure 3), indicating that aborted transport does not result simply from binding to and release from the surface of the permeability barrier. This indicates that the NTR–cargo complex can interact with FG polypeptides over an extended region of space at the cytoplasmic periphery of the pore (the cytoplasmic ‘vestibule’) before encountering the permeability barrier. In this picture, this ‘vestibule’ is characterized by a relatively sparse, low-density distribution of FG polypeptides (potentially with few inter-polypeptide interactions). In contrast, the central region is densely packed with FG polypeptides, thus establishing the permeability barrier. The free energy cost of penetrating this barrier can arise both from the entropic cost of displacing the dense FG-Nups and from the enthalpic cost of breaking a high number of cohesive interactions involving GLFG repeats (Patel et al, 2007) (Figure 5). As a consequence of these regions of different FG densities, multivalent interactions of the NTR–cargo complex with the FG network are expected when it is within the permeability barrier, while most of the transport time is spent in the low density cytoplasmic vestibule, where monovalent interactions dominate. Thus, although the multivalent interactions decrease the permeability barrier and significantly enhance the import efficiency, their effect on transport times is low. A quantitative description of this model is given in the next section.
Figure 5.

Models of the distribution and density of FG polypeptides. Efficient binding but low import efficiency of the M9-βGal-8C cargo at a low transportin concentration indicates that the initial binding region and the permeability barrier are distinct entities with different properties. In these models, the permeability barrier comprises a relatively dense network of FG polypeptides in the central pore, whereas the cytoplasmic and nucleoplasmic vestibules contain sparser distributions of FG polypeptides. One possibility is a network that completely occludes the pore (A). Since the M9-βGal-8C cargo (18 × 14 × 9 nm) (Jacobson et al, 1994) is too large to penetrate unassisted, a relatively unoccluded region in the middle (∼10 nm diameter) is consistent with our data (B). See text for details.
Considering the bidirectional traffic through the NPC and the similar functions of the cytoplasmic filaments and the nuclear basket, it is likely that a nucleoplasmic vestibule exists, which, like the cytoplasmic vestibule, is characterized by a low density distribution of FG polypeptides. This picture is consistent with numerous established results, including: (1) the accumulation of transport cargos at both the cytoplasmic and nucleoplasmic exits of the NPC (Feldherr et al, 1984; Richardson et al, 1988); (2) the regions of transport complex assembly and disassembly identified in single molecule fluorescence resonance energy transfer experiments (Sun et al, 2008, 2013); and (3) the density distribution map for mRNA molecules undergoing export (Siebrasse et al, 2012), which looks similar, except in reverse, to the maps in Figure 3. Note that this model predicts that transport complexes have easy access to soluble factors in the nucleoplasmic and cytoplasmic vestibules, which have been shown to be important for complex assembly and disassembly during transport (Sun et al, 2008, 2013).
From a structural standpoint, the FG domains as intrinsically unfolded chains are likely to adopt relatively diffuse, low density conformations at the pore peripheries, free from the confining effect of the structural scaffold (de Gennes, 1979). The specific molecular underpinning of the permeability barrier—whether a brush or gel or something else (Lim et al, 2008a), or whether the network is continuous across the pore or there is a relatively open hole (e.g., Figure 5)—is not critical to the model described herein.
Quantitative formulation of the model as diffusion in a double-well potential
In order to put the structural model outlined above onto a quantitative footing, we modelled cargo transport as diffusion in an effective free energy potential. The local values of the effective potential depend on the physical properties of the NTR–cargo complex and its interaction with the FG-Nups, and they are determined by the interaction strength of the NTR–cargo complex for the local FG network, and any enthalpic or entropic cost(s) of disrupting the network (Zilman et al, 2007). We assumed the effective potential shown in Figure 6, which has the following characteristics. In the absence of binding, the centrally located dense distribution of FG-Nups mounts an effective potential barrier of height Eb° due to the entropic cost of displacing the FG polypeptides, and possibly, the enthalpic cost of breaking FG–FG interactions. A lower barrier, Ev°, is present within the cytoplasmic and nucleoplasmic vestibules due to the sparser distribution of FG polypeptides. For simplicity, we assume that the cytoplasmic and nucleoplasmic vestibules are symmetrical. However, this is not essential for our conclusions, and the model can be readily modified. Binding interactions of NTRs with the FG repeats (largely enthalpic) lower the energy barrier felt by the NTR–cargo complex by an amount that depends on the number of bound NTRs, the affinity of the interaction(s), and the density of the FG repeats. Roughly speaking, the magnitude of the barrier reduction due to the binding interactions is proportional to −kBTln(Kapp), where Kapp is the local apparent affinity within the barrier region, as described by Equation (1). An important feature of the model is that because the density of the FG-Nups is low in the vestibule region, the reduction in the barrier in this region is similar for the cargos with one or more NTRs (Kapp/KD1≈1). However, in the permeability barrier region, the barrier reduction is more significant for the cargos with four bound NTRs due to multivalent binding, as follows from Equation (1). This leads to the significant enhancement of import efficiency for cargos with multiple NTRs.
Figure 6.

Double-well diffusion model. The models in Figure 5 describe a significant free energy barrier for entry into the central region of the pore, and a relatively low barrier for entering the cytoplasmic and nucleoplasmic vestibules (dashed black). The cytoplasmic and nucleoplasmic vestibules are assumed to impart similar thermodynamic barriers, resulting in a symmetric potential in the absence of RanGTP (A). M9-βGal-8C requires multiple transportin molecules to efficiently lower and cross the central barrier (red), though binding and entry to the cytoplasmic vestibule is easily accomplished with a single transportin molecule (solid black). RanGTP promotes dissociation of import complexes, by strongly binding to the NTRs. This is modelled as a free energy sink in the nuclear basket region (B). The various yi values indicate the boundaries of the regions with different properties along the transport axis and the xi values indicate their widths. The barrier region width (2x2), vestibule width (x1), and escape distance (x0) are assumed to be 40, 80, and 25 nm, respectively (see Supplementary Figures S5 and S6 for other values). The RanGTP binding energy was assumed to be ∼12 kBT (∼7 kcal/mol). Since GTP hydrolysis does not occur until recycling of the NTR back to the cytoplasm, this only approximates the binding energy. The results are relatively insensitive to the magnitude of this value, as long as it is large (? ∼6 kBT). The graphs show the import efficiency (Ptr) and mean interaction times (τ) as a function of the barrier height (Eb) for various well depths (Ev) for a particle initially at y1, as calculated in Supplementary data. Predicted values for Eb and Ev according to the experimental data vary by ∼0.5–1 kBT if the barrier width is 20 nm (Supplementary Figures S5 and S6), as might be expected for the model in Figure 5B. Experimentally determined values (Supplementary Table S1) are indicated for low and high transportin (Tr) concentrations in the presence and absence of RanGTP by the horizontal dashed lines, as indicated. See text for details.
As the exact values of the NTR–FG interaction free energies and the valencies of the interactions in the various regions are not fully known, we investigated the predicted transport probabilities (efficiencies) and times as a function of Ev, Eb and the widths of the different regions (see Supplementary data for details). The results are graphically summarized in Figure 6 and Supplementary Figures S5 and S6. Comparison of the experimental data with the theoretical calculations suggests that the height of the central permeability barrier, Eb, is of the order of 1–2 kBT for the cargos with one NTR and is reduced by about 3 kBT to about −1 kBT for the cargos with many NTRs. The well depth of the vestibules, Ev, is affected less and decreases from about −2.5 to −4 kBT at low transportin concentration to about −3 to −4.5 kBT at high transportin concentration. This is the expected mathematical consequence of a similar average number of NTR–FG interactions in the vestibule regions for cargos with one or more NTRs. Similar values were obtained in the presence and absence of RanGTP. Thus, RanGTP does not substantially affect the binding interactions in the cytoplasmic vestibule or the central permeability barrier, as expected, but it can promote transport by catalysing complex disassembly within the nucleoplasmic vestibule, releasing the free cargo, which is unable to transit back to the cytoplasm. All of these values are consistent with the general picture outlined in the last paragraph and shown schematically in Figure 6. Note that this double-well potential model is a refinement of previous single-well potential models (Frey and Görlich, 2007; Zilman et al, 2007; Tu and Musser, 2010).
Discussion
The results reported here, combined with the theoretical analyses, quantitatively elucidate the energetics of transport through the NPC. In addition, they provide important insights regarding the strength of FG–NTR interactions and the spatial distribution of the FG-Nup density within the NPC. Though central to fully understanding the energetics of transport, it is difficult to estimate the true transportin–FG interaction strength from the values discussed above since it is masked by other components of the free energy, that is, the cost associated with the displacement of the FG-Nups or other conformational changes and the potential costs of breaking any FG–FG interactions. In principle, the change in barrier height with the transportin concentration provides a measure of the binding energy of the additional NTR(s). However, it is unclear whether the change in barrier height from low to high transportin concentration is due to the binding of an additional 1, 2, or 3 transportin molecules. While four transportin molecules can feasibly be attached to the M9-βGal-8C cargo (Supplementary Figure S3), a relatively open region un-occluded by FG repeats (Figure 5B) (Keminer and Peters, 1999; Yamada et al, 2010; Ma et al, 2012) may make it difficult for all four NTRs to simultaneously bind to FG repeats. The cytoplasmic vestibule depth at a low transportin:cargo ratio provides a more direct measure of the enthalpy of an individual transportin–FG–Nup interaction, as there is likely a minimal displacement cost associated with binding in this region. Our free energy potential model predicts the strength of an individual transportin–FG interaction to be <∼10 kBT, corresponding to a tens of micromolar to millimolar dissociation constant. This range of interaction strengths is consistent with the results of recent computational studies of the energetics of the transport through the NPC (Tagliazucchi et al, 2013) and the 25-μM affinity for a single FG repeat estimated for NTF2 (Chaillan-Huntington et al, 2000). A weak transportin–FG interaction strength is required in our model to obtain millisecond transport times consistent with the data.
Numerous literature values for the affinities of NTRs for FG-Nups are substantially stronger (by an order of magnitude or more) than those derived from the quantitative analysis of the data by our model. Although varying considerably between different measurement methods, the dissociation constants typically lie in the micromolar to nanomolar range (Bayliss et al, 1999, 2002; Ben-Efraim and Gerace, 2001; Pyhtila and Rexach, 2003; Tetenbaum-Novatt et al, 2012), in particular, ∼4 μM for transportin (Ribbeck and Görlich, 2001). The discrepancy between rapid translocation times and equilibrium affinities has been noted previously (Tetenbaum-Novatt et al, 2012). Several explanations for these discrepancies are possible. First, as discussed earlier, the apparent affinity of FG–NTR interactions depends on the density of the FG repeats. It is unclear how in vitro measurement conditions compare to in vivo densities of the FG-Nups, which are significantly lower in the cytoplasmic and nucleoplasmic vestibules. Moreover, not all FG repeats may be simultaneously accessible, for example, for structural reasons or because they self-associate (Ribbeck and Görlich, 2001). And second, many in vitro binding affinities for NTRs likely do not reflect the affinity of a single FG repeat for an NTR, but rather significantly overestimate the strength of this binding interaction due to multiple interactions. To address this issue, a multivalent binding model used to explain nanomolar affinities predicted a substantially weaker affinity for a single NTR–FG interaction, even as weak as millimolar (Tetenbaum-Novatt et al, 2012), consistent with the weak NTR–FG interaction strengths predicted by our model.
The data and the analyses reported here also place constraints on existing models. For the nuclear import of M9-βGal-8C to occur rapidly, any interactions of the FG repeats with themselves, as required for the selective-phase/hydrogel model (Ribbeck and Görlich, 2001; Frey and Görlich, 2007), must be at most of similar magnitude to the interactions of FG repeats with transportin. If the FG–FG interactions were stronger, then transportin–FG interactions would not be strong enough to compensate for breaking FG–FG interactions, and the permeability barrier would be largely impenetrable. Nonetheless, even weak FG–FG interactions can significantly modulate FG–NTR interactions through density-dependent effects. The human NPC has ∼3600 FG repeats (Stewart, 2007a; Peleg and Lim, 2010), which corresponds to a concentration of ∼10–30 mM, depending on the assumptions about the spatial distribution of the FG repeats. For an FG–FG dissociation constant of KD≈1 mM and a total FG concentration of ∼30 mM, ∼80% of the FG repeats would interact with each other at any given moment, yielding a low millimolar concentration of free, but not necessarily accessible, FG repeats. Lowering the concentration of free FG repeats in this way would reduce multivalent effects, reducing the apparent binding affinity. However, our multivalency picture and free energy potential model are also consistent with an alternative hypothesis in which FG self-interactions are minimal. For example, the permeability barrier could primarily result from the density of the FG polypeptides, e.g., confined in a polymer brush configuration (Lim et al, 2006). In such a model, FG–NTR interactions are necessary to overcome the entropic cost of displacing the FG polypeptides.
In the picture developed here, relatively weak interactions are needed to overcome the permeability barrier, thus predicting that various types of different weak and/or non-specific interactions would be sufficient for overcoming this barrier. Consistent with this idea, it has been shown that relatively small changes in the hydrophobicity of a protein are sufficient to overcome the permeability barrier (Naim et al, 2009), in agreement with our finding that an excess number of hydrophobic dye labels on the large M9-βGal cargo is sufficient to penetrate the permeability barrier (Supplementary Figure S2). In addition, weak charge interactions have been suggested to be important for NPC permeability (Colwell et al, 2010; Tagliazucchi et al, 2013). The overall interaction strength is likely to be determined by a combination of these and other relatively weak effects, such as the disruption of water solvation layers around FG repeats and NTRs during binding (Levy and Onuchic, 2006). However, the physical chemistry of these interactions is still poorly understood. Future investigations are required to further define the requirements for penetration into the FG network and to connect them to a molecular interactions picture. We hope that this work will encourage more controlled measurements of NTR–FG affinities.
Materials and methods
The M9-βGal-8C cargo
Beta-galactosidase (βGal) is a homotetrameric sugar hydrolase (Juers et al, 2001). An M9 signal peptide was genetically linked to the N-terminus of each monomer (Lyman et al, 2002). To eliminate complications arising from binding to and/or hydrolysis of sugars within the NPC, two residues, E537Q (GAA→CAA) and W999L (TGG→CTG), at the catalytic site were mutated to reduce catalytic activity (kcat) by ∼105-fold and increase the KM by ∼50-fold (Yuan et al, 1994; Huber et al, 2003). Two surface cysteines, C76A (TGC→GCC) and C1021S (TGT→TCT), were mutated to reduce the total number of surface accessible cysteines in the tetramer. All mutations were generate by the QuikChange protocol (Agilent Technologies), and were confirmed by DNA sequencing. The optimized cargo, M9-βGal-8C, has four M9 NLSs and is labelled with up to eight dye molecules under saturating conditions.
Protein purification and labelling
Ran, NTF2, M9-βGal, and transportin were expressed and purified as described previously (Izaurralde et al, 1997; Lyman et al, 2002; Yang et al, 2004), except that for M9-βGal-8C, a French press was used to break cells and a Superose 6 size-exclusion column (10/300, GE Healthcare) was used as the last purification step. Transportin-ybbR has a C-terminal ybbR13 tag (DSLEFIASKLA), confirmed by DNA sequencing. Alexa647 was enzymatically attached to the ybbR tag as described (see Supplementary data) (Yin et al, 2005, 2006). Protein concentrations were determined by SDS–PAGE using BSA as a standard. M9-βGal-8C was labelled with a 225-fold molar excess of Alexa647 maleimide (Yang et al, 2004). After labelling, the excess free dye was removed with Ni-NTA resin (Superflow, Qiagen). The eluate was concentrated with a 50-kD spin column (Microsep, Life Science) and further purified by Superose 6 size-exclusion chromatography. Cargo purification and labelling was performed within a single day to minimize aggregation. The mean labelling ratio was ∼7.5 dye molecules per tetramer, as determined by comparing the dye concentration (from the absorbance at 650 nm). to the protein concentration.
Permeabilized cell assay
Cells were permeabilized and prepared for microscopy as previously described (Izaurralde et al, 1997; Lyman et al, 2002; Yang et al, 2004). In short, HeLa cells were grown on coverslips overnight, and ∼20 μl flow chambers were constructed from high-vacuum grease and a top coverslip. Cells were permeabilized by incubation with 40 μg ml digitonin in import buffer (20 mM Hepes, 110 mM KOAc, 5 mM NaOAc, 2 mM MgOAc, 1 mM EGTA, pH 7.3) for 2 min. Permeabilized cells were washed three times with import buffer containing 1.5% (w/v) polyvinylpyrrolidone (PVP, ∼360 000 g/mol). The reagent mix for import experiments was 1 mM GTP, 0.5 μM RanGDP, 1 μM transportin, 1 μM NTF2, and cargo (250 nM in bulk and ∼0.1 nM in single molecule experiments) in import buffer with 1.5% (w/v) PVP, unless otherwise indicated. RanGDP is converted into RanGTP by chromatin-bound RanGEF (RCC1) after transport into nuclei by NTF2 (Bischoff and Ponstingl, 1991).
Microscopy
Confocal and narrow-field epifluorescence images were obtained on the same inverted microscope set-up (Zeiss Axiovert 200M) using a 1.46 NA × 100 oil-immersion objective (Zeiss alpha Plan-Apochromat). A spinning disk confocal microscopy attachment (Yokogawa) equipped with a CCD camera (Andor) was used to determine bulk nuclear import rates. Narrow-field epifluorescence microscopy (300 μm excitation pinhole; ∼1 kW/cm2 at 647 nm) (Yang and Musser, 2006b) was used for single molecule experiments. In short, the illumination area in a wide-field microscope set-up was confined to ∼7 μm by the pinhole, increasing the signal-to-noise ratio sufficiently for single molecule detection. Green and far-red fluorescence channels were aligned to ∼4 nm. Static precision for M9-βGal-8C was ∼15–19 nm (see Supplementary data).
Trajectory alignment
The criteria and methods used to select NPC interaction events and align trajectories were similar to those described previously (Yang et al, 2004; Yang and Musser, 2006a, 2006b), with a few important changes, which we now describe. To determine the location of NPCs via fluorescence microscopy, a stable HeLa cell line was generated in which NPCs were tagged with GFP-rPom121, which consists of GFP N-terminally linked to rat Pom121 (see Supplementary data). The NE location was determined as described previously (Yang et al, 2004; Yang and Musser, 2006b), using the GFP fluorescence from EGFP-rPom121. Due to the very low observed transport efficiencies under some conditions, the trajectory selection rules were modified. Instead of selecting only trajectories that approached within 100 nm of a verified NE crossing point (at which at least one particle was observed to cross the NE), particles that approached within 100 nm of the measured NE position were considered to interact with an NPC. This approach will include some particles that do did not interact with NPCs, but, based on control experiments without transportin, such events accounted for <10% of those observed (Supplementary Table S1). Three types of abortive transport trajectories were observed: (i) particles that interacted at an NE location (within 100 nm) at which another particle crossed the NE, clearly establishing the presence of an NPC (∼25%); (ii) particles that crossed the NE and returned to the cytoplasm (∼50%); and (iii) particles that did not cross the NE plane, but did approach within 100 nm of the NE (∼25%). The NPC central axis was aligned to the above three categories of trajectories as follows, respectively: (i) the NE crossing point for the entry event particle(s); (ii) the centroid of the trajectory points that were on the nuclear side of the NE; and (iii) the point of closest approach to the NE. Note that the location of the points at the beginning and the end of trajectories was often poorly defined due to diffusive motion. Only trajectories for which the location of trajectory end points vis-à-vis the NE was clearly identifiable were included in the analysis. However, poorly resolved end points were not included in trajectory overlays (Figure 3).
Error analysis
Interaction time, import efficiency, and interaction frequency errors are standard errors of the mean (SD/N1/2). The standard deviation (SD) for the interaction time was determined from the graphing program (Origin) fitting routine. The SD for the import efficiency was calculated as [p(1−p)]1/2 according to the binomial distribution, where p is the experimentally measured import probability. The SD for the interaction frequency was calculated in the normal way from multiple measurements. For statistical significance, we used a two-tailed Welch’s t test, which compares the mean of two populations that may have unequal variances.
Supplementary Material
Acknowledgments
We thank Larry Gerace for the M9-βGal plasmid; Jan Ellenberg for the rPom121-3EGFP and pEGFP-Nup37 plasmids; Kaori Watanabe for purification of transportin, NTF2, and RanGDP, and the construction of transportin-ybbR; and Paul Cremer and Murray Stewart for thoughtful discussions. This work was supported by the NSERC, the NIH (GM084062), the DoD (N00014-02-1-0710), and the Welch Foundation (BE-1541).
Author contributions: The overall study was conceived and designed by L-CT and SMM. L-CT performed the experiments, with assistance from GF. L-CT, AZ, and SMM analysed the data. AZ and SMM derived the mathematical models. L-CT, AZ, and SMM wrote the paper.
Footnotes
The authors declare that they have no conflict of interest.
References
- Bayliss R, Littlewood T, Strawn LA, Wente SR, Stewart M (2002) GLFG and FxFG nucleoporins bind to overlapping sites on importin-β. J Biol Chem 277: 50597–50606 [DOI] [PubMed] [Google Scholar]
- Bayliss R, Ribbeck K, Akin D, Kent HM, Feldherr CM, Görlich D, Stewart M (1999) Interaction between NTF2 and xFxFG-containing nucleoporins is required to mediate nuclear import of RanGDP. J Mol Biol 293: 579–593 [DOI] [PubMed] [Google Scholar]
- Ben-Efraim I, Gerace L (2001) Gradient of increasing affinity of importin β for nucleoporins along the pathway of nuclear import. J Cell Biol 152: 411–417 [DOI] [PMC free article] [PubMed] [Google Scholar]
- Bischoff FR, Görlich D (1997) RanBP1 is crucial for the release of RanGTP from importin β-related nuclear transport factors. FEBS Lett 419: 249–254 [DOI] [PubMed] [Google Scholar]
- Bischoff FR, Klebe C, Kretschmer J, Wittinghofer A, Ponstingl H (1994) RanGAP1 induces GTPase activity of nuclear Ras-related Ran. Proc Natl Acad Sci USA 91: 2587–2591 [DOI] [PMC free article] [PubMed] [Google Scholar]
- Bischoff FR, Ponstingl H (1991) Catalysis of guanine nucleotide exchange on Ran by the mitotic regulator RCC1. Nature 354: 80–82 [DOI] [PubMed] [Google Scholar]
- Brohawn SG, Partridge JR, Whittle JRR, Schwartz TU (2009) The nuclear pore complex has entered the atomic age. Structure 17: 1156–1168 [DOI] [PMC free article] [PubMed] [Google Scholar]
- Chaillan-Huntington C, Braslavsky CV, Kuhlmann J, Stewart M (2000) Dissecting the interactions between NTF2, RanGTP, and the nucleoporin XFXFG repeats. J Biol Chem 275: 5874–5879 [DOI] [PubMed] [Google Scholar]
- Chook YM, Blobel G (2001) Karyopherins and nuclear import. Curr Opin Struct Biol 11: 703–715 [DOI] [PubMed] [Google Scholar]
- Chook YM, Süel KE (2011) Nuclear import by karyopherin-βs: recognition and inhibition. Biochem Biophys Acta 1813: 1593–1606 [DOI] [PMC free article] [PubMed] [Google Scholar]
- Colwell LJ, Brenner MP, Ribbeck K (2010) Charge as a selection criterion for translocation through the nuclear pore complex. PLoS Comput Biol 6: e1000747. [DOI] [PMC free article] [PubMed] [Google Scholar]
- de Gennes P (1979) Scaling Concepts in Polymer Physics Ithaca, NY: Cornell University Press [Google Scholar]
- Dingwall C, Sharnick SV, Laskey RA (1982) A polypeptide domain that specifies migration of nucleoplasmin into the nucleus. Cell 30: 449–458 [DOI] [PubMed] [Google Scholar]
- Fahrenkrog B, Aebi U (2003) The nuclear pore complex: nucleocytoplasmic transport and beyond. Nat Rev Mol Cell Biol 4: 757–766 [DOI] [PubMed] [Google Scholar]
- Feldherr CM, Kallenbach E, Schultz N (1984) Movement of karyophilic protein through the nuclear pores of oocytes. J Cell Biol 99: 2216–2222 [DOI] [PMC free article] [PubMed] [Google Scholar]
- Frey S, Görlich D (2007) A saturated FG-repeat hydrogel can reproduce the permeability properties of nuclear pore complexes. Cell 130: 512–523 [DOI] [PubMed] [Google Scholar]
- Güttler T, Görlich D (2011) Ran-dependent nuclear export mediators: a structural perspective. EMBO J 30: 3457–3474 [DOI] [PMC free article] [PubMed] [Google Scholar]
- Huber RE, Hakda S, Cheng C, Cupples CG, Edwards RA (2003) Trp-999 of beta-galactosidase (Escherichia coli) is a key residue for binding, catalysis, and synthesis of allolactose, the natural lac operon inducer. Biochemistry 42: 1796–1803 [DOI] [PubMed] [Google Scholar]
- Hülsmann BB, Labokha AA, Görlich D (2012) The permeability of reconstituted nuclear pores provides direct evidence for the selective phase model. Cell 150: 738–751 [DOI] [PubMed] [Google Scholar]
- Hurt E, Strasser K, Segref A, Bailer SM, Schlaich N, Presutti C, Tollervey D, Jansen R (2000) Mex67p mediates nuclear export of a variety of RNA polymerase II transcripts. J Biol Chem 275: 8361–8368 [DOI] [PubMed] [Google Scholar]
- Izaurralde E, Kutay U, von Kobbe C, Mattaj IW, Görlich D (1997) The asymmetric distribution of the constituents of the Ran system is essential for transport into and out of the nucleus. EMBO J 16: 6535–6547 [DOI] [PMC free article] [PubMed] [Google Scholar]
- Jacobson RH, Zhang X-J, DuBose RF, Matthews BW (1994) Three-dimensional structure of β-galactosidase from E. coli. Nature 369: 761–766 [DOI] [PubMed] [Google Scholar]
- Jamali T, Jamali Y, Mehrbod M, Mofrad MRK (2011) Nuclear pore complex: biochemistry and biophysics of nucleocytoplasmic transport in health and disease. Int Rev Cell Mol Biol 287: 233–286 [DOI] [PubMed] [Google Scholar]
- Juers DH, Heightman TD, Vasella A, McCarter JD, Mackenzie L, Withers SG, Matthews BW (2001) A structural view of the action of Escherichia coli (lacZ) beta-galactosidase. Biochemistry 40: 14781–14794 [DOI] [PubMed] [Google Scholar]
- Keminer O, Peters R (1999) Permeability of single nuclear pores. Biophys J 77: 217–228 [DOI] [PMC free article] [PubMed] [Google Scholar]
- Kindt TJ, Goldsby RA, Osborne IA, Kuby J (2007) Immunology W. H. Freeman & Co.: New York, [Google Scholar]
- Kutay U, Bischoff FR, Kostka S, Kraft R, Görlich D (1997) Export of importin α from the nucleus is mediated by a specific nuclear transport factor. Cell 90: 1061–1071 [DOI] [PubMed] [Google Scholar]
- Levy Y, Onuchic JN (2006) Water mediation in protein folding and molecular recognition. Ann Rev Biophys Biomol Struct 35: 389–415 [DOI] [PubMed] [Google Scholar]
- Lim RYH, Aebi U, Fahrenkrog B (2008a) Towards reconciling structure and function in the nuclear pore complex. Histochem Cell Biol 129: 105–116 [DOI] [PMC free article] [PubMed] [Google Scholar]
- Lim RYH, Huang N-P, Koser J, Deng J, Lau KHA, Schwarz-Herion K, Fahrenkrog B, Aebi U (2006) Flexible phenylalanine-glycine nucleoporins as entropic barriers to nucleocytoplasmic transport. Proc Natl Acad Sci USA 103: 9512–9517 [DOI] [PMC free article] [PubMed] [Google Scholar]
- Lim RYH, Ullman KS, Fahrenkrog B (2008b) Biology and biophysics of the nuclear pore complex and its components. Int Rev Cell Mol Biol 267: 299–342 [DOI] [PMC free article] [PubMed] [Google Scholar]
- Lyman SK, Guan T, Bednenko J, Wodrich H, Gerace L (2002) Influence of cargo size on Ran and energy requirements for nuclear protein import. J Cell Biol 159: 55–67 [DOI] [PMC free article] [PubMed] [Google Scholar]
- Ma J, Goryaynov A, Sarma A, Yang W (2012) Self-regulated viscous channel in the nuclear pore complex. Proc Natl Acad Sci USA 109: 7326–7331 [DOI] [PMC free article] [PubMed] [Google Scholar]
- Maimon T, Elad N, Dahan I, Medalia O (2012) The human nuclear pore complex as revealed by cryo-electron tomography. Structure 20: 998–1006 [DOI] [PubMed] [Google Scholar]
- Mohr D, Frey S, Fischer T, Güttler T, Görlich D (2009) Characterization of the passive permeability barrier of nuclear pore complexes. EMBO J 28: 2541–2553 [DOI] [PMC free article] [PubMed] [Google Scholar]
- Naim B, Zbaida D, Dagan S, Kapon R, Reich Z (2009) Cargo surface hydrophobicity is sufficient to overcome the nuclear pore complex selectivity barrier. EMBO J 28: 2697–2705 [DOI] [PMC free article] [PubMed] [Google Scholar]
- Patel SS, Belmont BJ, Sante JM, Rexach MF (2007) Natively unfolded nucleoporins gate protein diffusion across the nuclear pore complex. Cell 129: 83–96 [DOI] [PubMed] [Google Scholar]
- Peleg O, Lim RY (2010) Converging on the function of intrinsically disordered nucleoporins in the nuclear pore complex. Biol Chem 391: 719–730 [DOI] [PubMed] [Google Scholar]
- Pyhtila B, Rexach M (2003) A gradient of affinity for the karyopherin Kap95p along the yeast nuclear pore complex. J Biol Chem 278: 42699–42709 [DOI] [PubMed] [Google Scholar]
- Ribbeck K, Görlich D (2001) Kinetic analysis of translocation through nuclear pore complexes. EMBO J 20: 1320–1330 [DOI] [PMC free article] [PubMed] [Google Scholar]
- Ribbeck K, Görlich D (2002) The permeability barrier of nuclear pore complexes appears to operate via hydrophobic exclusion. EMBO J 21: 2664–2671 [DOI] [PMC free article] [PubMed] [Google Scholar]
- Richardson WD, Mills AD, Dilworth SM, Laskey RA, Dingwall C (1988) Nuclear protein migration involves two steps: rapid binding at the nuclear envelope followed by slower translocation through nuclear pores. Cell 52: 655–664 [DOI] [PubMed] [Google Scholar]
- Rout MP, Aitchison JD, Suprapto A, Hjertaas K, Zhao Y, Chait BT (2000) The yeast nuclear pore complex: composition, architecture, and transport mechanism. J Cell Biol 148: 635–651 [DOI] [PMC free article] [PubMed] [Google Scholar]
- Siebrasse JP, Kaminski T, Kubitscheck U (2012) Nuclear export of single native mRNA molecules observed by light sheet fluorescence microscopy. Proc Natl Acad Sci USA 109: 9426–9431 [DOI] [PMC free article] [PubMed] [Google Scholar]
- Söderqvist H, Hallberg E (1994) The large C-terminal region of the integral pore membrane protein, POM121, is facing the nuclear pore complex. Eur J Cell Biol 64: 186–191 [PubMed] [Google Scholar]
- Stewart M (2007a) Molecular mechanism of the nuclear protein import cycle. Nat Rev Mol Cell Biol 8: 195–208 [DOI] [PubMed] [Google Scholar]
- Stewart M (2007b) Ratcheting mRNA out of the nucleus. Mol Cell 25: 327–330 [DOI] [PubMed] [Google Scholar]
- Stoffler D, Fahrenkrog B, Aebi U (1999) The nuclear pore complex: from molecular architecture to functional dynamics. Curr Opin Cell Biol 11: 391–401 [DOI] [PubMed] [Google Scholar]
- Sun C, Fu G, Ciziene D, Stewart M, Musser SM (2013) Choreography of importin α/CAS complex assembly and disassembly at the nuclear pore complex. Proc Natl Acad Sci USA 110: E1584–E1593 [DOI] [PMC free article] [PubMed] [Google Scholar]
- Sun C, Yang W, Tu L-C, Musser SM (2008) Single molecule measurements of importin α/cargo complex dissociation at the nuclear pore. Proc Natl Acad Sci USA 105: 8613–8618 [DOI] [PMC free article] [PubMed] [Google Scholar]
- Suntharalingam M, Wente SR (2003) Peering through the pore: nuclear pore complex structure, assembly, and function. Dev Cell 4: 775–789 [DOI] [PubMed] [Google Scholar]
- Tagliazucchi M, Peleg O, Kröger M, Rabin Y, Szleifer I (2013) Effect of charge, hydrophobicity, and sequence of nucleoporins on the translocation of model particles through the nuclear pore complex. Proc Natl Acad Sci USA 110: 3363–3368 [DOI] [PMC free article] [PubMed] [Google Scholar]
- Tetenbaum-Novatt J, Hough LE, Mironska R, McKinney SA, Rout MP (2012) Nucleocytoplasmic transport: a role for nonspecific competition in karyopherin-nucleoporin interactions. Mol Cell Proteomics 11: 31–46 [DOI] [PMC free article] [PubMed] [Google Scholar]
- Tu L-C, Musser SM (2010) Single molecule studies of nucleocytoplasmic transport. Biochim Biophys Acta 1813: 1607–1618 [DOI] [PMC free article] [PubMed] [Google Scholar]
- Wente SR, Rout MP (2010) The nuclear pore complex and nuclear transport. Cold Spring Harb Perspect Biol 2: a000562. [DOI] [PMC free article] [PubMed] [Google Scholar]
- Yamada J, Phillips JL, Patel S, Goldfien G, Calestagne-Morelli A, Huang H, Rexza R, Acheson J, Krishnan VV, Newsam S, Gopinathan A, Lau EY, Colvin ME, Uversky VN, Rexach MF (2010) A bimodal distribution of two distinct categories of intrinsically-disordered structures with separate functions in FG nucleoporins. Mol Cell Proteomics 9: 2205–2224 [DOI] [PMC free article] [PubMed] [Google Scholar]
- Yang W, Gelles J, Musser SM (2004) Imaging of single-molecule translocation through nuclear pore complexes. Proc Natl Acad Sci USA 101: 12887–12892 [DOI] [PMC free article] [PubMed] [Google Scholar]
- Yang W, Musser SM (2006a) Nuclear import time and transport efficiency depend on importin β concentration. J Cell Biol 174: 951–961 [DOI] [PMC free article] [PubMed] [Google Scholar]
- Yang W, Musser SM (2006b) Visualizing single molecules transiting through nuclear pore complexes with narrow-field epifluorescence microscopy. Methods 39: 3316–3328 [DOI] [PMC free article] [PubMed] [Google Scholar]
- Yin J, Lin AJ, Golan DE, Walsh CT (2006) Site-specific protein labeling by Sfp phosphopanthetheinyl transferase. Nat Protocols 1: 280–285 [DOI] [PubMed] [Google Scholar]
- Yin J, Straight PD, McLoughlin SM, Shou Z, Lin AJ, Golan DE, Kelleher NL, Kolter R, Walsh CT (2005) Genetically encoded short peptide tag for versatile protein labeling by Sfp phosphopantetheinyl transferase. Proc Natl Acad Sci USA 102: 15815–15820 [DOI] [PMC free article] [PubMed] [Google Scholar]
- Yuan J, Martinez-Bilbao M, Huber RE (1994) Substitutions for Glu-537 of beta-galactosidase from Escherichia coli cause large decreases in catalytic activity. Biochem J 299: 527–531 [DOI] [PMC free article] [PubMed] [Google Scholar]
- Zilman A, Di Talia S, Chait BT, Rout MP, Magnasco MO (2007) Efficiency, selectivity, and robustness of nucleocytoplasmic transport. PLoS Comp Biol 3: 1281–1290 [DOI] [PMC free article] [PubMed] [Google Scholar]
Associated Data
This section collects any data citations, data availability statements, or supplementary materials included in this article.