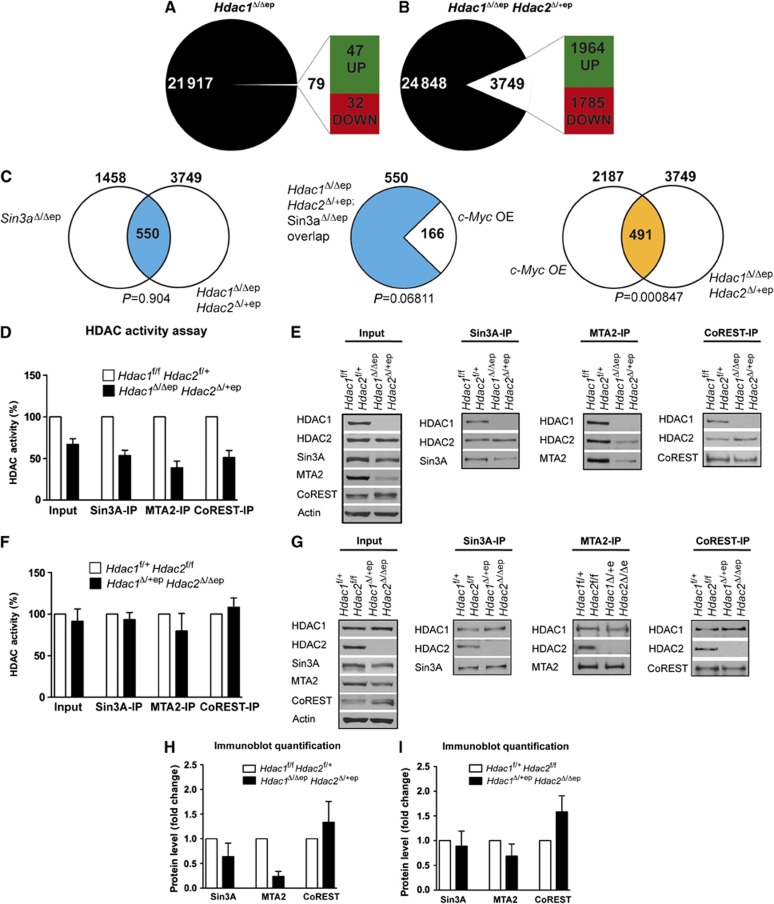
Figure 5.
Gene expression and changes in repressor complex function in Hdac1Δ/Δep Hdac2Δ/+ep mice. Agilent microarray gene expression analysis of Hdac1Δ/Δep (n=4) (A), Hdac1Δ/Δep Hdac2Δ/+ep (n=3) (B) and the corresponding control mice. RNA was isolated from adult tail epidermis from three animals of each genotype. In all, 79 annotated genes in Hdac1Δ/Δep mice (A) and 3749 genes in Hdac1Δ/Δep Hdac2Δ/+ep mice (B) were >2-fold deregulated. (C) Overlap of deregulated genes of Hdac1Δ/Δep Hdac2Δ/+ep mice with deregulated genes of Sin3aΔ/Δep mice (Nascimento et al, 2011). Out of this overlap of 550 genes, 166 genes were deregulated in c-Myc overexpressing epidermis (Frye et al, 2003). Overlap of deregulated genes in c-Myc overexpressing (OE) epidermis with deregulated genes of Hdac1Δ/Δep Hdac2Δ/+ep mice. Significance of overlaps was determined by a hypergeometric probability test. (D–G) Sin3A, NuRD and CoREST complexes were immunoprecipitated from keratinocyte extracts of control, Hdac1Δ/Δep Hdac2Δ/+ep (D, E) and Hdac1Δ/+ep Hdac2Δ/Δep (F, G) mice with antibodies against Sin3A, MTA2 and CoREST. (D, F) Complex-associated HDAC activity was measured in input and IPs. Controls are set to 100%. n=4. (E, G) Immunoprecipitated proteins were analysed on immunoblots with HDAC1, HDAC2, Sin3A, MTA2 and CoREST antibodies. β-actin served as a loading control. (H, I) Immunoblot signals for Sin3A, MTA2 and CoREST in Hdac1Δ/Δep Hdac2Δ/+ep (H), Hdac1Δ/+ep Hdac2Δ/Δep (I) and the corresponding control keratinocytes were quantified by densitometric scanning and are shown relative to the β-actin signal. The values of wild-type controls were set to 1 (n=4). (D, F, H) Data are mean±s.d.
Source data for this figure is available on the online supplementary information page.

