

Abstract
This work reviews the most relevant present-day processing methods used to improve the accuracy of multimodal nonlinear images in the detection of epithelial cancer and the supporting stroma. Special emphasis has been placed on methods of non linear optical (NLO) microscopy image processing such as: second harmonic to autofluorescence ageing index of dermis (SAAID), tumor-associated collagen signatures (TACS), fast Fourier transform (FFT) analysis, and gray level co-occurrence matrix (GLCM)-based methods. These strategies are presented as a set of potential valuable diagnostic tools for early cancer detection. It may be proposed that the combination of NLO microscopy and informatics based image analysis approaches described in this review (all carried out on free software) may represent a powerful tool to investigate collagen organization and remodeling of extracellular matrix in carcinogenesis processes.
Keywords: nonlinear signal, nonlinear microscopy, anisotropy, gray level co-occurrence matrix, tumor-associated collagen signatures
Introduction
Over the last decade, nonlinear signals obtained from nonlinear optical (NLO) microscopy techniques have emerged as very useful tools for cancer detection.1–4 NLO microscopy has a special feature when compared with equivalent linear imaging techniques, it offers label-free deep optical sectioning capabilities.5,6 Several biological NLO microscopy techniques have been developed including two-photon excited fluorescence (TPEF), second harmonic generation (SHG), third harmonic generation (THG), and coherent anti-Stokes Raman scattering (CARS). All these methods have been applied in laser scanning microscopes and are based on the nonlinear interactions between light and excitable molecules.7,8
TPEF approach provides high-resolution images of molecular autofluorescence signals in living tissues and has proven to be useful for label-free morphological imaging in deep regions of the tissues.9,10 SHG microscopy is highly sensitive to the presence of biological structures with noncentrosymmetric molecular organization and has been successfully used to observe structural protein arrays, such as collagen.11–13 THG signal is only generated when a medium is optically heterogeneous within the focal volume scale and can be used both to reveal the presence of lipid bodies and to highlight the nuclei inside the thickness of a tissue.14,15 Moreover, CARS microscopy provides high-resolution images of the vibrational states of molecules such as symmetric and asymmetric CH-stretching vibration (ie, the main component in lipids).16,17 The combination of these techniques has turned out valuable for early detection of precancerous changes.18,19 Thus, TPEF and THG can be used to image a variety of well-documented morphologic and architectural alterations, including increased nuclear size, increased nucleus/cytoplasm ratio, and loss of normal epithelial architecture. Combined TPEF—SHG microscopies have been applied to the alteration studies both in epithelial cells and the supporting stroma.20 In particular, SHG has been useful to monitor tumor progression and carcinogenesis, providing information about complex interactions between neoplastic cells, extracellular matrix, and epithelial—stromal communication.21 The image processing of this set of NLO microscopy approaches could make it possible to reveal the relationship between signals of epithelial cells and the collagen matrix with early epithelial carcinogenesis.
The present paper reviews the most relevant processing methods used to improve the accuracy of multimodal nonlinear images (mainly TPEF and SHG) in the detection of epithelial cancer. Methods such the ratio between TPEF and SHG signals (second harmonic to autofluorescence ageing index of dermis, SAAID), tumor-associated collagen signatures (TACS), fast Fourier transform (FFT) analysis, and gray level co-occurrence matrix (GLCM)-based methods are presented as possible diagnostic tools for early cancer detection.
Contrast of Nonlinear Optical Microscopy
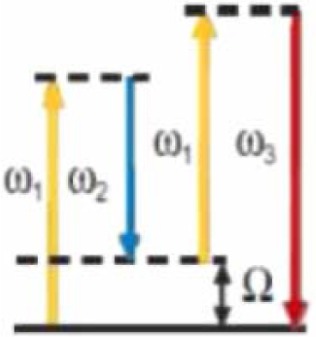
A description of the physical properties, characteristics, and principal contrast mechanisms of each method are summarized in Table 1. TPEF is a third-order NLO resonant process, where two photons excite an electron from the ground state. It is an inelastic process where photon energy is released at the sample. Two-photon absorption occurs only when the energy of the incident photons falls into the two-photon excitation (TPE) band, which is specific for each fluorescent marker. The fact that TPE depends on the square of the incident light, provides its confocal characteristics, that is, it is a process taking place only at a focal point volume. SHG is a second-order elastic NLO process and THG and CARS, on the other hand, are coherent third-order elastic NLO processes (Table 1). Given that two/three photons generate another photon with two/three times the energy of the incident photons, there is no energy released to the medium indicating that non in-focus cell photo-damage should be expected from these processes.
Table 1.
Principal characteristics of nonlinear techniques.
| TECHNIQUES | JABLONSKI DIAGRAM | NUMBER OF PHOTONS | CONTRAST MECHANICS | INFORMATION |
|---|---|---|---|---|
| TPEF |
|
2 | Electronics levels of the molecules | Autofluorescence of some biological substances (NADH, FAD, etc.) |
| SHG |
|
2 | Nonlinear properties of the medium | Non centrosymmetric molecules with spatial organization (Collagen, Elastin, etc.) |
| THG |
|
3 | Nonlinear properties of the medium | Interfaces, optical inhomogeneities, (Cell edges, lipids) |
| CARS |
|
3 | Vibrational levels of the molecules | Chemical information (lipids, DNA) |
Abbreviations: TPEF, two-photon excited fluorescence; SHG, second harmonic generation; THG, third harmonic generation; CARS, coherent anti-Stokes Raman scattering; W, frequency; Ω, vibrational level; NADH, Nicotinamide adenine dinucleotide reduced; FAD, Flavin adenine dinucleotide.
TPEF provides images with good signal/noise ratio of molecular autofluorescence signals in living tissues by stimulating native fluorophores as NADH, flavins, elastin, and others, demonstrating the capabilities of this technique for label-free morphological imaging.22,23 SHG imaging mode can probe molecular organization both at the micro- as well as the nano-scale level. SHG cancelation occurs whenever emitters are aligned in opposing directions within the focal volume of the laser. A situation occurs in isotropic media and in those media with cubic symmetry. In biological materials, where SHG emitters are well organized in noncentrosymmetric microcrystalline structures, the SHG from different emitters adds coherency, resulting in very intense SHG. Remarkable examples are collagen, acto-myosin complexes in muscle, and microtubular-based structures in living cells.24–26 THG has been used to monitor embryo development, cardiomyocytes, erythrocytes, epithelial, neuron, and striated muscle cells.27–30
It can be attested that TPEF images from epithelium can be used to identify morphofunctional changes suffered by epithelial cells. SHG is an excellent approach to visualize the collagen network of extracellular tissue, whereas THG can clearly display the nuclei size and morphology during cancer process. The processing stage of these images provides essential information for pathological diagnosis.31
Processing Nonlinear Images
Different processing methods can be used to obtain the relationship between signals of epithelial cells and the collagen matrix in the carcinogenesis process. Some of the methods that are currently used and others potentially implementable with free software, such as ImageJ (NIH, Bethesda, Maryland, US) are described below.
TPEF and SHG are very useful techniques to analyze the stroma because the two main components (collagen and elastin) can be imaged both by SHG and TPEF microscopy, respectively. Several methods, mainly using images of SHG from collagen fibers, are used to obtain information about the organization, orientation, and distribution of these fiber components. This analysis can be done by classifying methods at molecular and supramolecular levels. In the first case, the SHG polarization anisotropy32 and forward/backward methods33 are the most powerful in collagen structural organization determination at molecular level. However, this work will only show the methods oriented to analyze the supramolecular or tissue architectures scales since they are more accurate for cancer studies.
Ratio between Collagen and Elastic Tissue (SAAID)
The SAAID value is a measure of the ratio between collagen and elastic tissue. As the stroma is composed primarily of collagen and elastic fibers, it allows the use of nonlinear optical signals to discriminate between altered connective tissue regions in the surrounding tumor area.34–36 Specifically, collagen fibers are strong second harmonic signal generators, whereas elastic fibers only are autofluorescent emitters. This parameter can be applied when TPEF and SHG microscopy are simultaneously used. The SAAID index is defined as: SAAID = (ISHG − ITPEF)/(ISHG + ITPEF), where I equals the intensity of each signal and SHG/TPEF are the above preselected threshold intensities. For example, to obtain this index, we have used the collagen—elastic tissue ratio map in the whole image of ovarian tissue (Fig. 1A and B). TPEF and SHG images were accessed using ImageJ and transformed to 8 bit image (0–255 gray levels) type. To separate each signal from shot noise and the detector dark current during subsequent analysis, the data were thresholded between 15 and 255 values. The whole stroma region was selected as one ROI for each image. It has been demonstrated that collagen content was increased within the tumor stroma. The quantification of these observations is showed by the SAAID bar graph (Fig. 1C). The corresponding SAAID of adenocarcinoma type exhibits statistically significant (P < 0.05, t-test) higher values (−0.38 ± 0.03) compared to normal stroma (−0.63 ± 0.06) because of the high SHG (collagen) signal and low TPEF signal in this region. Another example of the SAAID index was the evaluation of basal cell carcinoma (BCC)—the most frequent skin cancer in Caucasian populations. Cicchi and co-workers have shown that this index differs between BCC (−0.87 ± 0.02), tumor—stroma interface (0.12 ± 0.08), and normal dermis (−0.6 ± 0.05) in all the investigated samples.35 These researchers have verified morphological modifications inside the tumor—stroma interface (regions containing only collagen). The corresponding SAAID value of this region was positive because of the high collagen SHG contribution and the reduced TPF signal.
Figure 1.

Depicting several applications of different methods to analyze NLO signals. The panel shows representative TPEF (green) and SHG (red) images of (A, D, G, J) normal and (B, E, H, K) cancer ovary. From the TPEF + SHG combination (first column), it is possible to calculate (C) the SAAID ratio. From the SGH image (remaining columns) and using regions near the epithelial/stromal interface (yellow line), it is possible to calculate: (F) TACS (measuring the collagen fiber angle relative to the epithelium); (I) FFT transforms (and fit to ellipse to estimate the anisotropy); and (L) GLCM (correlation value).
Abbreviations: Ep, epithelium; St, stroma; TPEF, two-photon excited fluorescence; SHG, second harmonic generation; SAAID, second harmonic to autofluorescence ageing index of dermis; TACS, tumor associate collagen signature; FFT, fast Fourier transform; GLCM, gray level co-occurrence matrix; white arrows, collagen fibers; white squares, regions of interest, ROI.
TACS
This parameter is frequently used to determine the collagen fibers orientation at the tumor—stroma boundary. At present, there are three well characterized TACS. They are reproducible during defined stages of tumor progression: TACS-1 (presence of dense collagen localized around small tumors during early disease), TACS-2 (collagen fibers arranged parallel to the tumor boundary—around 0°), and TACS-3 (collagen fibers disposed perpendicularly to the tumor boundary—around 90°, when the disease becomes invasive).
The collagen fiber angle calculation (relative to the tumor boundary) is required to identify the epithelial zone having abnormal appearance. After this manual selection, fiber angle could be measured using the angle tool option from the ImageJ toolbar. This tool measures the angle defined by three points. The first point is a random landmark along the fibril; the second one is the fibril closest to the epithelium (edge) of the tumor; and the third one, any point that, when connected to the first, draws a line parallel to the epithelium.
Using this parameter, for example, to analyze collagen transformation in ovarian cancer, the collagen fiber angle relative to the epithelium has been quantified. SHG images have been used along with collagen orientation, instead of the SHG signal (Fig. 1D and E). The TACS-2 straightness degree (taut) of collagen fibers became streched around the epithelium (Fig. 1D); and TACS-3, identifying radially aligned collagen fibers, that may provide the scaffolding of local invasion (Fig. 1E), have been found. In normal ovarian tissue, collagen fibers were mainly distributed around 0° (see white arrows). Approximately 75% of these fibers are parallel to the epithelium (angle ≤20°). In contrast, serous adenocarcinoma exhibits incipient regions of local invasion (TACS-3) with a set of realigned fibers, most of which are disposed around 90° (see white arrows) with respect to epithelium (Fig. 1F).
Provenzano and co-workers have also used ImageJ to quantify the collagen fiber angle relative to the tumor.37 In this work, after the tumor boundary definition, the angle relative to its tangent was measured at every 10 μm. For TACS-2, they measured several regions in six independent tumors, and graphed them as a frequency distribution resulting in a distribution of fibers around 0°. Finally, for TACS-3 they measured 71 regions in six independent tumors. These data were graphed as a histogram of frequency distribution, where most of them were close to 90°.
FFT Analysis
FFT has proven to be a good method to assign the degree of image organization.38 Thereby, the FFT of a set of aligned fibers will have higher values along the orthogonal path to the direction track of the fibers and its intensity plot seems to have an ellipsoid shape. If the fibers are perfectly aligned, the ellipse will collapse to a line. For randomly oriented fibers, the intensity plot of the corresponding FFT image looks like a circle. Therefore, the anisotropy of the image can be calculated performing an elliptic fit on the thresholded FFT images and then, to calculate the ratio between its short and long axes, ie, its aspect ratio (AR).39 A sample will be more anisotropic as the AR approaches zero, whereas it will be more isotropic when the AR is closer to one.
To perform anisotropy calculations, squared ROI in the SHG images will usually be selected, with the only requirement being that they must be placed upon the collagen network around the epithelium, since this is the region responsible for the stroma invasion. The square ROI is required by the FFT procedure of ImageJ, based on an implementation of the 2D fast Hartley transform.40 FFT can be carried out with the FFT commands under the Process function of the ImageJ menu. The anisotropy of the ovary SHG image of the stromal region has been estimated using this methodology (Fig. 1G and H). Three ROIs of 150 × 150 pixels side squared have been used to ensure that the collagen network in the vicinity of the epithelium is registered. Figure 1I shows the AR value averaged on all the examined samples. In serous type tumors, we have found that the AR index was significantly increased (P < 0.05, t-test) from normal (0.62 ± 0.04) to adenocarcinoma samples (0.78 ± 0.03).
Similarly, Williams and co-authors have analyzed automatically the alignment properties of ovarian samples by computing FFTs of the projected images and the fitting of Gaussian ellipses to the resulting Fourier components.41 FFTs from normal and carcinomatous peritoneum image stacks have revealed a significant increase in asymmetry (P < 0.05) of the tumor fibrils with respect to normal ones (0.47 ± 0.06, n = 4 vs 0.89 ± 0.02, n = 4). In brief, the results confirm the fact that, normal ovaries are more organized tissues compared to adenocarcinoma.
Another way to measure the AR of the FFT profile is calculating the covariance matrix between rows and columns of the FFT image. Then, after applying the eigenvector extraction of the covariance matrix, the square root ratio of the two eigenvalues, corresponding to the two calculated eigenvectors is used as a measure of the AR.42
GLCM Analysis
The GLCM analysis method allows the classification of different tissues based on the evaluation of geometrical collagen arrangement. It provides information on the spatial relationships between pixel brightness values in a given image. The GLCM is constructed by counting the number of occurrences of a gray level adjacent to another gray level, at a specified pixel distance “d” and dividing each counting by the total counting number to obtain a probability. The result is a matrix with rows and columns representing gray levels and elements containing the probability Pd[i,j] of the gray level co-occurrence between pixels. The matrix is usually averaged in opposite and different orientations (0–180°, 45–225°, 90–270°, and 135–315°) unless the one-dimensional feature dominates over all possible ones, in which case, the 0–180° average is sufficient. A detailed explanation on how this matrix is created from the original image can be found in Ref.42–44
The GLCM analysis can be carried out by different methods; they are commonly classified as contrast methods, orderliness methods, and statistical methods. Contrast methods can be employed in order to give quantitative information on the intensity fluctuations in the image. Among the contrast methods, homogeneity is the weighted sum of the GLCM pixel values. The weights are values that nonlinearly decrease as the distance from the GLCM matrix diagonal increases. Homogeneity gives information on the similarity of a pixel value in combination with its neighboring pixel to all the other pairs of neighboring pixels in the image. Orderliness methods are particularly applicable to images containing fibrillar structures such as SHG images of collagen, and they can be employed in order to give a quantitative measurement on the mutual orientation of collagen fiber bundles. For example, energy is the root squared sum of the GLCM pixel values. Considering that this parameter gives higher weight to the hot spots of the GLCM matrix, energy is a measure of orderliness of the image. Statistical methods are based on the statistical analysis of pixel value dependence, and they can be used for determining repetition of a certain pattern within an image. Among them, the correlation method probably represents the most powerful approach to be applied to SHG images of collagen.
Mathematically, the parameters are defined as:
For d = 0, then i = j, and therefore correlation and homogeneity take the value 1, and energy is any number between 0 and 1. The texture analyses can be performed with ImageJ GLCM-Texture plugin, which was described by Walker and collaborators.45 Also other parameters such contrast, entropy, inertia, and variance could be estimated from the GLCM approach.
This work includes a characterization of tissues by estimating the typical dimensions in which collagen maintains its organization. For example, the correlation of the image itself with a pixel separation translated from 1 to 12 or 18 pixels (Fig. 1J and L) was used. The feature was averaged at angles θ = 0, 90, 180, and 270° to take into account the fact that these images do not have a specific spatial orientation. The distance where correlation falls to 1/2, expressed in microns was measured. To perform the calculations, three ROI (100 × 100 pixel side squared) in the SHG images near the epithelium were selected. Correlation and entropy were measured using GLCM-Texture plugin from ImageJ, which was previously described by Walker and collaborators.45 Figure 1L shows that the correlation of normal fibrils falls off sharply with distance, indicating distinct, linear fibrils, whereas correlation for the fibrils in adenocarcinomas remained elevated for larger distances, implying less defined fibrillar structure. Consistent with qualitative appearances, the correlation was found to remain higher in malignant tissues with Corr50, the pixel distance where the correlation dropped below 50% of the initial value; significantly greater in adenocarcinomas (3.4 pixels) compared with normal ovarian (1.7 pixels) (Fig. 1L; P < 0.05, t-test) tissue. In same ROI, the entropy values were 6.26 ± 0.31 and 7.40 ± 0.58 in normal and adenocarcinoma tissues, respectively. This means that normal tissues exhibit lesser complexity or higher organization than malignant ones.
Zhuo and co-workers have shown similar results working with human epithelial tumors.46 They have estimated the correlation for distances ranging from 1 to 60 pixels (0.4–4.0 μm) in the horizontal direction of each region of interest. Their studies have shown that normal fibrils correlations fell off sharply with distance, whereas the precancerous and cancerous fibrils correlations remained elevated as distance increases, indicating linear fibrils in the first case, and less defined fibrillar structure in pathological conditions. Quantitatively, the collagen fibrils structure in normal ECM was 10 pixels, in precancerous ones was 28 pixels, and in cancerous one was 50 pixels. This reflects the fact that there is a link between the epithelial carcinogenesis process and progressive loss in the fine fibril structure. For a better understanding of the application possibilities, method comparisons are presented in Table 2.
Table 2.
Summary of the different methods for the analysis of nonlinear images.
| METHODS | INDEX/VARIABLE | VALUES | MEANING | CALCULATION |
|---|---|---|---|---|
| SAAID | Collagen/elastin ratio | Positive (more collagen) Negative (more elastin) |
Cancer tissues have high collagen concentration | Integrated density option in measure menu of ImageJ |
| TACS | Fiber angle (relative to epithelium) | TACS-2 (θ ≅ 0°) TACS-3 (θ ≅ 90°) |
Normal tissues present TACS-2 while adenocarcinomas show TACS-3, which may be indicative of the invasive and metastatic growth potential | Angle tool of ImageJ |
| AR | Fiber direction | AR = 0 (anisotropic) AR = 1 (isotropic) |
Normal tissues fibers show isotropic behavior. While in adenocarcinomas the fibers are more anisotropic | FFT process of ImageJ |
| GLCM | CORRELATION (Fiber separation) ENERGY | C ≅ 1 (displaced image = non displaced one, non-periodic fibers) C θ ≅ 0 (displaced image ≠ non displaced one, periodic fibers) [0, +1] |
Normal tissues show more defined and periodic fibers While adenocarcinomas tissues show more random and non-periodic fibers. Energy is highest in images with uniform gray level or uniform gray level differences at the specified separation and lower for those with more variation in gray levels |
GLCM plugin of ImageJ |
Abbreviations: SAAID, second harmonic to autofluorescence ageing index of dermis; TACS, tumor-associated collagen signatures; AR, aspect ratio; θ, angle; C, correlation; FFT, fast Fourier transform; GLCM, gray level co-occurrence matrix.
Prospects of NLO Microscopy as a Useful Tool for the Prediction of Cancer Progression
One of many fields in which NLO microscopy has proven to be useful is cancer research.21 These techniques have recently emerged as a valuable tool for high-resolution, nondestructive, chronic imaging of living tumors. The combination of different image analysis approaches described in this work may represent a powerful combination of tools to investigate collagen organization and remodeling of extracellular matrix in carcinogenesis processes. The main works developed over the last five years are summarized below. These works demonstrate the growing prospect of these methods. Additionally, some graphic examples of our experience in the identification of cancer progression are presented.
Provenzano et al. have shown the utility of TACS measured in breast cancer20,37 and Conklin et al. have found that an increased presence of collagen fibers aligned perpendicularly to the tumor boundary (TACS-3) was associated with decreased survival.1 These findings help to solidify a clinically relevant role for collagen and SHG as biomarkers with prognostic value for predicting breast cancer outcome. Nadiarnykh et al. have found that compared to normal tissue, malignant ovarian tissue was characterized by denser and more ordered collagen,47 as determined by quantitative analyses of SHG intensity (higher in cancer).48 Moreover, studies that have examined ex vivo human skin biopsies demonstrate that NLO microscopy approaches may allow to histo-pathologically characterize and discriminate normal vs. cancerous skin tissues.49–51 Performing multiple analyses of SHG and TPEF pixels in their NLO microscopy images, Zhuo et al. have found several significant differences in normal vs. neoplastic human esophageal stroma.52 Using collagen density and GLCM-texture analysis, Hu et al. have characterized the morphological details of fresh pancreatic tissues and have demonstrated that it is possible to provide real-time histological evaluation of pancreatic cancer by the nonlinear optical methods.2 In colon tissues, the utility of TACS measured from SHG images53 was used to identify healthy colon mucosa, adenomatous polyp, and adenocarcinoma. In uterus, Zhuo and co-workers using FFT and GLCM analysis have determined the link between collagen alteration and epithelial tumor progression.46
Different studies have shown that TPEF, SHG, and THG microscopy combined with precise informatics methods for image-evaluation can be used to detect structural changes in the human breast31 and ovarian epithelial/stroma interface.19,54,55 Significant differences in the distribution and organization of collagen fibers in the stroma component of these tumors have been found by using a set of scoring methods. Particularly, significant differences in the distribution and organization of collagen fibers in the stroma component of serous, mucinous, endometrioid, and mixed ovarian tumors as compared with normal ovary tissue have been found through the use of the alignment of collagen fibers (TACS), anisotropy (FFT), and correlation (GLCM) (Fig. 2A–C). Using this methodology it was possible to discriminate between cancerous and healthy tissue, with clear cut distinctions between normal, benign, borderline, and malignant tumors of serous type55 (Fig. 2D–F). Moreover, merged TPEF + SHG signals to determine the collagen/elastin content ratio in stroma have been used (Fig. 3A). Collagen content exhibits gradual increases within the stroma with tumor progression, except for borderline tumors where the collagen content decreased compared to adenomas and adenocarcinomas. The corresponding SAAID of both adenocarcinoma types exhibit statistically significant (P < 0.05, t-test) higher values compared to normal stroma because of the high SHG (collagen) and low TPEF signals in these regions (Fig. 3B). In the same work, another remarkable finding was the proper use of anisotropy measurements to discriminate between serous adenoma from mucinous adenoma and serous borderline from mucinous borderline subtypes54 (Fig. 3C and D).
Figure 2.

(A) Representative bright field H&E and SHG images of tissues diagnosed as normal ovary, serous, mucinous, endometrioid, and mixed adenocarcinomas. FFT intensity images obtained after 2D-DFT of the only one ROI are shown below the SHG images. (B) Top right, AR results corresponding to ovarian samples averaged on all ROI examined. Each bar represents the mean ± SD of independent 2D-DFT. Asterisks (**) indicate P < 0.01 difference from normal samples. (C) Histograms showing the quantitative analysis of TACS collagen fibers - in normal samples are arranged around 0° (angle < 20°), while in tumors samples, the angles are around 90° (angle >70°). Nor: normal; Ser: serous; Muc: mucinous; End: endometrioid; mix: mixed. (D) Representative SHG images of tissues diagnosed as (left to right) normal ovary, serous adenoma, serous borderline tumor, and serous adenocarcinoma. (E) Histogram exhibiting the AR quantitative outcome of the ovarian samples. They were averaged on all the examined ROI. Four ROI (120 × 120 pixel side squared) in each subtype of serous sample were selected. Each bar represents the mean ± SD of independent 2D-DFT. Significant differences from normal samples were indicated by (*) and (**): P < 0.05 and P < 0.01, respectively. (F) Correlation values in serous ovarian tumors versus distances pixels. The correlation for distances ranging from 1 to 18 pixels (0.35–6.0 μm) in three ROI of 101 × 101 pixels of interest for each biopsy was calculated.
Abbreviations: Nor, normal; Ade, adenoma; Bor, borderline; Adenoc, adenocarcinoma; St, stroma; white squares, regions of interest, ROI; yellow line, epithelial/stromal interface.
Figure 3.

Collagen/elastin ratio quantification in the ovarian stroma. (A) Representative merges of TPEF (green) and SHG (red) cross-sectional images of ovarian tissues. (B) Histogram showing the outcome of the SAAID index from stroma regions – each bar represents the mean ± SD of independent measurements. Single asterisks indicate a significant increase as compared to the nontumor tissues (P < 0.05, t-test). (C) Representative SHG (red) + THG (magenta) from ovarian images. SHG images allow to obtain anisotropy, the results of the AR (each bar represents the mean ± SD of independent measurements) of ovarian samples averaged on all ROI examined. (D) ANOVA comparisons of pathological against normal tissues. Single dagger (†) or single asterisk (*) indicate significant differences (P < 0.05), whereas double dagger (††) or double asterisk (**) indicate very significant differences (P < 0.01).
Abbreviations: Border, borderline; Adenocar, adenocarcinoma; Ep, epithelium; St, stroma; white squares, regions of interest, ROI; yellow line, epithelial/stromal interface.
Evidently, the discovery of new biomarkers will be beneficial to further refine the diagnostic tools. It has been found that, changes occurring in collagen deposition and arrangement, in early tumor development and during their progression can be used as predictable tools of the disease status. The ovary findings in this work demonstrate that AR and correlation analysis has the ability to predict the disease in human patients. Therefore, if more experiments are successful, SHG may eventually provide a more rapid, real-time substitute for traditional histopathological processing and analyses. Mortality rates are elevated because an efficient screening test does not exist presently. Approximately, 15% of ovarian cancers are found before metastasis has occurred. If ovarian cancer is found and treated before this process is triggered, the five-year survival rate will be around 94%.56 Thus, an early diagnostic test to detect premalignant changes would save many lives. In this sense, the unique attributes of NLO microscopy described here, render these methods as a promising imaging modality for disease diagnostics in the clinic. Also, the clinical utility of these optical methods could be improved by the continuous development and refinement of methods to obtain objective, quantitative information. These will be in the form of analysis algorithms such as Helmholtz analysis, wavelet analysis, and with numerical parameters relating to image frequency content and second-order gray level statistics. Further, a classification scheme could be developed by using a support vector machine.
These type of studies provides the groundwork for further use of NLO techniques in combination with specific strategies of analyses to diagnose cancer in clinic. Soon, it will be possible to use these techniques in real-time diagnosis such as intra-operative frozen section to diagnose ovary cancer, judge surgical margin, and differentiate benign and malignant lesions.
The integration of the NLO microscopy techniques plus informatics methods is one of the evolving areas in bioinformatics that promises to have a strong impact on the early detection of various diseases. It is shown here that different scoring methods extracted from images obtained with NLO microscopy techniques are useful to detect pathological changes associated with cancer progression. A challenge to pathologists is to understand which tumors are likely to progress, especially in the case of very early carcinomas.
Conclusion
The effort to develop new diagnosing methods that could better identify early lesions and consequently lead to an early diagnosis is a challenge and a stimulus for research in this area. The results of different works indicate that the combination of different image analysis approaches summarized here represent a combination of powerful tools to investigate epithelial cells transformation, collagen organization, and extracellular matrix remodeling in epithelial tumors.
The different NLO microscopy techniques, together with nonlinear signal processing methods discussed throughout this review have superior depth penetration, sensitivity, and signal-to-noise ratio and have been proved to produce less photobleaching and photo-damage. This allows nonlinear signal to overcome many of the limitations of conventional microscopy. In combination with sophisticated animal models and computer-assisted data analysis, NLO microscopy techniques and image processing methods are opening new doors to the study of tumor biology and facilitating the development of new strategies for early tumor diagnosis and treatment.
Acknowledgments
We would like to express our thanks for the access to equipment and assistance provided by the National Institute of Science and Technology on Photonics Applied to Cell Biology (INFABIC) at the State University of Campinas; INFABIC is co-funded by Fundação de Amparo a Pesquisa do Estado de São Paulo (FAPESP) (08/57906–3) and Conselho Nacional de Desenvolvimento Cientifico e Tecnológico (CNPq) (573913/2008–0). We thank the FI-UNER teachers: Mrs Menis and Mrs Monzón for her English review.
Footnotes
Author Contributions
JA conceived the manuscript. JA and VHC analyzed the data. JA wrote the first draft of the manuscript. HFC, CLC, and VHC contributed to the writing of the manuscript. JA, HFC, CLC, and VHC agree with manuscript results and conclusions. JA, HFC, CLC, and VHC made critical revisions and approved final version. All authors have reviewed and approved the final manuscript.
ACADEMIC EDITOR: J.T. Efird, Editor in Chief
FUNDING: This paper was supported by the PID-UNER 6116: “Estudios Moleculares y Celulares del Sistema de Endotelinas en cáncer colo-rectal.”
COMPETING INTERESTS: Author(s) disclose no potential conflicts of interest.
DISCLOSURES AND ETHICS
As a requirement of publication the authors have provided signed confirmation of their compliance with ethical and legal obligations including but not limited to compliance with ICMJE authorship and competing interests guidelines, that the article is neither under consideration for publication nor published elsewhere, of their compliance with legal and ethical guidelines concerning human and animal research participants (if applicable), and that permission has been obtained for reproduction of any copyrighted material. This article was subject to blind, independent, expert peer review. The reviewers reported no competing interests. Provenance: the authors were invited to submit this paper.
REFERENCES
- 1.Conklin MW, Eickhoff JC, Riching KM, et al. Aligned collagen is a prognostic signature for survival in human breast carcinoma. Am J Pathol. 2011;178(3):1221–32. doi: 10.1016/j.ajpath.2010.11.076. [DOI] [PMC free article] [PubMed] [Google Scholar]
- 2.Hu W, Zhao G, Wang C, Zhang J, Fu L. Nonlinear optical microscopy for histology of fresh normal and cancerous pancreatic tissues. PLoS ONE. 2012;7(5):e37962. doi: 10.1371/journal.pone.0037962. [DOI] [PMC free article] [PubMed] [Google Scholar]
- 3.Jain M, Robinson BD, Scherr DS, et al. Multiphoton microscopy in the evaluation of human bladder biopsies. Arch Pathol Lab Med. 2012;136(5):517–26. doi: 10.5858/arpa.2011-0147-OA. [DOI] [PMC free article] [PubMed] [Google Scholar]
- 4.Mitra R, Chao O, Urasaki Y, Goodman OB, Le TT. Detection of lipid-rich prostate circulating tumour cells with coherent anti-Stokes Raman scattering microscopy. BMC Cancer. 2012;12:540. doi: 10.1186/1471-2407-12-540. [DOI] [PMC free article] [PubMed] [Google Scholar]
- 5.Carriles R, Schafer DN, Sheetz KE, et al. Imaging techniques for harmonic and multiphoton absorption fluorescence microscopy. Rev Sci Instrum. 2009;80(8):081101. doi: 10.1063/1.3184828. [DOI] [PMC free article] [PubMed] [Google Scholar]
- 6.Sun CK. Higher harmonic generation microscopy. In: Rietdorf Jens., editor. Microscopy Techniques Advances in Biochemical Engineering/Biotechnology. Vol. 95. Berlin/Heidelberg: Springer; 2005. pp. 17–56. [DOI] [PubMed] [Google Scholar]
- 7.Pelegati VB, Adur J, De Thomaz AA, et al. Harmonic optical microscopy and fluorescence lifetime imaging platform for multimodal imaging. Microsc Res Tech. 2012;75(10):1383–94. doi: 10.1002/jemt.22078. [DOI] [PubMed] [Google Scholar]
- 8.Segawa H, Okuno M, Kano H, Leproux P, Couderc V, Hamaguchi HO. Label-free tetra-modal molecular imaging of living cells with CARS, SHG, THG and TSFG (coherent anti-Stokes Raman scattering, second harmonic generation, third harmonic generation and third-order sum frequency generation) Opt Express. 2012;20(9):9551–7. doi: 10.1364/OE.20.009551. [DOI] [PubMed] [Google Scholar]
- 9.Skala MC, Squirrell JM, Vrotsos KM, et al. Multiphoton microscopy of endogenous fluorescence differentiates normal, precancerous, and cancerous squamous epithelial tissues. Cancer Res. 2005;65(4):1180–6. doi: 10.1158/0008-5472.CAN-04-3031. [DOI] [PMC free article] [PubMed] [Google Scholar]
- 10.Helmchen F, Denk W. Deep tissue two-photon microscopy. Nat Methods. 2005;2(12):932–40. doi: 10.1038/nmeth818. [DOI] [PubMed] [Google Scholar]
- 11.Campagnola PJ, Loew LM. Second-harmonic imaging microscopy for visualizing biomolecular arrays in cells, tissues and organisms. Nat Biotechnol. 2003;21(11):1356–60. doi: 10.1038/nbt894. [DOI] [PubMed] [Google Scholar]
- 12.Hompland T, Erikson A, Lindgren M, Lindmo T, de Lange Davies C. Second-harmonic generation in collagen as a potential cancer diagnostic parameter. J Biomed Opt. 2008;13(5):054050. doi: 10.1117/1.2983664. [DOI] [PubMed] [Google Scholar]
- 13.Han X, Burke RM, Zettel ML, Tang P, Brown EB. Second harmonic properties of tumor collagen: determining the structural relationship between reactive stroma and healthy stroma. Opt Express. 2008;16(3):1846–59. doi: 10.1364/oe.16.001846. [DOI] [PubMed] [Google Scholar]
- 14.Müller M, Squier J, Wilson KR, Brakenhoff GJ. 3D microscopy of transparent objects using third-harmonic generation. J Microsc. 1998;191(3):266–74. doi: 10.1046/j.1365-2818.1998.00399.x. [DOI] [PubMed] [Google Scholar]
- 15.Débarre D, Supatto W, Pena AM, et al. Imaging lipid bodies in cells and tissues using third-harmonic generation microscopy. Nat Methods. 2006;3(1):47–53. doi: 10.1038/nmeth813. [DOI] [PubMed] [Google Scholar]
- 16.Cheng JX, Xie XS. Coherent Anti-Stokes Raman scattering microscopy: instrumentation, theory, and applications. J Phys Chem B. 2004;108:827–40. [Google Scholar]
- 17.Rodriguez LG, Lockett SJ, Holtom GR. Coherent anti-stokes Raman scattering microscopy: a biological review. Cytometry A. 2006;69(8):779–91. doi: 10.1002/cyto.a.20299. [DOI] [PubMed] [Google Scholar]
- 18.Wilder-Smith P, Krasieva T, Jung WG, et al. Noninvasive imaging of oral pre-malignancy and malignancy. J Biomed Opt. 2005;10(5):051601. doi: 10.1117/1.2098930. [DOI] [PubMed] [Google Scholar]
- 19.Adur J, Pelegati VB, Costa LF, et al. Recognition of serous ovarian tumors in human samples by multimodal nonlinear optical microscopy. J Biomed Opt. 2011;16(9):096017. doi: 10.1117/1.3626575. [DOI] [PubMed] [Google Scholar]
- 20.Provenzano PP, Eliceiri KW, Yan L, et al. Nonlinear optical imaging of cellular processes in breast cancer. Microsc Microanal. 2008;14(6):532–48. doi: 10.1017/S1431927608080884. [DOI] [PMC free article] [PubMed] [Google Scholar]
- 21.Perry SW, Burke RM, Brown EB. Two-photon and second harmonic microscopy in clinical and translational cancer research. Ann Biomed Eng. 2012;40(2):277–91. doi: 10.1007/s10439-012-0512-9. [DOI] [PMC free article] [PubMed] [Google Scholar]
- 22.Zipfel WR, Williams RM, Christie R, Nikitin AY, Hyman BT, Webb WW. Live tissue intrinsic emission microscopy using multiphoton-excited native fluorescence and second harmonic generation. Proc Natl Acad Sci USA. 2003;100(12):7075–80. doi: 10.1073/pnas.0832308100. [DOI] [PMC free article] [PubMed] [Google Scholar]
- 23.Huang S, Heikal AA, Webb WW. Two-photon fluorescence spectroscopy and microscopy of NAD(P)H and flavoprotein. Biophys J. 2002;82(5):2811–25. doi: 10.1016/S0006-3495(02)75621-X. [DOI] [PMC free article] [PubMed] [Google Scholar]
- 24.Campagnola PJ, Millard AC, Terasaki M, Hoppe PE, Malone CJ, Mohler WA. Three-dimensional high-resolution second-harmonic generation imaging of endogenous structural proteins in biological tissues. Biophys J. 2002;82:493–508. doi: 10.1016/S0006-3495(02)75414-3. [DOI] [PMC free article] [PubMed] [Google Scholar]
- 25.Chu SW, Chen SY, Chern GW, et al. Studies of chi(2)/chi(3) tensors in submicron-scaled bio-tissues by polarization harmonics optical microscopy. Biophys J. 2004;86(6):3914–22. doi: 10.1529/biophysj.103.034595. [DOI] [PMC free article] [PubMed] [Google Scholar]
- 26.Vanzi F, Capitanio M, Sacconi L, et al. New techniques in linear and non-linear laser optics in muscle research. J Muscle Res Cell Motil. 2006;27:5–7. 469–79. doi: 10.1007/s10974-006-9084-3. [DOI] [PubMed] [Google Scholar]
- 27.Chu SW, Chen SY, Tsai TH, et al. In vivo developmental biology study using noninvasive multi-harmonic generation microscopy. Opt Express. 2003;11:3093–9. doi: 10.1364/oe.11.003093. [DOI] [PubMed] [Google Scholar]
- 28.Barzda V, Greenhalgh C, der Au JA, Elmore S, van Beek J, Squier J. Visualization of mitochondria in cardiomyocytes by simultaneous harmonic generation and fluorescence microscopy. Opt Express. 2005;13:8263–76. doi: 10.1364/opex.13.008263. [DOI] [PubMed] [Google Scholar]
- 29.Millard AC, Wiseman PW, Fittinghoff DN, Wilson KR, Squier JA, Muller M. Third-harmonic generation microscopy by use of a compact femtosecond fiber laser source. Appl Opt. 1999;38:7393–7. doi: 10.1364/ao.38.007393. [DOI] [PubMed] [Google Scholar]
- 30.Yelin D, Oron D, Korkotian E, Segal M, Silberberg Y. Third-harmonic microscopy with a titanium sapphire laser. Appl Phys B Lasers. 2002;O74:S97–101. [Google Scholar]
- 31.Adur J, Pelegati VB, de Thomaz AA, et al. Quantitative changes in human epithelial cancers and osteogenesis imperfecta disease detected using nonlinear multicontrast microscopy. J Biomed Opt. 2012;17(8):081407–1. doi: 10.1117/1.JBO.17.8.081407. [DOI] [PubMed] [Google Scholar]
- 32.Vanzi F, Sacconi L, Cicchi R, Pavone FS. Protein conformation and molecular order probed by second-harmonic-generation microscopy. J Biomed Opt. 2012;17(6):060901. doi: 10.1117/1.JBO.17.6.060901. [DOI] [PubMed] [Google Scholar]
- 33.Bianchini P, Diaspro A. Three-dimensional (3D) backward and forward second harmonic generation (SHG) microscopy of biological tissues. J Biophotonics. 2008;1(6):443–50. doi: 10.1002/jbio.200810060. [DOI] [PubMed] [Google Scholar]
- 34.Cicchi R, Massi D, Sestini S, et al. Multidimensional non-linear laser imaging of basal cell carcinoma. Opt Express. 2007;15(16):10135–48. doi: 10.1364/oe.15.010135. [DOI] [PubMed] [Google Scholar]
- 35.Cicchi R, Sestini S, De Giorgi V, Massi D, Lotti T, Pavone FS. Nonlinear laser imaging of skin lesions. J Biophotonics. 2008;1(1):62–73. doi: 10.1002/jbio.200710003. [DOI] [PubMed] [Google Scholar]
- 36.Lin SJ, Jee SH, Kuo CJ, et al. Discrimination of basal cell carcinoma from normal dermal stroma by quantitative multiphoton imaging. Opt Lett. 2006;31(18):2756–8. doi: 10.1364/ol.31.002756. [DOI] [PubMed] [Google Scholar]
- 37.Provenzano PP, Inman DR, Eliceiri KW, et al. Collagen density promotes mammary tumor initiation and progression. BMC Med. 2008;6:11. doi: 10.1186/1741-7015-6-11. [DOI] [PMC free article] [PubMed] [Google Scholar]
- 38.Sivaguru M, Durgam S, Ambekar R, et al. Quantitative analysis of collagen fiber organization in injured tendons using Fourier transform-second harmonic generation imaging. Opt Express. 2010;18(24):24983–93. doi: 10.1364/OE.18.024983. [DOI] [PubMed] [Google Scholar]
- 39.Matteini P, Ratto F, Rossi F, et al. Photothermally-induced disordered patterns of corneal collagen revealed by SHG imaging. Opt Express. 2009;17(6):4868–78. doi: 10.1364/oe.17.004868. [DOI] [PubMed] [Google Scholar]
- 40.Arlo Reeves A. Thesis for the Degree of Master of Science by Thayer School of Engineering [master’s thesis] New Hampshire: Dartmouth College Hanover; 1990. [Google Scholar]
- 41.Williams RM, Flesken-Nikitin A, Ellenson LH, et al. Strategies for high-resolution imaging of epithelial ovarian cancer by laparoscopic nonlinear microscopy. Transl Oncol. 2010;3(3):181–94. doi: 10.1593/tlo.09310. [DOI] [PMC free article] [PubMed] [Google Scholar]
- 42.Cicchi R, Kapsokalyvas D, De Giorgi V, et al. Scoring of collagen organization in healthy and diseased human dermis by multiphoton microscopy. J Biophotonics. 2010;3:1–2. 34–43. doi: 10.1002/jbio.200910062. [DOI] [PubMed] [Google Scholar]
- 43.Watson JM, Rice PF, Marion SL, et al. Analysis of second-harmonic-generation microscopy in a mouse model of ovarian carcinoma. J Biomed Opt. 2012;17(7):076002. doi: 10.1117/1.JBO.17.7.076002. [DOI] [PMC free article] [PubMed] [Google Scholar]
- 44.English RS, Shenefelt PD. Keloids and hypertrophic scars. Dermatol Surg. 1999;25:631–8. doi: 10.1046/j.1524-4725.1999.98257.x. [DOI] [PubMed] [Google Scholar]
- 45.Walker RF, Jackway PT, Longstaff ID. Genetic Algorithm Optimisation of Adaptive Multi-Scale in GLCM Features. Int J Pattern Recogn. 2003;17(1):17–39. [Google Scholar]
- 46.Zhuo S, Chen J, Wu G, et al. Quantitative linking collagen alteration and epithelial tumor progression by second harmonic generation microscopy. Appl Phys Lett. 2010;96:213704. [Google Scholar]
- 47.Nadiarnykh O, LaComb RB, Brewer MA, Campagnola PJ. Alterations of the extracellular matrix in ovarian cancer studied by Second Harmonic Generation imaging microscopy. BMC Cancer. 2010;10:94. doi: 10.1186/1471-2407-10-94. [DOI] [PMC free article] [PubMed] [Google Scholar]
- 48.Kirkpatrick ND, Brewer MA, Utzinger U. Endogenous optical biomarkers of ovarian cancer evaluated with multiphoton microscopy. Cancer Epidemiol Biomarkers Prev. 2007;16(10):2048–57. doi: 10.1158/1055-9965.EPI-07-0009. [DOI] [PubMed] [Google Scholar]
- 49.Tsai TH, Jee SH, Dong CY, Lin SJ. Multiphoton microscopy in dermatological imaging. J Dermatol Sci. 2009;56(1):1–8. doi: 10.1016/j.jdermsci.2009.06.008. [DOI] [PubMed] [Google Scholar]
- 50.Lin SJ, Jee SH, Dong CY. Multiphoton microscopy: a new paradigm in dermatological imaging. Eur J Dermatol. 2007;17(5):361–6. doi: 10.1684/ejd.2007.0232. [DOI] [PubMed] [Google Scholar]
- 51.Paoli J, Smedh M, Ericson MB. Multiphoton laser scanning microscopy—a novel diagnostic method for superficial skin cancers. Semin Cutan Med Surg. 2009;28(3):190–5. doi: 10.1016/j.sder.2009.06.007. [DOI] [PubMed] [Google Scholar]
- 52.Zhuo S, Chen J, Xie S, Hong Z, Jiang X. Extracting diagnostic stromal organization features based on intrinsic two-photon excited fluorescence and second-harmonic generation signals. J Biomed Opt. 2009;14(2):020503. doi: 10.1117/1.3088029. [DOI] [PubMed] [Google Scholar]
- 53.Zhuo S, Yan J, Chen G, et al. Label-free monitoring of colonic cancer progression using multiphoton microscopy. Biomed Opt Express. 2011;2(3):615–9. doi: 10.1364/BOE.2.000615. [DOI] [PMC free article] [PubMed] [Google Scholar]
- 54.Adur J, Pelegati VB, de Thomaz AA, et al. Optical biomarkers of serous and mucinous human ovarian tumor assessed with nonlinear optics microscopies. PLoS ONE. 2012;7:e47007. doi: 10.1371/journal.pone.0047007. [DOI] [PMC free article] [PubMed] [Google Scholar]
- 55.Adur J, Pelegati VB, de Thomaz AA, et al. Second harmonic generation microscopy as a powerful diagnostic imaging modality for human ovarian cancer. J Biophotonics. 2014;7:1–2. 37–48. doi: 10.1002/jbio.201200108. [DOI] [PubMed] [Google Scholar]
- 56.American Cancer Society Cancer Facts and Figures. 2011. 2011. Available at www.cancer.org.