

Abstract
Altered cysteine dioxygenase 1 (CDO1) gene expression has been observed in several cancers but has not yet been investigated in liposarcomas. The aim of this study was to evaluate CDO1 expression in a cohort of liposarcomas and to determine its association with clinicopathological features. Existing microarray data indicated variable CDO1 expression in liposarcoma subtypes. CDO1 mRNA from a larger cohort of liposarcomas was quantified by real time-PCR, and CDO1 protein expression was determined by immunohistochemistry (IHC) in more than 300 tumor specimens. Well-differentiated liposarcomas (WDLSs) had significantly higher CDO1 gene expression and protein levels than dedifferentiated liposarcomas (DDLSs) (P < 0.001). Location of the tumor was not predictive of the expression level of CDO1 mRNA in any histological subtype of liposarcoma. Recurrent tumors did not show any difference in CDO1 expression when compared to primary tumors. CDO1 expression was upregulated as human mesenchymal stem cells (hMSCs) undergo differentiation into mature adipocytes. Our results suggest that CDO1 is a marker of liposarcoma progression and adipogenic differentiation.
Keywords: liposarcoma, cysteine dioxygenase 1, adipocyte differentiation
Introduction
Liposarcomas are a heterogeneous group of mesenchymal tumors that show variable phenotypic features, aberrant genomes, and different prognoses. It is the most common sarcoma subtype in adults and may arise in any anatomical site.1 It is believed that liposarcoma originates in early mesenchymal cell lineages rather than mature adipocytes; hence, most liposarcomas arise de novo and virtually never develop from a pre-existing benign lipoma.2 Liposarcoma tends to occur in deep-seated sites, such as the retroperitoneum, rather than within subcutaneous fat. Histologic appearance and cytogenetic analysis are indispensable for the classification of liposarcomas into three genetic subgroups that include five histological subtypes: (1) well-differentiated liposarcoma (WDLS)/dedifferentiated liposarcoma (DDLS), (2) myxoid/round cell liposarcoma, and (3) pleomorphic liposarcoma (PLS).3–5 Each histological subtype varies in the degree of adipocytic differentiation, which in turn affects its course and prognosis.6
WDLS, also called atypical lipomatous tumor, is the most common subtype, comprising 40–45% of liposarcomas.7 A portion of WDLS will undergo dedifferentiation with variable histologic grades and recurrence potential, both local and distant.8 Though morphologically distinct, WDLS and DDLS are characterized by the presence of supernumerary ring chromosomes, amplification of the 12q13–15 chromosomal region that includes both MDM2 and CDK4,8 and additional complex chromosome rearrangements. Myxoid/round cell liposarcoma is the second most common subtype of liposarcoma and is characterized by a t(12;16)(q13;p11) chromosomal translocation, resulting in either the FUSDDIT3 or the EWSR1(22q12)-DDIT3 fusion gene.9,10 The pleomorphic subtype of liposarcoma, in contrast to other histological subtypes, does not possess currently discernible characteristic genetic lesions but instead harbors a variety of complex chromosomal rearrangements.11 Hence, liposarcoma can be subdivided into two major categories based on the karyotype complexity. The first category includes myxoid/round cell liposarcoma that is characterized by a chromosomal rearrangement with an otherwise approximately diploid and stable karyotype. WDLS/DDLS is intermediate in karyotype complexity in that early changes include focal 12q13–15 amplification with few other changes and only later in tumor progression does more dramatic genomic complexity arise in a subset of cases. Thus, the changes are generally more complex than those seen in myxoid liposarcoma, but usually less prominent than that of PLS. Nonetheless, WDLS/DDLS can be grouped into the complex karyotype group based on the multiple structural changes present. In general, DDLS is more likely to develop prominent genomic complexity than is WDLS. PLS, in contrast, develops a complex karyotype early in tumorigenesis with multiple genetic rearrangements and copy number changes.
Human cysteine dioxygenase 1 (CDO1) is the product of the CDO1 gene located on chromosome 5q22–23, and is highly conserved among mammals.12 CDO1 is an important enzyme for the regulation of cellular cysteine levels and the biosynthesis of the antioxidant taurine. In the liver, CDO1 catalyzes the initial step in taurine synthesis by oxidizing L-cysteine to cysteinesulfinate, which is further metabolized into either taurine and CO2 or pyruvate and sulfate.13,14 Taurine is an essential constituent of bile and plays a vital role in the function of a variety of tissues.15 Studies in mice and rats have shown abundant CDO1 in adipose tissue, liver, brain, and kidney.16–18 Accumulation of cysteine because of low CDO1 activity is associated with cytotoxicity and neurotoxicity.19–22
Altered CDO1 levels have been observed in several cancers. Booken et al23 found that CDO1 is upregulated in Sezary syndrome, a highly malignant form of cutaneous T-cell lymphoma. In contrast, most studies reported decreased CDO1 expression in cancer. Hypermethylation within the CDO1 promoter with concomitant decreased expression has been observed in colon and breast cancer, and is also a predictor of poor prognosis in breast cancer.24,25 Promoter hypermethylation and expression of CDO1 has not been investigated to date in sarcomas. Recently, an epigenetic reactivation screen carried out in our laboratory using cell lines derived from PLSs identified CDO1 as a potential target of epigenetic regulation.
In the current study, analysis of pre-existing microarray data confirmed variable expression of the CDO1 gene in patients with complex karyotype liposarcomas. The findings were validated in a larger cohort of liposarcomas by quantitative RT-PCR and immunohistochemistry (IHC). The CDO1 expression level was analyzed relative to the histological subtype, location, and whether the tumor was primary or recurrent. Finally, promoter methylation and CDO1 expression were studied in a cohort of liposarcoma specimens and during differentiation of human mesenchymal stem cells (hMSCs) into mature adipocytes. Our results suggest that CDO1 is a marker of liposarcoma progression and adipogenic differentiation.
Methods
Patients and tissue samples
A total of 64 de-identified complex karyotype liposarcoma specimens were obtained from the MD Anderson Cancer Institute, Fox Chase Cancer Center, and the Cooperative Human Tissue Network (CHTN) under Institutional Review Board-approved protocols for banking of excess tissue from patients undergoing surgical resections or biopsy following informed consent. In all, 32 cases were WDLS, 20 cases were DDLS, and 12 cases were PLS. All tissue specimens were kept frozen at −80°C before RNA extraction or paraffin embedding. The pathology report for each case was examined for age, sex, tumor location (retroperitoneum, extremity), and presentation (primary, recurrent).
A WDLS/DDLS tissue microarray (TMA) was built consisting of a total of 572 paired WDLS/DDLS cores from 394 surgeries on 256 patients. Of the cores on the TMA, 157 are DDLS and 415 are WDLS. This TMA was constructed as previously described for PLS and myxoid/round cell liposarcoma arrays (PMID 21598240; PMID 22020193).
Cell lines and culture conditions
Three cell lines that represent different stages of adipogenesis were used: adipose-derived stem cells (ADSCs), human preadipocytes (HPAd), and human adipocytes (HAd). StemPro human ADSCs (Life Technologies) have the same phenotypic and functional characteristics as bone marrow-derived mesenchymal stem cells. ADSCs were maintained in MesenPRO RS basal medium plus Growth Supplement. HPAd were cultured in preadipocyte growth medium, whereas HAd were maintained in adipocyte differentiation medium according to the manufacturer’s instructions (Cell Application, Inc.).
Adipogenic differentiation was induced in Poietics bone marrow-derived hMSCs (Lonza) according to the manufacturer’s instructions. The PLS-derived cell line LS226 was maintained in RPMI plus GlutaMAX (Life Technologies), 1× MEM Essential Vitamin Mix (BioWhittaker), 1× ITES (BioWhittaker), 1× penicillin/streptomycin/L-glutamine (Life Technologies), 1 mM sodium pyruvate (CellGro), 1× nonessential amino acids (NEAA) (Lonza), and 20% fetal bovine serum (Life Technologies).
Measurement of triglyceride (TG) content
Following each cycle of induction, hMSCs that had been seeded in duplicate in a 24-well plate and cultured until confluence were rinsed with 1× phosphate buffered saline (PBS) and then incubated with 30 μL of AdipoRed (Lonza) in 1 mL of 1× PBS for 10 minutes. TG content was determined by AdipoRed fluorescence at 538 nm. Baseline/background was established by measuring fluorescence in the LS2 cell line, which was subtracted from the induced cells’ signal for each week.
Immunofluorescence of CDO1
Following each cycle of induction, hMSCs grown in duplicate in four-well chamber slides were stained for CDO1. Cells were washed with 1× PBS and fixed with freshly prepared 3.7% formaldehyde/1× PBS for 10 minutes before permeabilization with 10% NP40/1× PBS for 10 minutes. Following blocking of epitopes with PBG (0.2% w/v cold water fish gelatin (Sigma)/0.5% w/v bovine serum albumin (BSA) (Sigma)/1× PBS), cells were incubated with a 1:500 dilution of anti-CDO1 antibody (Sigma-Aldrich) overnight at 4°C. CDO1 was detected using a DyLight 549 conjugated donkey anti-rabbit secondary antibody at a 1:500 dilution (Jackson ImmunoResearch). Nuclei were counterstained with 4’,6-diamidino-2-phenylindole (DAPI; Sigma). Specimens were mounted with ProLong Gold antifade reagent (Life Technologies) and examined using a Nikon A1 scanning confocal microscope.
Quantitation of CDO1 mRNA expression
Total RNA from tumor specimens and cell lines was extracted using QIAzol (Qiagen) and TRIzol (Life Technologies), respectively. RNA was purified using the RNeasy kit (Qiagen) and quantified on a NanoDrop ND-1000 spectrophotometer. Expression was measured by at least one of two methods: quantitative real time-PCR (qRT-PCR) or gene expression array. For qRT-PCR, cDNA was made from 100 ng RNA using the High Capacity cDNA Reverse Transcriptase kit according to the manufacturer’s instructions (Life Technologies). CDO1 mRNA expression was quantified by qRT-PCR using TaqMan assay Hs00156447_m1. 18S rRNA (kit 4308329, Life Technologies) was used as the endogenous control. Expression levels relative to HAd were determined using the ΔΔCt method.
Histology and IHC
Tissue sections (5 μm) were cut from formalin fixed paraffin embedded (FFPE) blocks. A section for each specimen was stained with hematoxylin and eosin (H&E) to confirm the histological features. Unless stated otherwise, all incubations were done at room temperature. Sections were deparaffinized in xylene and hydrated in decreasing concentrations of ethanol. The tissue sections were then subjected to epitope retrieval by steaming in 10 mM sodium citrate buffer, pH 6.0. Endogenous peroxidase activity was blocked with 3% hydrogen peroxide in methanol. Blocking of non-specific sites was achieved by incubation with 5% bovine serum albumin for one hour. Specimens were then incubated overnight at 4°C with a 1:200 dilution of anti-CDO1 antibody (Sigma-Aldrich). The sections were incubated for one hour with a 1:1,000 dilution of biotinylated anti-rabbit IgG (Jackson ImmunoResearch) followed by a 30-minute incubation with a 1:1,000 dilution of HRP-conjugated streptavidin (Jackson ImmunoResearch). Immunocomplexes were visualized with 3,3-diaminobenzidine tetrahydrochloride (Covance, England). Incubations omitting the primary antibody were used as negative controls for each sample.
Quantitation of CDO1 IHC
Images from three to five fields of each CDO1 antibody-stained tumor specimen and of its matched control (no CDO1 antibody) were acquired using Nikon Eclipse E400 together with NIS Elements software. To minimize variation, identical exposure conditions were applied to each specimen and its corresponding control. The CDO1 signal intensity was calculated by NIS Elements for each field of a given tumor sample. The CDO1 expression level was calculated by subtracting the average intensity of all fields of the control slide from the average intensity of all fields of the CDO1-stained slide.
DNA extraction and analysis of promoter hypermethylation
Genomic DNA was extracted from tumors and from hMSCs before and after each adipogenic induction cycle using the DNeasy Blood and Tissue Kit (Qiagen) following the manufacturer’s protocol. The optional RNase A treatment was performed. The concentration and purity of DNA was determined by Nanodrop spectrophotometer. A total of 1 μg of genomic DNA was bisulfite-converted and purified using the EZ Methylation-Direct Kit (Zymo Research). In all, 9 ng of converted DNA was used as the template in a 25 μL methylation-specific quantitative PCR reaction.27 Briefly, the reaction contained 1×TaqMan® Universal Master Mix (Life Technologies), 0.2 μM fluorescent probe, and 1.2 pmol each primer (sequences in Supplementary Table 1 from Ref. 24). The thermal cycling protocol was as follows: 95°C (10 minutes) followed by 50 cycles of 95°C (15 seconds), 60°C (1 minute), and 72°C (15 seconds). Amplification of the unmethylated β-actin promoter was used as the reference gene (sequences in Supplementary Table 1). In vitro methylated DNA (Zymo Research) was used as a positive control for the reaction, whereas unmethylated DNA was used as a negative control. A standard curve using 10-fold serial dilutions of methylated or unmethylated template was generated to determine the efficiencies of the CDO1 and β-actin primer/probe efficiencies, respectively. Mixtures of methylated and unmethylated DNA (100% methylated, 50:50 methylated:unmethylated, and 100% unmethylated) were used to control PCR bias between methylated and unmethylated templates. A Ct of less than 35 was considered positive methylation.
Statistical analysis
Box plot figures were produced using an online tool (www.physics.csbsju.edu). The expression differences between two categories were assessed for significance using the two-sided Mann-Whitney U test, available at www.elegans.som.vcu.edu. Differences were considered statistically significant at P < 0.05.
Results
Patients and tumor characteristics
A total of 64 de-identified liposarcoma specimens were used to determine expression levels of CDO1 transcript (Table 1). Of these, 32 liposarcomas were WDLS, with an equal frequency of males and females. WDLS were resected from the retroperitoneal space and from the extremities (thigh, buttock, axilla, and upper limbs) with equal frequency. In all, 21 cases of WDLS presented as primary tumors whereas 11 cases were recurrent WDLS. Our cohort of patients contained 20 cases of DDLS, of which 11 cases were female and 9 cases were male. All of the DDLS were resected from the retroperitoneal space, 8 were primary whereas the remaining 12 cases were recurrent. The study included 12 cases of PLS, of which 9 cases were male and 3 cases were female. Resections from the extremities accounted for 9 cases of the 12 PLS tumors, while the remaining 3 tumors were resected from the retroperitoneal space. There were 10 primary PLS and 2 recurrent PLS. The median age at diagnosis was 66, 71, and 69 years for WDLS, DDLS, and PLS, respectively. Thus, this cohort is representative of liposarcomas in general. The WDLS and DDLPS represented on the TMA were primarily from deep retroperitoneal locations.
Table 1.
Characteristics of liposarcoma specimens.
| WDLS* N = 32 | DDLS† N = 20 | PLS‡ N = 12 | TOTAL N = 64 | ||
|---|---|---|---|---|---|
| Patient Gender | Male | 16 (50%) | 9 (45%) | 9 (75%) | 34 (53%) |
| Female | 16 (50%) | 11 (55 %) | 3 (25%) | 30 (47%) | |
| Site of the tumor | Extremities | 16 (50%) | 0 (0%) | 9 (75%) | 25 (39%) |
| Retroperitoneum | 16 (50%) | 20 (100%) | 3 (25%) | 39 (61%) | |
| Presentation | Primary | 21 (66%) | 8 (40%) | 10 (83%) | 39 (61%) |
| Recurrence | 11 (34%) | 12 (60%) | 2 (17%) | 25 (39%) | |
| Age (years old) | Range | 32 to 87 | 44 to 84 | 33 to 86 | |
| Median | 66 | 71 | 69 |
Abbreviations:
WDLS, well-differentiated liposarcoma
DDLS, dedifferentiated liposarcoma
PLS, pleomorphic liposarcoma.
CDO1 gene expression is higher in WDLS than in DDLS
CDO1 gene expression was examined in 30 liposarcoma specimens (12 cases of WDLS, 10 cases of DDLS, and 8 cases of PLS) and 3 cell lines from the adipogenic lineage using pre-existing gene expression microarray data.26 In WDLS, high CDO1 mRNA levels were observed (median = 1,757, range = 239–2847, Fig. 1A). The distribution of CDO1 gene expression in WDLS was asymmetrical and appeared biphasic (Supplementary Fig. 1A). CDO1 mRNA levels were lower in the DDLS specimens (median = 186, range = 21–897). The majority of PLS (7/8 tumors analyzed) were in the same range as DDLS, with one tumor exhibiting very high CDO1 gene expression (median = 495, range = 15–2677). CDO1 gene expression was significantly higher in WDLS than in either DDLS (P < 0.001) or PLS (P < 0.05). There was no statistical difference in the gene expression of CDO1 between the DDLS and PLS subtypes. Interestingly, microarray data also showed increased CDO1 mRNA in adipocytes compared to less differentiated cells in the adipogenic lineage (supplementary Fig. 1B).
Figure 1.
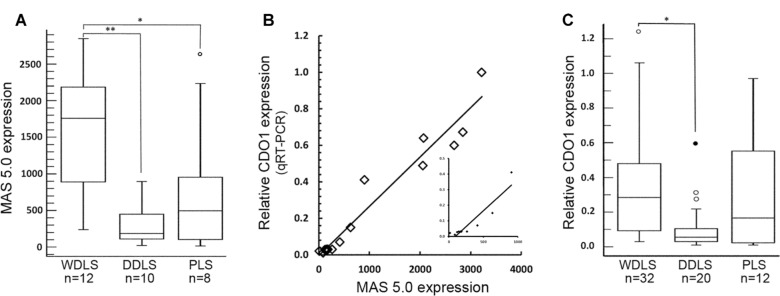
Expression level of CDO1 in complex karyotype liposarcomas. (A) CDO1 transcript level, measured by gene expression microarray, in 30 cases of complex karyotype liposarcomas. The boxes encompass the 25th and 75th percentile (interquartile range, IQR), with the median value shown as a horizontal line within the box. Whiskers represent the minimum and the maximum CDO1 expression values in each group. The empty circle represents a suspected outlier, 1.5 × IQR above the third quartile. In WDLS, CDO1 was significantly higher than in the DDLS (**P < 0.001) and the PLS (*P < 0.05). There was no significant difference in the expression of CDO1 between DDLS and PLS. (B) Correlation between CDO1 expression analyzed by microarray and by qRT-PCR. The data obtained by qRT-PCR analysis (y-axis) strongly correlated with those obtained by microarray (x-axis) from 12 liposarcomas and 3 cell lines (R = 0.97, P < 0.001). Insert is expansion of the data points within the range of 0–1000 MAS 5.0 expression (R = 0.93). (C) Relative CDO1 mRNA expression assessed in 64 complex karyotype liposarcomas. Box plots are as described in (A). The filled circle represents an outlier (more than 3 × IQR). The expression level of CDO1 was significantly higher in WDLS compared to that of DDLS (*P < 0.001). No significant difference in CDO1 level was observed between WDLS and PLS or between DDLS and PLS.
The number of samples assessed by gene expression arrays was limited. Therefore, we expanded our sample size to validate the expression differences observed in the first cohort. First, we determined the correlation between data obtained by gene expression microarray and qRT-PCR (Fig. 1B). CDO1 mRNA was quantified by qRT-PCR in 12 liposarcoma samples and 3 normal cell lines (ADSCs, HPAd, and HAd) that had been previously used in the microarray analysis. The results from qRT-PCR were plotted against the data obtained from the microarray. A high correlation between the two methods (R = 0.97, P < 0.001) was observed, and for this reason the qRT-PCR and gene expression array data were combined into a single data set for subsequent analysis.
CDO1 expression was measured by qRT-PCR for 50 specimens. Of these, 12 specimens had also been analyzed by microarray. An additional 14 specimens that had been analyzed by microarray lacked sufficient material for analysis by qRT-PCR; for these specimens, the correlation between microarray and qRT-PCR expression levels was used to estimate an equivalent qRT-PCR value. CDO1 gene expression in this combined data set of 64 specimens was similar to that observed in the smaller gene expression array data set (Fig. 1C). WDLS specimens had significantly higher CDO1 gene expression (n = 32, median = 0.29, range = 0.03–1.23) when compared to DDLS tumors (n = 20, median = 0.06, range = 0.01–0.60) (P < 0.001). In this larger sample set of WDLS, the biphasic distribution of CDO1 gene expression observed in the microarray data is lost (Supplementary Fig. 1C). In contrast, in the larger cohort of PLS (n = 12) analyzed by qRT-PCR, a pronounced biphasic distribution was observed (Supplementary Fig. 1C), with some tumors having very low CDO1 mRNA levels (n = 6, median = 0.02, range = 0.01–0.03) whereas others showing moderate to robust CDO1 mRNA levels (n = 6, median = 0.51, range = 0.30–0.97). Not surprisingly, given the variation in CDO1 gene expression among PLS samples (n = 12, median = 0.17, range = 0.01–0.97), there was no significant difference in CDO1 mRNA level between PLS and either WDLS or DDLS when assessed by qRT-PCR. This is likely a result of the large sample size in this cohort.
CDO1 expression is not affected by other clinicopathological features of liposarcoma
Liposarcoma recurrence is influenced by many factors such as the histologic subtype and the primary site of tumor. For example, liposarcoma in the retroperitoneum may have an increased risk of recurrence associated with a lack of a wide excision margin.28 We therefore analyzed whether tumor location was related to the differences observed in CDO1 gene expression. Because the DDLSs in our cohort were only located in the retroperitoneum, they were excluded from this analysis. Similarly, the number of PLS from the retroperitoneum (n = 3) was too small to be compared to the PLS from the extremities (n = 9). We observed no significant difference in CDO1 gene expression between primary WDLS (n = 13) in the extremities and primary WDLS (n = 8) in the retroperitoneum (data not shown). The number of recurrent WDLS from the extremities was too small (n = 3) to be analyzed for statistically significant differences than the recurrent WDLS (n = 8) from the retroperitoneum.
CDO1 gene expression showed wide variation within the WDLS tumors. To probe a potential source of this variation, the mRNA level of CDO1 was compared in primary and recurrent WDLS tumors. In general, recurrent WDLS had lower CDO1 mRNA levels than primary WDLS. However, the difference in CDO1 gene expression between primary WDLS (n = 21, median = 0.32, range = 0.03–1.23) and recurrent WDLS (n = 11, median = 0.23, range = 0.03–0.35) was not significant (Fig. 2A). For the DDLS subtype, there also was no significant difference in the gene expression of CDO1 between 8 cases of primary DDLS (median = 0.08, range = 0.01–0.60) and 12 cases of recurrent DDLS (median = 0.03, range = 0.01–0.31) (Fig. 2B). Our cohort contained only two recurrent PLS; therefore, we did not analyze this histologic subtype.
Figure 2.
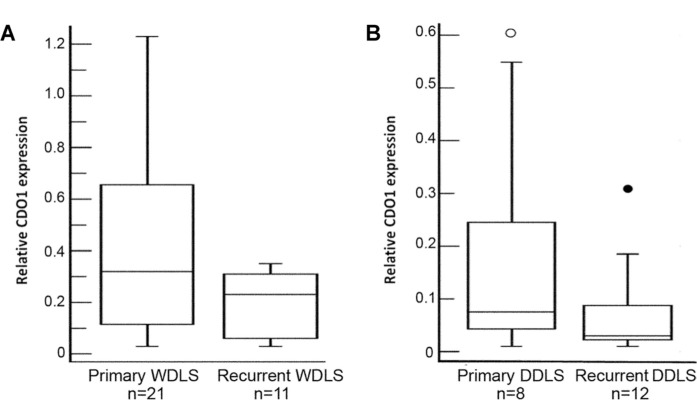
Expression level of CDO1 in primary and recurrent liposarcomas. (A) Expression of CDO1 mRNA in 21 primary and 11 recurrent WDLS specimens. Description of the box plots is found in Figure 1. There was no significant difference in CDO1 expression between the two groups. (B) The transcript level of CDO1 in 8 primary and 12 recurrent DDLS specimens. There was no significant difference in the expression of CDO1 mRNA between primary DDLS and recurrent DDLS.
We hypothesized that the lack of significance [because we note that the difference in expression was trending towards significance (P = 0.09)] observed between primary and recurrent WDLSs might be because of the limited sample size evaluated here. Alternatively, the primary WDLS with low CDO1 gene expression may be those with increased likelihood of recurring locally or transitioning to DDLS. To increase the number of samples analyzed, we turned to TMAs containing well-annotated clinical samples of liposarcoma.
CDO1 protein levels are consistent with mRNA levels
Before staining TMAs, we first needed to determine if CDO1 protein levels could be reliably assessed by IHC and, if so, whether protein levels correlate with previously determined transcript levels. A total of 26 samples for which CDO1 transcript levels had already been determined were available for IHC (14 WDLS, 8 DDLS, and 4 PLS) (Fig. 3A). CDO1 was localized at the cell membrane as well as in the cytoplasm of tumor cells. Assessment of CDO1 immunoreactivity was initially achieved by subjective evaluation of the signal intensity in the CDO1 antibody-stained slides. This assay remains the most widely accepted method of protein analysis in human tissues, and is still a semi-quantitative analysis and is subject to inter-observer differences. To achieve a more objective quantitation, we used NIS Elements software (Nikon) to measure background-corrected CDO1 staining intensity. Values of 10 or less were considered weak, staining intensity of 11–20 represented moderate expression, and a value of more than 20 indicated strong expression. Using these criteria, 8 (57%) of the 14 WDLS cases exhibited moderate to strong expression. For PLS, three (75%) of the four tumors had moderate to strong expression of CDO1. Conversely, six (75%) of the eight cases of DDLS expressed the CDO1 protein weakly, while the remaining two cases exhibited moderate expression of CDO1 (Table 2). To determine if a correlation existed between protein level and the CDO1 gene transcript level by qRT-PCR, the data obtained by IHC and qRT-PCR were plotted (Fig. 3B). This demonstrated a good correlation between the protein and transcript-level data, with a calculated Pearson correlation coefficient of 0.81 (P < 0.001).
Figure 3.

Immunohistochemical analysis for CDO1 protein in complex karyotype liposarcomas. (A) Representative histology and IHC in complex karyotype liposarcomas. H&E-stained sections are shown in the left column, IHCs for CDO1 are in the middle column, and negative controls (omission of primary antibody) are in the right column. Top row—case 8 is a primary WDLS with moderate expression of CDO1. Second row—case 11 is a recurrent WDLS with weak expression of CDO1. Third row—case 17 is a primary DDLS with weak expression of CDO1. Last row—case 25 is a primary PLS with strong expression of CDO1 (scale bar = 100 μm). (B) Correlation between CDO1 expression level measured by qRT-PCR (y-axis) and IHC (x-axis). The calculated Pearson correlation coefficient was 0.81 (P < 0.001). (C) Protein levels of CDO1 in WDLS (n = 136), in the well-differentiated component of DDLS (n = 26), and in the dedifferentiated component of DDLS (n = 108). Description of the box plots is found in Figure 1. CDO1 protein levels were significantly higher in WDLS and the well-differentiated component of DDLS compared to the dedifferentiated component of DDLS (*P < 0.001 and **P = 0.014, respectively).
Table 2.
Liposarcoma characteristics and CDO1 expression at the mRNA and protein levels.
| CASE | DIAGNOSIS* | PRESENTATION | qRT-PCR† | IHC‡ |
|---|---|---|---|---|
| 1 | WDLS | Primary | 0.06 | 8.3 |
| 2 | WDLS | Primary | 0.10 | 12.5 |
| 3 | WDLS | Primary | 0.13 | 7.4 |
| 4 | WDLS | Primary | 0.23 | 13.2 |
| 5 | WDLS | Primary | 0.32 | 9.5 |
| 6 | WDLS | Primary | 0.41 | 23.2 |
| 7 | WDLS | Primary | 0.45 | 26.4 |
| 8 | WDLS | Primary | 0.64 | 24.8 |
| 9 | WDLS | Primary | 0.67 | 13.1 |
| 10 | WDLS | Recurrence | 0.05 | 1.1 |
| 11 | WDLS | Recurrence | 0.10 | 4.8 |
| 12 | WDLS | Recurrence | 0.30 | 6.0 |
| 13 | WDLS | Recurrence | 0.33 | 16.5 |
| 14 | WDLS | Recurrence | 0.35 | 22.3 |
| 15 | DDLS | Primary | 0.01 | 2.9 |
| 16 | DDLS | Primary | 0.05 | 0.8 |
| 17 | DDLS | Primary | 0.07 | 4.0 |
| 18 | DDLS | Primary | 0.08 | 6.3 |
| 19 | DDLS | Primary | 0.27 | 9.4 |
| 20 | DDLS | Primary | 0.60 | 17.9 |
| 21 | DDLS | Recurrence | 0.07 | 4.3 |
| 22 | DDLS | Recurrence | 0.11 | 11.5 |
| 23 | PLS | Primary | 0.03 | 8.3 |
| 24 | PLS | Primary | 0.60 | 35.9 |
| 25 | PLS | Primary | 0.97 | 29.3 |
| 26 | PLS | Recurrence | 0.41 | 13.7 |
Abbreviations:
WDLS, well-differentiated liposarcoma; DDLS, dedifferentiated liposarcoma; PLS, pleomorphic liposarcoma
qRT-PCR, quantitative real time-PCR. Values are fold-expression in tumors relative to CDO1 expression in HAd
IHC, immunohistochemistry. Values are intensity of staining in arbitrary units quantified as described in Methods.
CDO1 protein levels were quantified in a larger cohort of tumors on TMAs using the approach described above. Only samples for which duplicate specimens were available were included for analysis. The calculated Pearson correlation coefficient between 329 duplicate specimens analyzed was 0.88, indicating the results were highly reproducible. Upon decoding of the TMAs, 221 WDLS and 108 DDLS were informative for CDO1 protein levels. CDO1 protein expression levels were significantly higher in WDLS (median = 19.1, range = 0–88) than in DDLS (median = 12.5, range = 0.6–53) (P < 0.001), confirming the results obtained with the smaller cohort of tumors.
The samples were stratified to compare CDO1 protein levels in tissue cores representing the well-differentiated component of a DDLS (n = 26) to that in WDLS (n = 136). CDO1 protein levels were significantly higher in the well-differentiated component of a DDLS than in the dedifferentiated component of DDLS (n = 107) (P = 0.014) (Fig. 3C). However, CDO1 expression was not significantly different among these two groups (Fig. 3C). This suggests that the well-differentiated component of a DDLS retains characteristics consistent with those of a WDLS. CDO1 protein levels neither predicted recurrence of WDLS or DDLS nor was correlated with time to recurrence for either histologic type.
Expression of CDO1 increases during adipogenic differentiation of hMSCs
The expression level of CDO1 appeared to be related to the lipogenic cell content of the tumor. Thus, DDLS lacks lipogenic cells and has the lowest CDO1 protein levels, whereas WDLS is largely composed of lipogenic cells and has the highest CDO1 protein levels. This suggested that CDO1 might be a marker of adipocytic differentiation.
The expression of CDO1 was determined during in vitro induced differentiation of hMSCs into mature HAd. The differentiation of hMSCs was examined by measuring the TG content following each induction cycle. As expected, TG content increased as hMSCs differentiated into mature adipocytes (Fig. 4A). By the fourth cycle, TG content indicated successful differentiation of the hMSCs. We then determined expression of CDO1 mRNA in the undifferentiated and in the induced cells by qRT-PCR analysis relative to mature HAd (Fig. 4B). CDO1 mRNA was not detected in the undifferentiated hMSCs. Expression of CDO1 increased marginally following the first 3 induction cycles, consistent with earlier results obtained using the ADSCs and HPAd cell lines (Supplementary Fig. 1B). However, following the fourth induction cycle, CDO1 mRNA was greatly increased. Similarly, as demonstrated by immunofluorescence, CDO1 protein was absent in undifferentiated hMSCs and early cycles of induction, with weak expression following the third cycle and prominent expression in the last stage of differentiation following the fourth cycle (Fig. 4C). These data are consistent with CDO1 expression being upregulated during late stages of adipose differentiation.
Figure 4.

CDO1 expression during adipogenic differentiation of hMSCs. (A) TG content increases during in vitro differentiation of hMSCs relative to LS2, a PLS cell line. (B) Quantitative RT-PCR analysis of CDO1 transcript level during adipogenic differentiation of hMSCs. CDO1 expression remains low until terminal differentiation. Values are relative to CDO1 expression in mature adipocytes. (C) Indirect immunofluorescence for CDO1 (shown in red). Nuclei were counterstained with DAPI (blue). CDO1 protein was increased at the later stages of induction, particularly following the fourth induction cycle (scale bar = 100 μm).
Hypermethylation of CDO1 promoter was not observed in complex karyotype liposarcomas
It is well established that epigenetic changes regulate gene expression. Indeed, CDO1 was identified as a potential target following an epigenetic reactivation screen. Therefore, we examined the methylation status of the CDO1 promoter by quantitative methylation-specific PCR. In this technique, DNA is modified by bisulfite treatment which causes conversion of unmethylated cytosines to thymidines, whereas methylated cytosines are not converted. The primers, designed to flank a promoter region with multiple CpG dinucleotides within a <150 bp segment, and the TaqMan probe for the gene of interest are designed to be complimentary to unconverted DNA and thus only methylated samples will result in an amplification product. The region of the CDO1 promoter interrogated was previously shown to be hypermethylated in various cancers.24,29 In all, 39 liposarcoma specimens (14 WDLSs, 15 DDLSs, and 10 PLSs) were tested. None of the specimens showed methylation in this region (Supplementary Fig. 2 and data not shown). Similarly, there was no change in the methylation status of the CDO1 promoter region before or after adipogenic induction of hMSCs (data not shown).
Discussion
In this study, data from microarray, qRT-PCR, and IHC revealed differences in CDO1 expression in a cohort of liposarcoma specimens. There was a strong correlation among results from all assays used to assess CDO1 levels. We found CDO1 expression was higher in WDLS than in DDLS. This difference in CDO1 expression was retained in the well-differentiated component of DDLS. However, CDO1 expression or protein levels were not associated with clinicopathological features assessed including time to recurrence or histology upon recurrence. Results from in vitro differentiation of hMSCs suggest that CDO1 is a marker of adipogenic differentiation.
WDLS is a locally aggressive tumor that does not have the potential to metastasize. Hence, it has a favorable prognosis compared to other liposarcoma subtypes. However, some WDLS transitions into DDLS.30 Evidence suggests that this phenomenon results from the accumulation of genetic aberrations that ultimately affect tumor behavior and prognosis.31,32 The primary phenotypic alteration is a transition from entirely lipogenic components in WDLS to the presence of non-lipogenic components in DDLS. Our data demonstrate that abundant CDO1 is a feature observed in WDLS tumors while low levels are found in the DDLS tumors. We hypothesize that adipogenic cells retain the ability to synthesize CDO1, whereas the non-lipogenic cells lack that ability.
PLSs are diagnosed histologically based on the presence of lipoblasts, progenitor cells for the adipogenic lineage. However, there is a wide variation in the number of lipoblasts among PLS tumors. In our cohort of PLS assessed by qRT-PCR, we observed a biphasic distribution of CDO1 mRNA levels in which some tumors had low CDO1 mRNA levels similar to that observed in WDLS whereas other tumors had high levels of CDO1 mRNA levels similar to that observed in DDLS. Because our data suggest that CDO1 is a marker of adipogenic differentiation, it is possible that CDO1 expression in PLS reflects the number of lipoblasts present in the tumor. Thus, in those tumors with few lipoblasts, CDO1 expression would be high, whereas in those tumors with greater numbers of lipoblasts CDO1 expression would be low. This biphasic distribution of CDO1 expression would confound the ability to define a distinction between PLS and other complex karyotype liposarcomas.
To our knowledge, there is no previous work that characterizes CDO1 expression during adipogenesis. The results presented here suggest that CDO1 is a marker of differentiation in the adipogenic lineage. Consistent with this, the highest level of CDO1 expression was observed in mature HAd, while the expression was much lower in less-differentiated cells in the lineage. Developmentally, HAd arise from mesenchymal stem cells that commit to the adipogenic lineage through orchestrated expression of functional genes and transcription factors. Our results showed that CDO1 is not detected during the determination phase from hMSCs to preadipocytes, while its level is upregulated following terminal differentiation of preadipocytes to mature adipocytes.
The role of CDO1 expression in liposarcomagenesis is unclear. CDO1 has been reported to be downregulated in recurrent Wilms’ tumor and cholangiocarcinoma.29,33 CDO1, among other genes, is also downregulated upon transition of mammary intraepithelial neoplasia into invasive ductal tumor.34 In a study by Brait et al,24 colon cancer cells exhibited silenced CDO1 expression because of hypermethylation of the gene promoter. That study also revealed that CDO1 acts as a tumor suppressor, in that colon cancer cells that do not express CDO1 have higher proliferative activities in vitro and in mouse xenograft models. Although identified in an epigenetic reactivation screen, no evidence of promoter hypermethylation was detected in any tumor tested or during adipogenic differentiation of hMSCs. Unlike most cancers studied, our results showed that differences in CDO1 expression in liposarcoma specimens were unrelated to hypermethylation of the promoter. CDO1 might be regulated via methylation in a region of the promoter other than the one tested here or indirectly via methylation changes at another site in the genome.
Surgical resection is the main modality for treatment of WDLS and is influenced by the anatomical site of the tumor. Wide excision margins are usually achievable when the WDLS arises in the extremities, while complete resection of WDLS from the retroperitoneum is often challenging because of anatomical constraints. In this case, WDLS is more likely to recur or to transition into DDLS, both of which can adversely affect prognosis and survival. Anthracycline, with or without ifosfamide, is an alternative line of treatment for unresectable WDLS/DDLS. However, the response rate to anthracycline was found to be as low as 11% in advanced WDLS/DDLS.35,36 In a recent study by Jeschke et al,37 breast cancer cells that do not express CDO1, because of hypermethylation of the CDO1 promoter, have resistance to anthracycline. However, the same study showed that introduction of full length CDO1 into those cancer cells resulted in improved sensitivity to anthracycline via a decreased capacity to detoxify reactive oxygen species. Thus, rescuing CDO1 expression may also lead to increased sensitivity of liposarcomas to chemotherapy.
Supplementary Data
Supplementary table 1. Sequences of primers used in quantitative methylation-specific PCR of CDO1.
Supplementary figure 1. Expression of CDO1 in complex karyotype liposarcomas and cell lines. (A) CDO1 transcript level, measured by gene expression microarray, in 30 cases of complex karyotype liposarcomas. Each triangular symbol represents a single specimen. (B) CDO1 mRNA level in ADSCs, HPAd, and HAd analyzed by qRT-PCR (empty column) and microarray (filled column). (C) Relative CDO1 mRNA expression in a combined set of 64 complex karyotype liposarcomas.
Supplementary figure 2. CDO1 promoter does not exhibit hypermethylation in complex karyotype liposarcomas and cell lines. Promoter hypermethylation was assessed using quantitative methylation-specific PCR as described in the Methods. (A) Amplification of a region of the β-actin promoter using methylated and unmethylated standard DNA as templates. (B) Amplification of a region of the CDO1 promoter using methylated and unmethylated standard DNA as templates. (C) Amplification of β-actin promoter and CDO1 promoter in a tumor. Amplification of β-actin indicates integrity of template DNA, whereas lack of amplification of CDO1 indicates absence of promoter hypermethylation.
Acknowledgment
We thank Dr. R. Vogel for statistical analysis.
Footnotes
Author Contributions
Conceived and designed the experiments: MS, KMP, DL, and DB. Analyzed the data: MS, KMP, MJP, MAL, DB, DK, DRI, and AJL. Wrote the first draft of the manuscript: MS and DB. Contributed to the writing of the manuscript: KMP, MJP, MvM, DL, and DK. Agreed with manuscript results and conclusions: MS, KMP, MJP, MAL, AJL, DRI, MvM, DL, DK, and DB. Jointly developed the structure and arguments for the paper: MS, KMP, MJP, MAL, AJL, DRI, MvM, DL, DK, and DB. Made critical revisions and approved the final version: KMP, MJP, and DK. All authors reviewed and approved the final manuscript.
ACADEMIC EDITOR: Barbara Guinn, Editor in Chief
FUNDING: This work was supported by Honjo International Scholarship Foundation (MS) and by The Landings Women Golf Association (DB and MAL).
COMPETING INTERESTS: Authors disclose no potential conflicts of interest.
DISCLOSURES AND ETHICS
As a requirement of publication the authors have provided signed confirmation of their compliance with ethical and legal obligations including but not limited to compliance with ICMJE authorship and competing interests guidelines, that the article is neither under consideration for publication nor published elsewhere, of their compliance with legal and ethical guidelines concerning human and animal research participants (if applicable), and that permission has been obtained for reproduction of any copyrighted material. This article was subject to blind, independent, expert peer review. The reviewers reported no competing interests.
REFERENCES
- 1.Mack TM. Sarcomas and other malignancies of soft tissue, retroperitoneum, peritoneum, pleura, heart, mediastinum, and spleen. Cancer. 1995;75(1 suppl):211–244. doi: 10.1002/1097-0142(19950101)75:1+<211::aid-cncr2820751309>3.0.co;2-x. [DOI] [PubMed] [Google Scholar]
- 2.Matushansky I, Hernando E, Socci ND, et al. Derivation of sarcomas from mesenchymal stem cells via inactivation of the Wnt pathway. J Clin Invest. 2007;117(11):3248–3257. doi: 10.1172/JCI31377. [DOI] [PMC free article] [PubMed] [Google Scholar]
- 3.Fritz B, Schubert F, Wrobel G, et al. Microarray-based copy number and expression profiling in dedifferentiated and pleomorphic liposarcoma. Cancer Res. 2002;62(11):2993–2998. [PubMed] [Google Scholar]
- 4.Singer S, Socci ND, Ambrosini G, et al. Gene expression profiling of liposarcoma identifies distinct biological types/subtypes and potential therapeutic targets in well-differentiated and dedifferentiated liposarcoma. Cancer Res. 2007;67(14):6626–6636. doi: 10.1158/0008-5472.CAN-07-0584. [DOI] [PubMed] [Google Scholar]
- 5.Gobble RM, Qin LX, Brill ER, et al. Expression profiling of liposarcoma yields a multigene predictor of patient outcome and identifies genes that contribute to liposarcomagenesis. Cancer Res. 2011;71(7):2697–2705. doi: 10.1158/0008-5472.CAN-10-3588. [DOI] [PMC free article] [PubMed] [Google Scholar]
- 6.Dalal KM, Antonescu CR, Singer S. Diagnosis and management of lipomatous tumors. J Surg Oncol. 2008;97(4):298–313. doi: 10.1002/jso.20975. [DOI] [PubMed] [Google Scholar]
- 7.Coindre JM, Pedeutour F, Aurias A. Well-differentiated and dedifferentiated liposarcomas. Virchows Arch. 2010;456(2):167–179. doi: 10.1007/s00428-009-0815-x. [DOI] [PubMed] [Google Scholar]
- 8.Pedeutour F, Forus A, Coindre JM, et al. Structure of the supernumerary ring and giant rod chromosomes in adipose tissue tumors. Genes Chromosomes Cancer. 1999;24(1):30–41. [PubMed] [Google Scholar]
- 9.Aman P, Ron D, Mandahl N, et al. Rearrangement of the transcription factor gene CHOP in myxoid liposarcomas with t(12;16)(q13;p11) Genes Chromosomes Cancer. 1992;5(4):278–285. doi: 10.1002/gcc.2870050403. [DOI] [PubMed] [Google Scholar]
- 10.Panagopoulos I, Mandahl N, Mitelman F, Aman P. Two distinct FUS breakpoint clusters in myxoid liposarcoma and acute myeloid leukemia with the translocations t(12;16) and t(16;21) Oncogene. 1995;11(6):1133–1137. [PubMed] [Google Scholar]
- 11.Hornick JL, Bosenberg MW, Mentzel T, McMenamin ME, Oliveira AM, Fletcher CD. Pleomorphic liposarcoma: clinicopathologic analysis of 57 cases. Am J Surg Pathol. 2004;28(10):1257–1267. doi: 10.1097/01.pas.0000135524.73447.4a. [DOI] [PubMed] [Google Scholar]
- 12.Jeremiah S, McCann KP, Williams AC, et al. Chromosomal localisation of genes coding for human and mouse liver cytosolic cysteine dioxygenase. Ann Hum Genet. 1996;60(pt 1):29–33. doi: 10.1111/j.1469-1809.1996.tb01169.x. [DOI] [PubMed] [Google Scholar]
- 13.Sörbo B Ewetz L. The enzymatic oxidation of cysteine to cysteinesulfinate in rat liver. Biochem Biophys Res Commun. 1965;18(3):359–363. doi: 10.1016/0006-291x(65)90714-x. [DOI] [PubMed] [Google Scholar]
- 14.Dominy JE, Jr, Hwang J, Stipanuk MH. Overexpression of cysteine dioxygenase reduces intracellular cysteine and glutathione pools in HepG2/C3A cells. Am J Physiol Endocrinol Metab. 2007;293(1):E62–E69. doi: 10.1152/ajpendo.00053.2007. [DOI] [PubMed] [Google Scholar]
- 15.Sturman JA. Taurine in development. Physiol Rev. 1993;73(1):119–147. doi: 10.1152/physrev.1993.73.1.119. [DOI] [PubMed] [Google Scholar]
- 16.Ide T, Kushiro M, Takahashi Y, Shinohara K, Cha S. mRNA expression of enzymes involved in taurine biosynthesis in rat adipose tissues. Metabolism. 2002;51(9):1191–1197. doi: 10.1053/meta.2002.34036. [DOI] [PubMed] [Google Scholar]
- 17.Tsuboyama N, Hosokawa Y, Totani M, et al. Structural organization and tissue-specific expression of the gene encoding rat cysteine dioxygenase. Gene. 1996;181:1–2. 161–165. doi: 10.1016/s0378-1119(96)00496-9. [DOI] [PubMed] [Google Scholar]
- 18.Ueki I, Stipanuk MH. 3T3-L1 adipocytes and rat adipose tissue have a high capacity for taurine synthesis by the cysteine dioxygenase/cysteinesulfinate decarboxylase and cysteamine dioxygenase pathways. J Nutr. 2009;139(2):207–214. doi: 10.3945/jn.108.099085. [DOI] [PMC free article] [PubMed] [Google Scholar]
- 19.Gregory W, James OW, Idle J, Waring R, Gordon C, Emery P. Carbocisteine polymorphism and disease. Lancet. 1992;339(8793):616–617. doi: 10.1016/0140-6736(92)90902-f. [DOI] [PubMed] [Google Scholar]
- 20.Gordon C, Emery P, Bradley H, Waring RH. Abnormal sulphur oxidation in systemic lupus erythematosus. Lancet. 1992;339(8784):25–26. doi: 10.1016/0140-6736(92)90144-r. [DOI] [PubMed] [Google Scholar]
- 21.Perry TL, Norman MG, Yong VW, et al. Hallervorden-Spatz disease: cysteine accumulation and cysteine dioxygenase deficiency in the globus pallidus. Ann Neurol. 1985;18(4):482–489. doi: 10.1002/ana.410180411. [DOI] [PubMed] [Google Scholar]
- 22.Ye S, Wu X, Wei L, et al. An insight into the mechanism of human cysteine dioxygenase. Key roles of the thioether-bonded tyrosine-cysteine cofactor. J Biol Chem. 2007;282(5):3391–3402. doi: 10.1074/jbc.M609337200. [DOI] [PubMed] [Google Scholar]
- 23.Booken N, Gratchev A, Utikal J, et al. Sezary syndrome is a unique cutaneous T-cell lymphoma as identified by an expanded gene signature including diagnostic marker molecules CDO1 and DNM3. Leukemia. 2007;22(2):393–399. doi: 10.1038/sj.leu.2405044. [DOI] [PubMed] [Google Scholar]
- 24.Brait M, Ling S, Nagpal JK, et al. Cysteine dioxygenase 1 is a tumor suppressor gene silenced by promoter methylation in multiple human cancers. PLoS One. 2012;7(9):e44951. doi: 10.1371/journal.pone.0044951. [DOI] [PMC free article] [PubMed] [Google Scholar]
- 25.Jeschke J, Van Neste L, Glöckner SC, et al. Biomarkers for detection and prognosis of breast cancer identified by a functional hypermethylome screen. Epigenetics. 2012;7(7):701–709. doi: 10.4161/epi.20445. [DOI] [PubMed] [Google Scholar]
- 26.Mitchell MA, Johnson JE, Pascarelli K, et al. Doxorubicin resistance in a novel in vitro model of human pleomorphic liposarcoma associated with alternative lengthening of telomeres. Mol Cancer Ther. 2010;9(3):682–692. doi: 10.1158/1535-7163.MCT-09-0705. [DOI] [PMC free article] [PubMed] [Google Scholar]
- 27.Ibragimova I, Cairns P. Assays for hypermethylation of the BRCA1 gene promoter in tumor cells to predict sensitivity to PARP-inhibitor therapy. In: Tulin AV, editor. Poly (ADP-Ribose) Polymerase: Methods and Protocols. Vol. 780. Springer Science + Business Media, LLC Clifton; NJ USA: 2011. pp. 277–291. [DOI] [PMC free article] [PubMed] [Google Scholar]
- 28.Singer S, Antonescu CR, Riedel E, Brennan MF. Histologic subtype and margin of resection predict pattern of recurrence and survival for retroperitoneal liposarcoma. Ann Surg. 2003;238(3):358–370. doi: 10.1097/01.sla.0000086542.11899.38. discussion 370–351. [DOI] [PMC free article] [PubMed] [Google Scholar]
- 29.Andresen K, Boberg KM, Vedeld HM, et al. Novel target genes and a valid biomarker panel identified for cholangiocarcinoma. Epigenetics. 2012;7(11):1249–1257. doi: 10.4161/epi.22191. [DOI] [PMC free article] [PubMed] [Google Scholar]
- 30.Mussi C, Collini P, Miceli R, et al. The prognostic impact of dedifferentiation in retroperitoneal liposarcoma. Cancer. 2008;113(7):1657–1665. doi: 10.1002/cncr.23774. [DOI] [PubMed] [Google Scholar]
- 31.Schneider-Stock R, Boltze C, Jaeger V, et al. Significance of loss of heterozygosity of the RB1 gene during tumour progression in well-differentiated liposarcomas. J Pathol. 2002;197(5):654–660. doi: 10.1002/path.1145. [DOI] [PubMed] [Google Scholar]
- 32.Barretina J, Taylor BS, Banerji S, et al. Subtype-specific genomic alterations define new targets for soft-tissue sarcoma therapy. Nat Genet. 2010;42(8):715–721. doi: 10.1038/ng.619. [DOI] [PMC free article] [PubMed] [Google Scholar]
- 33.Maschietto M, Piccoli FS, Costa CM, et al. Gene expression analysis of blastemal component reveals genes associated with relapse mechanism in Wilms tumour. Eur J Cancer. 2011;47(18):2715–2722. doi: 10.1016/j.ejca.2011.05.024. [DOI] [PubMed] [Google Scholar]
- 34.Namba R, Maglione JE, Young LJ, et al. Molecular characterization of the transition to malignancy in a genetically engineered mouse-based model of ductal carcinoma in situ. Mol Cancer Res. 2004;2(8):453–463. [PubMed] [Google Scholar]
- 35.Jones RL, Fisher C, Al-Muderis O, Judson IR. Differential sensitivity of liposarcoma subtypes to chemotherapy. Eur J Cancer. 2005;41(18):2853–2860. doi: 10.1016/j.ejca.2005.07.023. [DOI] [PubMed] [Google Scholar]
- 36.Italiano A, Toulmonde M, Cioffi A, et al. Advanced well-differentiated/dedifferentiated liposarcomas: role of chemotherapy and survival. Ann Oncol. 2011;29:2011. doi: 10.1093/annonc/mdr485. [DOI] [PubMed] [Google Scholar]
- 37.Jeschke J, O’Hagan HM, Zhang W, et al. Frequent inactivation of cysteine dioxygenase type 1 contributes to survival of breast cancer cells and resistance to anthracyclines. Clin Cancer Res. 2013;29(12):3201–3211. doi: 10.1158/1078-0432.CCR-12-3751. [DOI] [PMC free article] [PubMed] [Google Scholar]
Associated Data
This section collects any data citations, data availability statements, or supplementary materials included in this article.
Supplementary Materials
Supplementary table 1. Sequences of primers used in quantitative methylation-specific PCR of CDO1.
Supplementary figure 1. Expression of CDO1 in complex karyotype liposarcomas and cell lines. (A) CDO1 transcript level, measured by gene expression microarray, in 30 cases of complex karyotype liposarcomas. Each triangular symbol represents a single specimen. (B) CDO1 mRNA level in ADSCs, HPAd, and HAd analyzed by qRT-PCR (empty column) and microarray (filled column). (C) Relative CDO1 mRNA expression in a combined set of 64 complex karyotype liposarcomas.
Supplementary figure 2. CDO1 promoter does not exhibit hypermethylation in complex karyotype liposarcomas and cell lines. Promoter hypermethylation was assessed using quantitative methylation-specific PCR as described in the Methods. (A) Amplification of a region of the β-actin promoter using methylated and unmethylated standard DNA as templates. (B) Amplification of a region of the CDO1 promoter using methylated and unmethylated standard DNA as templates. (C) Amplification of β-actin promoter and CDO1 promoter in a tumor. Amplification of β-actin indicates integrity of template DNA, whereas lack of amplification of CDO1 indicates absence of promoter hypermethylation.