Abstract
The string method is a molecular-simulation technique that aims to calculate the minimum free-energy path of a chemical reaction or conformational transition, in the space of a pre-defined set of reaction coordinates that is typically highly dimensional. Any descriptor may be used as a reaction coordinate, but arguably the Cartesian coordinates of the atoms involved are the most unprejudiced and intuitive choice. Cartesian coordinates, however, present a non-trivial problem, in that they are not invariant to rigid-body molecular rotations and translations, which ideally ought to be unrestricted in the simulations. To overcome this difficulty, we reformulate the framework of the string method to integrate an on-the-fly structural-alignment algorithm. This approach, referred to as SOMA (String method with Optimal Molecular Alignment), enables the use of Cartesian reaction coordinates in freely tumbling molecular systems. In addition, this scheme permits the dissection of the free-energy change along the most probable path into individual atomic contributions, thus revealing the dominant mechanism of the simulated process. This detailed analysis also provides a physically-meaningful criterion to coarse-grain the representation of the path. To demonstrate the accuracy of the method we analyze the isomerization of the alanine dipeptide in vacuum and the chair-to-inverted-chair transition of β-D mannose in explicit water. Notwithstanding the simplicity of these systems, the SOMA approach reveals novel insights into the atomic mechanism of these isomerizations. In both cases, we find that the dynamics and the energetics of these processes are controlled by interactions involving only a handful of atoms in each molecule. Consistent with this result, we show that a coarse-grained SOMA calculation defined in terms of these subsets of atoms yields nearidentical minimum free-energy paths and committor distributions to those obtained via a highly-dimensional string.
1 INTRODUCTION
Free-energy calculations based on atomistic and coarse-grained molecular simulations play an increasingly important role in biochemistry and biophysics. These methods provide a quantitative framework to interpret experimental studies of chemical reactions and conformational transitions, in terms of populations of states and probabilities of interconversion between these states. Moreover, the microscopic detail that underlies the calculations provides a means to formulate novel mechanistic hypotheses, grounded in molecular thermodynamics.
Many conformational or chemical reactions of interest are rare events in molecular timescales, due to significant free-energy barriers separating metastable states. These barriers are infrequently crossed, or not at all, in conventional molecular dynamics (MD) or Monte Carlo simulations. Thus, these approaches are often insufficient to derive a thermodynamic characterization of many interesting problems.
To address this challenge, a number of so-called enhanced-sampling methods have been developed over the years. Most of these rely on the notion that only a subset of degrees of freedom is necessary to represent the different states of a molecular system. Biasing forces or energy terms are added to the standard energy function to ensure exhaustive sampling of these degrees of freedom, which are often combined in so-called collective variables. Provided that the biasing scheme is such that the simulations remain close to equilibrium, free-energy estimates can be rigorously derived a posteriori, from analysis of either the bias accumulated throughout the simulation, or the resulting probability distributions. Far-from-equilibrium methods may also be used, but the derivation of equilibrium probabilities is unfeasible in practice in many cases of interest.
Examples of enhanced-sampling methods based on the concept of conformational collective variables are umbrella sampling,1,2 adaptive umbrella sampling,3 adaptive biasing force,4 metadynamics5 and Hamiltonian replica-exchange.6,7 These techniques primarily differ on whether the bias is time-dependent or not, and on the extent to which the bias is pre-determined or adaptive. Although these methods have been very successful in a wide range of chemical and biological applications, a common limitation is that they usually require that a relatively small set of collective variables is used to define the free-energy space. In most practical applications these are a few collective variables of atomic degrees of freedom e.g. center-of-mass distances, torsions, coordination numbers, etc. However, many interesting processes, especially in the area of structural biophysics, are inherently cooperative and highly multidimensional, and yet restricted to a limited region of conformational space. For example, a conformational transition in a protein may concurrently involve the re-configuration of complex side-chain interaction networks, changes in hydration, local re-folding of the backbone, etc. Thus, there is a growing need for novel enhanced-sampling methodologies that can tackle highly dimensional problems while preserving the quantitative value of the traditional approaches.
Recent developments have addressed this need in alternative ways. On one side, methods such as metadynamics have been reformulated in terms of so-called path-collective variables,8 i.e. descriptors that represent the evolution of a molecular system along a path in multidimensional space, using a low-dimensional projection. Alternatively, chain-of-states methods are based on a framework in which the path is represented by a series of replicas of the molecular system, referred to as images, each of which reflects different values of the collective variables in the range defined by two end-points. In both approaches the ultimate aim is to identify and characterize the optimal reaction path, in an adaptive fashion.
A well-known representative of the chain-of-states approach is the string method in collective variables.9 This method is an adaptation of the zero-temperature string method,10 originally designed to identify minimum potential-energy paths; the reformulated version instead identifies minimum free-energy paths in the space of the collective variables. In this approach, stochastic or molecular dynamics simulations are used to evolve each of the images in the string, according to an estimate of the mean force exerted on the collective variables, computed locally at each image. An intermediate correction, referred to as reparametrization, ensures that the images remain equally distributed along the string throughout the optimization. By construction, therefore, the string of images eventually converges to the nearest minimum free-energy path. (A variant of this method, named finite-temperature string method,11 introduces additional stochastic forces in the propagation of the images, and therefore results in an ensemble of paths in the near vicinity of the minimum free-energy path.) An important advantage of the method is that it is based on local estimates of the mean force, and therefore permits the use of many collective variables. In addition, once the minimum free-energy path has been found, the associated one-dimensional free-energy profile can be retrieved by integration of the mean forces computed at every image. Recent developments related to the string method in collective variables include the on-the-path random walk sampling,12 its extensions,13 and the path-metadynamics technique of Díaz Leines and Ensing.14
Although the string method has clear advantages in highly dimensional problems the specific choice of collective variables is as critical as for other approaches as this will influence its optimization as well as the mechanistic interpretation derived from the results. The most primitive and unprejudiced set of variables one may consider is of course the Cartesian coordinates of the subset of atoms involved in the chemical reaction or conformational transition. However, despite being simple to use and easy to interpret, Cartesian coordinates present non-trivial problems, since they are not invariant by rigid-body rotations and translation of the molecule of interest. Ideally, both of these ought to be unrestricted in the simulations, as otherwise the calculated free energies might include artifactual contributions, as previously noted by Ovchinnikov et al.15
Here, we introduce a variant of the string method that enables us to use atomic Cartesian coordinates as variables in a molecular system that is freely tumbling. More precisely, we introduce an on-the-fly structural alignment algorithm in the computation of the mean forces that drive the evolution of the string, as well as in the integral used to derive the free-energy profile of the reaction and in the reparametrization step. This formulation, which we refer to as SOMA (String method with Optimal Molecular Alignment), also permits the dissection the free-energy profile into individual atomic contributions, using a decomposition-scheme analogous to others previously reported.16,17
The article is organized as follows: we first define the collective-variable space and discuss the framework that enables us to introduce roto-translational operations; then, we review the string method and introduce the particulars of SOMA from an operational perspective. Subsequently we demonstrate the quantitative performance of the method for the prototypical test case, namely the isomerization of the alanine dipeptide. A total of 39 Cartesian coordinates are included in the calculation. Global and atomic free-energy profiles along the minimum free-energy path are presented, along with committor distributions. Of particular note is the finding that only a handful of atoms contributes to the work required for isomerizing the molecule. Interestingly, none of these are in the backbone of the dipeptide; the isomerization mechanism is instead primarily driven by the interplay between oxygen and hydrogen atoms in the carbonyl and amide dipoles. Consistent with this observation, we find that a SOMA calculation using this minimal set of relevant atoms results in a near-identical minimum free-energy path and very similar free-energy components and transition state. Lastly, to demonstrate the applicability of SOMA to more complex systems, we study the chair-to-inverted-chair isomerization of β-D mannose in explicit water. As for the dipeptide, the results provide detailed insights into the atomic mechanism of isomerization, which again is controlled by interactions among a handful of atoms in the molecule. Accordingly, we show that, also for this more intricate transition, the process can be readily coarse-grained without a significant loss of accuracy.
2 Methods
2.1 Definition of collective variables and free energy
Let us indicate with X ∈ ℝ3N the Cartesian coordinates of the physical system and denote with x ∈ ℝ3n the coordinates of a part of it. Additionally, we denote the remainder of the system by y ∈ ℝ3m so that N = n + m. Let us also define a function R : ℝ3n → ℝ3n that resets the center of mass of x onto the origin and a rotation matrix U(x → r): ℝ3n → ℝ3n that optimally superimposes x on some reference structure r through some specific algorithm, in this specific case Kearsley’s.18 The subset of Cartesian coordinates x transformed by R and U, i.e.:
| (1) |
are the collective variables employed in SOMA. Note that xr are roto-translationally invariant by definition. For a set of arbitrary values zr defined in this space, which can always be retrieved for any set of z through:
| (2) |
the following free energy will be calculated in SOMA:
| (3) |
where we expressed the integral over dX as a product of two partitions of the system dx dy. Similarly, the potential energy was defined as function of both sets, V (X) = V (x, y). Note that the set of collective variables chosen partitions the space so that, for a given set zr, all conformations of x that are identical to zr upon roto-translation operation, are included. Therefore Eq. 3 fulfills the normalization condition:
| (4) |
| (5) |
where Ω ⊂ ℝ3n−6 while the rotation matrix U and translation operator R are defined each in a 3-dimensional space. The operation of Uzr + R indeed generates all the possible values of x.
A change of the universal reference system through a rotation operation U′ affects both the definition of the collective variables, since zr′ = U′zr, and the rotation algorithm used on x. The free energy becomes:
| (6) |
| (7) |
| (8) |
| (9) |
where we applied a change of integration variables, since det(U′) = 1. Therefore the free energy is invariant upon change in the universal reference frame whenever these two are connected trough a simple rotation operation. Equivalently it can be stated that G(zr) is the free energy of the ensemble that contains all the possible roto-translations of the substructure zr.
A simple relation also connects the mean forces in two different reference systems; more precisely:
| (10) |
| (11) |
| (12) |
where we used Eq. 9 and the fact that (U′)−1 = (U′)T. From Eq. 12 it can be deduced that mean forces calculated using a given reference frame r are equivalent to those using another reference frame r′, except for a rotation identical to that transforming r into r′.
2.2 Free-energy and mean-force calculations via restrained dynamics
Calculation of free-energy differences often involves computing mean forces. Mean forces may be calculated by imposing either holonomic constraints19,20 or harmonic restraints on each of the collective variables. It is also possible to adopt a single restraint/constraint on a function of collective variables. We first rewrite the free energy defined in Eq. 3 in terms of the explicit product of 3n delta functions:
| (13) |
The free energy as function of a distance from the 3n coordinates of the collective variables is closely related. This free energy is:
| (14) |
Note that if the distance d′ = 0, the integral in Eq. 14 samples exactly the same points in phase space that satisfy the product of delta functions in Eq. 13. The free energies defined in Eq. 13 and 14 are related as follows:
| (15) |
| (16) |
| (17) |
| (18) |
where in passing from Eq. 16 to Eq. 17 we used the simple layer integral formula. Since in the last equation the term |∇dzr (x)| is computed only for a set of conformations that are rotations of the same structure zr, i.e. when d′ = 0, the gradients obtained will be again rotation of the same vector, whose modulus is constant. Therefore this term can be removed from the integral resulting in:
| (19) |
where C(zr) is in principle dependent on the reference conformation, since different conformations zr could lead to a different value of |∇dzr(x)|. However if we assume C(zr) to be constant, Eq. 19 becomes:
| (20) |
which states that the two free energies are identical but for a negligible additive geometric factor. The validity of this approximation will be verified later in the numerical examples (see Sec. 3.1.1). Note that Gzr(d′) is a function of zr; therefore one can use partial derivatives to obtain the mean force with respect to each component of zr.
In the string method, the calculation of mean forces is key, since these guide the optimization. The mean force is defined as minus the derivative of G(zr)
| (21) |
In principle this relation implies the use of a conditional probability that can be calculated via a constrained average,20 i.e. an average computed along a trajectory where the condition required by the δ function is satisfied using holonomic constraints. As shown in Maragliano et al.,9 however an estimate of the mean force can also be obtained using a restrained simulation, i.e. a trajectory where the holonomic constraint is replaced by a stiff potential. This amounts to replacing the δ function in Eq. 21 with an exponential, hence approximating the free-energy landscape. As noted previously, this procedure smoothes out the small-scale ruggedness of the free-energy landscape, to an extent governed by the curvature of the stiff potential. A discussion of the advantages and limitations of this approach can be found in Maragliano et al.9 The most commonly adopted restraint potential is a harmonic function, i.e. k[dzr(x)]2/2. It is worth noting that in practice the value of dzr (x) = 0 is never sampled during the restrained simulations. Therefore it is important to set the force constant k to a value as large as possible, but without interfering with the integration of the equations of motion.9 Proceeding similarly to Maragliano et al.,9 the expression for the mean force in our case reads:
| (22) |
| (23) |
| (24) |
Note that the quantity in brackets in Eq. 24 is calculated on the biased ensemble where the total potential energy is:
| (25) |
Also note that the force resulting from such restraint is completely equivalent to that obtained by performing the optimal alignment in a reversed way, i.e. by dynamically rotating the fixed values zr onto each x sampled by the restrained simulation. This due to the rotational invariance of the distance:
| (26) |
| (27) |
| (28) |
| (29) |
| (30) |
| (31) |
| (32) |
As discussed below, in SOMA, we adopt the latter distance, dxx(zr), for numerical convenience, but it should be stressed that such choice is completely arbitrary.
An additional point that will be useful later is the fact that the restrained mean force requires to calculate
| (33) |
Note that this expression contains no rotation matrix derivative. It is also worth noting that this optimal-alignment restraint allows the molecule to tumble unrestrictedly in the simulation box and produces a mean force which is in the reference frame r.
2.3 String method in collective variables: general flowchart
The string method is a computational technique in which a path connecting two end-points of a molecular system is represented as a parametric function in a multidimensional space; in practice, this is a series of P intermediate conformations, referred to as images. This representation relies on a set of descriptors or collective variables (e.g. dihedral angles, coordination numbers, distances, etc.), which are specified a priori. The implicit assumption is that these descriptors provide a good approximation of the so-called committor function, i.e. the function that describes the probability that a trajectory started at any point in space reaches one end-state before the other. Given an initial guess for the path, the method finds the closest minimum free-energy path through an iterative procedure, outlined in Fig. 1. First, all images in the string are evolved according to an estimate of the local mean force in the space of the collective variables, computed individually for each image. This mean force may be computed for example via restrained simulations (Fig. 1B); to account for possible non-linear effects of the descriptors with respect to the Cartesian coordinates of the molecular system each of the mean-force components is re-scaled by a metric factor. Both mean-force vectors and metric factors are defined as conditional averages. In addition, the mean-force vectors may be projected onto the direction orthogonal to the path (Fig. 1C), although this projection is not strictly required.21 To update the string, the position of each image in collective-variable space is displaced along the projected mean-force vector, by a finite step. Because the images evolve downhill in free-energy space, they tend to cluster in free-energy minima; to avoid this, a reparametrization scheme is introduced so as to keep the images equally distributed along the string (Fig. 1D). The resulting set of images are then used as reference conformations for a new series of mean-force calculations. This process is iterated until convergence, i.e. until the images cease to drift and the length of the string reaches a value that is approximately constant. The one-dimensional free-energy profile along the string may be computed after every iteration via integration of the mean force along the path. Evidently large variations can be expected initially, but as the string converges so will the free-energy profile, ultimately reaching the minimum free-energy path.
Figure 1. General flowchart of the calculation of the minimum free-energy path with the string method.
(A) An initial set images is obtained, for example via targeted MD simulation. (B) A number of simulations with restraints centered on the images (orange circles) are performed. (C) The mean force and the metric factor are calculated at each image, and the free-energy profile along the string is calculated by integration; the component of the mean force orthogonal to the path may also be retrieved via a suitable projection. (D) The images are evolved according to the projected mean force, and the string is reparametrized to maintain the images equally spaced. The entire procedure is then repeated starting from (B), until convergence.
2.4 String method with optimal molecular alignment (SOMA)
In this section, we recast the formalism of the string method in collective variables, previously described in Maragliano et al.,9 so to adapt it to the space of roto-translational invariant Cartesian coordinates introduced in Sec. 2.1.
Following the notation of Maragliano et al.,9 the 3n collective variables space of roto-translational invariant Cartesian coordinates of a subset x of the system can be denoted as
| (34) |
where r superscript denotes the fact that the coordinates are aligned to the universal reference frame r after removal of the center of mass according to Eq. 1.
Another important element is the specific values of the collective coordinates that are used as a reference in the restrained dynamics. These represent the position of the string of images at a given iteration. These values are a function of the progress along the path λ
| (35) |
where r specifies the universal reference frame. In practice λ is an integer number since the string is discretized so that λ = 1, … , P.
The free energy computed along the string, up to an image denoted by the index q, can be obtained using the trapezoidal rule:
| (36) |
| (37) |
Here we adopt a computationally more convenient integration scheme instead. Since the free energy is a state function, the free-energy difference between two points in collective variable space must not change by using a different integration path. Therefore, we can equivalently split the path connecting two images into:
| (38) |
where zλi(λi+1) is the image λi+1 optimally aligned onto image λi while zλi(λi) is an image that is aligned onto itself, i.e. not aligned. The free-energy difference along the string would therefore read:
| (39) |
| (40) |
where in passing from Eq. 39 to Eq. 40 we used the fact that, according to Eq. 9, two identical structures with different reference frame have identical free energy. By calculating the remaining terms with the trapezoidal rule we are left with:
| (41) |
which no longer depends on the reference frame r. This is in agreement with the expectation that the free energy should not depend on the reference frame, as shown Eq. 9. Interestingly, in this scheme, the small stepwise increments guarantee that artifactual contribution from rotations are minimized, which is one of the primary goals of SOMA. Importantly, these difference vectors will be used later for projectors and reparametrization.
Note that in practice the term is simply calculated through restrained dynamics using the image z(λi) instead of both r and z in Eq. 24. This self-fitting scheme requires some further discussion since Eq. 12 would now read for a generic frame λ:
| (42) |
that ultimately requires calculating:
| (43) |
Here one should not be mislead by the dependence of U(x → λ) on zλ. As in Eq. 33 rotation matrix derivatives should be neglected. Deriving respect to this amounts to introducing an artifactual free energy contribution due to a change in the definition of the collective variables.
The second mean force in Eq. 41, would in principle imply performing a restrained simulation in which the reference frame zλi(λi) and the center of the harmonic restraint zλi(λi+1) differ. This would double the number of calculations required. Once again this is circumvented by using Eq. 12
| (44) |
according to which the mean force calculated in a reference frame z(λi+1) can be easily translated into z(λi), by applying the corresponding optimal rotation matrix.
We want to stress again the fact that the restrained dynamics is performed here via a harmonic potential on the mean-square-deviation as explained in Sec. 2.2. The computational convenience of this choice is that, since in each mean-force calculation the image uses itself both as reference frame and restraint center, the forces from optimal alignment have a smaller variance thus producing a stabler dynamics.
2.4.1 Mean force calculation on the string
At the core of the string method is the steepest-descent evolution of the z(λ) images, which progressively moves them towards the minimum free-energy path.
Adapting the notation from Maragliano et al.9 the evolution of each image in fictitious time is achieved by
| (45) |
| (46) |
In Eq. 45, Δt is the fictitious time step, is the mean force calculated at the image zλ(λ), P(zλ(λ)) is a projector of the mean force in the direction perpendicular to the string (green vs. purple arrows in Fig. 1C) and M(zλ(λ)) is the metric factor. Importantly, the steepest-descent evolution does not guarantee that the center of mass is removed. After the evolution the center of mass can always be removed by applying the transformation R in Eq. 2.
The first ingredient of this relation is the mean force which is calculated by using the coordinates of the image λ itself as universal reference system as discussed in Sec. 2.4
The second ingredient is the metric factor in Eq. 45, M(zλ(λ)) which is defined as:
| (47) |
Since the collective variables are defined as center-of-mass zeroed and reference-frame rotated, each derivative reads as
| (48) |
| (49) |
The third ingredient in Eq. 45 is the projector matrix P(zλ(λ)) which is required to extract the component of the mean force orthogonal to the string. The calculation of this matrix requires the definition of a discrete approximation of a unitary vector tangent to the string. Here, consistent with the discussion in Sec 2.4, we calculate this difference vector by optimally aligning λ′ onto λ. Therefore the tangent vector reads:
| (50) |
where λ′ is the index denoting an image that is adjacent to λ, zλ(λ′) is obtained through optimal alignment of zλ′(λ′) onto zλ(λ), and the distance is defined as
| (51) |
where the matrix may be used to convert the collective-variable displacement to Cartesian units so that ultimately collective variables of different nature can be conveniently used at the same.
The projector, defined as the matrix that projects out the parallel part of a vector with respect to the tangent unit-length vector can therefore be deduced from:
| (52) |
which reads, for each component
| (53) |
| (54) |
| (55) |
| (56) |
where we conveniently contracted the double subscripts of the matrix running on the atoms and components, into a single index and observed that the matrix is diagonal. The above relation defines the projector.
Since the string is discretized in P images over a range 1 < λ < P, the index λ′ is chosen according to:22
| (57) |
Once this projector and the mean forces are calculated, each single image can be evolved according to Eq. 45.
2.4.2 Evolution of the images
The discrete time evolution of Eq. 45 requires, from a practical standpoint, the choice of the fictitious time Δt. Because we are using Cartesian space, it is convenient to limit the displacement of each component to a given value. When the mean force is large this choice precludes steps that are too large; close to convergence, when the mean forces are small, it allows continued progress in the optimization.
We implement this by simply taking
| (58) |
which is a rather general equation valid also for the case of mixed collective variables. In this framework every change in collective variables is translated in a change in Cartesian coordinates through the M(zλ(λ)) matrix. Therefore, the only parameter to be chosen is Δx, i.e.. the allowed step in Cartesian space.
2.4.3 Reparametrization
By construction, the steepest-descent evolution of the images results in a drift towards the end-point metastable states, leaving the transition state unpopulated. To counter this drift, the images’ reference values are corrected at each iteration so that the distance between adjacent images along the string remains approximately constant; this operation is referred to as reparametrization.9,10,22 Here, this reparametrization step requires further elaboration, in account of the fact that the reference frames of adjacent images differ. Adapting the formalism of Maragliano et al.,9 we first calculate the vector of the cumulative distances of the evolved images zλm(λm)*:
| (59) |
where, consistent with Sec. 2.4, the images are optimally superimposed in a pairwise manner before calculating the image-to-image distance. The cumulative length of the vectors that would ideally correspond to a set of equal distances among the images is then s(m) = (m − 1)L(M)/(M − 1). The reparametrized images zλm(λm)** are obtained by displacing these along the difference vector, after optimal superposition:
| (60) |
where k is chosen so that L(k−1) < s(m) < L(k). Subsequently, the center of mass can be easily removed from zλm(λm)**. Note that all distances are calculated using Eq. 51.
2.4.4 Free-energy decomposition
The use of Cartesian coordinates allows for an intuitive decomposition of the total free energy into individual contributions from the different variables used to define the space of the string. This procedure is analogous to that used by Miller et al.,16 subsequently discussed by Haas and Chu.17 It is achieved simply by splitting Eq. 41 on a per-variable basis, which in our case yields a decomposition of the free energy into single-atom contributions:
| (61) |
It should be stressed that the atomic contributions are indeed collective, in the sense that they contain the response of the whole system locally projected on specific atoms. In this sense they may be influenced significantly by the surrounding atoms not included in the string.
2.4.5 Implementation
SOMA is implemented in the PLUMED plug-in,23 and therefore may be used in combination with a number of molecular dynamics (MD) engines, such as NAMD,24 GROMACS,25 or AMBER.26 Currently, SOMA calculations use a Python wrapper script that prepares the simulation inputs for each image; calls the MD/PLUMED engine to carry out the simulations (including the optimal-alignment procedure); extracts and projects the mean force at each image, and updates the string; and calls a standalone version of PLUMED for reparametrization, alignment and distance calculations, so as to ensure the maximum consistency and minimize code redundancy. In addition, the Python script is designed to keep track of each of the simulations of the images, which may be executed as serial or parallel jobs, or distributed through a queue system.
2.5 Simulation details
In order to test the quantitative performance of SOMA, we applied this method to study the isomerization of the alanine dipeptide (ACE-ALA-NME) in vacuum and the chair-to-inverted-chair transition of β-D mannose in water. All simulations were carried out with GROMACS 4.5.525 with the PLUMED 1.3 plug-in,23 adapted for the current study. For the alanine dipeptide we used the CHARMM2227,28 force-field, while for β-D mannose system we employed GLYCAM0629 with 1-4 AMBER scaling parameters. All simulations were carried out at a constant temperature of 300 K, using a stochastic velocity-rescaling thermostat30 with a time-period of 1 ps. Constraints were applied to all bonds to hydrogen atoms, using LINCS.31 The simulation time-step was 2 fs. The β-D mannose system included 661 TIP3P water molecules32 enclosed in a periodic orthorhombic box with periodic boundary conditions. In this last system, electrostatic interactions were computed with the Particle-Mesh-Ewald method33 using an isotropic grid-point spacing of 0.12 nm and a directspace cutoff of 1.3 nm. After standard thermalization and pressurization with the Berendsen barostat,34 the box size reached 20.2 nm3.
3 Results
3.1 Isomerization of the alanine dipeptide
3.1.1 Minimum free-energy path
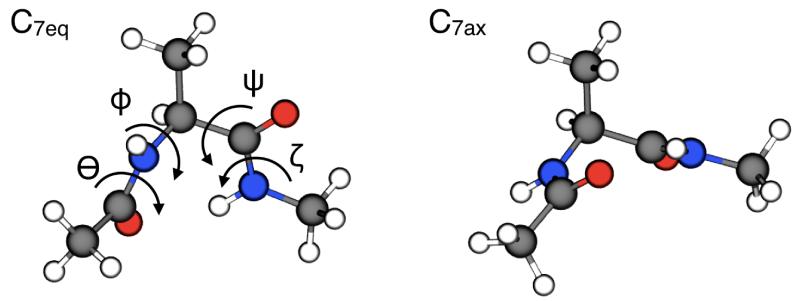
The alanine dipeptide is a simple biomolecule that features a high barrier (much larger than kBT at room temperature) between two metastable states. Hence, this system is a typical benchmark for methods that enhance sampling of rare events.5,8,9,14,17,35-50 The molecular structures of the two main metastable states, referred to as C7ax and C7eq, are depicted in Fig. 2. The system is frequently studied using the Ramachandran dihedral angles φ and ψ as collective variables (Fig. 2); however, it has been shown that the isomerization transition can be accurately described only if the peptide-bond dihedral angles, Θ and ζ are also included.9,35,51
Figure 2. Molecular structure of the alanine dipeptide in the C7eq and C7ax isomers.
The Ramachandran dihedral angles φ and ψ define the conformation of the backbone. The peptide-bond dihedral angles Θ and ζ define the arrangement of the amide and carbonyl dipoles, relative to each other and the side-chain. The C7eq metastable state is characterized by Φ = −1.41 rad, Ψ = 1.25 rad, Θ = −3.12 rad and ζ = 3.07 rad, while for C7ax state Φ =1.26 rad, Ψ = −1.27 rad, Θ = 3.13 rad and ζ = −3.03 rad (after minimization in vacuum with the CHARMM22 force-field). All molecular graphics in the article were produced with VMD.61
As mentioned, here we use instead Cartesian coordinates as collective variables, and employ dihedral angles only to construct the initial string and to represent graphically some of the results. Specifically, the string is defined in terms of the Cartesian coordinates of all atoms in the molecule, except the hydrogen atoms in the methyl groups. The number of degrees of freedom considered is therefore 39. To obtain the set of images for the initial string we carried out a 9 ps molecular dynamics simulation in which the molecule was driven from C7eq to C7ax, by steering both dihedral angles progressively and concurrently, using harmonic potentials on Φ and Ψ with force constant 150 kJoule/(mol rad2). The resulting path was therefore linear in the space of the Ramachandran dihedral angles, although naturally the initial images were not equally spaced in the Cartesian coordinates used by SOMA. This is corrected after the first round of reparametrization.
It is worth pointing out that the procedure of generating the initial path used here is intentionally suboptimal, since our purpose is to assess the robustness of SOMA. More sophisticated approaches may be required for more complex systems. Possible approaches include geometrical interpolation through morphing,52,53 and the extraction of reactive trajectories obtained from replica-exchange or enhanced-sampling simulations. Incorporation of available experimental data might be also advantageous.54
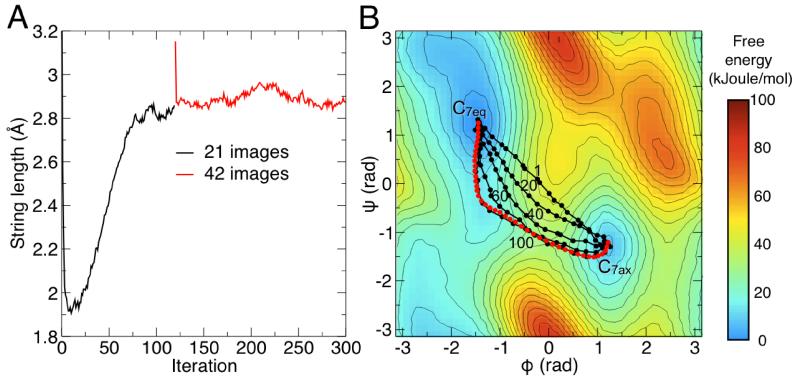
A first SOMA calculation was carried out with 21 images, using 6 ps of sampling time to obtain the mean-force estimate at each image. In these calculations, we used the restraining potential specified in Eq. 25 with k = 109 kJoule/(mol nm4) with the self-fitting scheme introduced in Sec. 2.4. In an initial phase of 0.6 ps the structure of the molecule is steered toward the reference conformation; thus, each coordinate remained in close proximity to its reference structure. All images in the string, including the end-points, were displaced along the mean-force projections using a step of Δx = 0.0025 nm, to ensure a continuous evolution of the string.
Convergence of the length of the string was observed after 120 iterations of the SOMA algorithm (Fig. 3A). A few iterations of the string, projected on the Ramachandran space, are shown in Fig. 3B. It is evident that the string evolves smoothly towards the expected minimum free-energy path, although we should stress that the Ramachandran projection is merely a visual guide; the string is actually defined in the 39-dimensional space of the Cartesian coordinates.
Figure 3. Convergence of the string to the minimum free-energy path.
(A) Evolution of the string length as a function of the iteration number. The string was initially defined with 21 images (black line); after convergence, the iterations were resumed after doubling the number of images (red line). (B) Evolution of the string, projected onto the space of the Ramachandran dihedral angles Φ and Ψ. For clarity only 5 iterations are displayed, along with the iteration number. The projection of the average string over the last 30 iterations from consisting of 42 images is displayed in red. The standard deviation of this average is less than 3 · 10−2 rad in both Φ and ψ. A free-energy landscape in the space of Φ and Ψ, obtained with umbrella-sampling simulations, is shown in the background. Isolines reflect increments of 5 kJoule/mol.
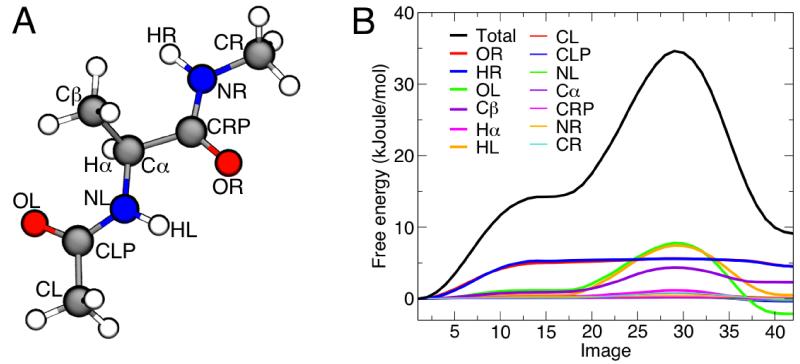
After this first calculation, we doubled the number of images in the string in order to increase its spatial resolution, and thus be able to obtain more accurate free-energy estimates along the path, and to identify the true transition state. This string was further optimized for 200 iterations (Fig. 3A). Free-energy profiles along the string were calculated for each of the last 30 iterations, and then averaged, to obtain the final minimum free-energy profile of the isomerization, shown in Fig. 4B. This profile features a barrier of 34.6 kJoule/mol, and a free-energy difference of 8.7 kJoule/mol between the C7eq and C7ax states. These values are in good agreement with those obtained using umbrella-sampling simulations in the space of Ramachandran dihedral angles (34.8 and 8.9 kJoule/mol, respectively).
Figure 4. Minimum free-energy profile for the isomerization of the alanine dipeptide, and per-atom decomposition.
(A) Molecular structure of the alanine dipeptide, indicating the atom names used in the text. (B) Total free-energy profile along the converged string (black line), and per-atom decomposition (colored lines). The first image corresponds to the C7eq state and the last one corresponds to the C7ax state. The statistical error on the total free-energy profile, obtained from averaging the last 30 iterations of the string after convergence, is less than 1 kJoule/mol on average and less then 0.2 kJoule/mol on average for each atomic contribution (not shown). A more detailed figure with the associated error bars can be found in the Supporting Information.
Finally, to assess the validity of the approximations adopted in Eq. 20 for the case of restrained dynamics, we calculated in post-processing the variability of the geometrical energy correction term for each restrained simulation along the string. The typical variability of this correction within each simulation was only 0.3 kJoule/mol. Along the string, its average value was also 0.3 kJoule/mol. It is therefore justified to consider this term constant and thus adopt Eq. 20, and consider C(zr) = C′.
3.1.2 Committor calculations
A general method to assess whether a free-energy method identifies the transition state, i.e. the quality of the collective variables, is to compute the so-called committor probability for different points along the path, and in particular where the free-energy profile is maximum. In a system with two metastable states, the committor of a point in conformational space to one of the metastable states is the probability that a trajectory initiated at that point reaches that particular state before the other. The hypersurfaces defined by the points with identical committor probabilities, or iso-committor surfaces, provide the optimal foliation of the conformational space from the reactant to the product states. The committor test is thus an effective procedure to verify the suitability of the collective variables chosen in enhanced-sampling methods, as well as the accuracy of calculated reaction paths.9,55
In practice, the test is performed first by preparing a set of conformations that hypothetically belong to a particular iso-committor surface. Then, each of these conformations is used as the starting point for a series of independent, unbiased dynamical trajectories, each of which eventually reaches one of the two possible states. For every point in the hypothetical iso-committor surface, the probability that the associated set of trajectories reaches the target state is then computed; therefore, this analysis yields a distribution of committor probability values. Ideally, these distributions should be relatively narrow and singly-peaked, displacing from 0 to 1 as the hypersurface considered becomes closer to the target state. At the transition state, the committor probability distribution should be peaked at a value of 0.5.
Thus, to assess the results obtained with SOMA for the alanine dipeptide, we calculated the committor probability distributions for images 22 to 35 along the predicted minimum free-energy path, using C7ax as the target state. In order to generate the starting ensemble of conformations at each image, we performed a simulation of 400 ps using a restraining potential on the path-collective variable previously defined in Branduardi et al.,8 namely:
| (62) |
This variable is such that the region of space where s(X) = λ consists of states that are closest to image λ than any other in the string. From these simulations, in which s(X) was restrained to integer values from 22 to 35, 50 conformations close to the path were selected for every image. The value of k in Eq. 62 was chosen to be 2.3/〈|(λi, λi+1)|〉2 where the average is calculated on all the adjacent couples of images of the string. Each conformation generated through this procedure was the starting point for a series of 200 molecular dynamics trajectories, randomly initialized according to a Maxwell-Boltzmann atomic-velocity distribution at 300 K. Each trajectory was terminated when the value of Φ was either greater than 1 rad or smaller than −1 rad. In the former case, we deemed the trajectory committed to the C7ax state; alternatively, the trajectory was considered not committed.
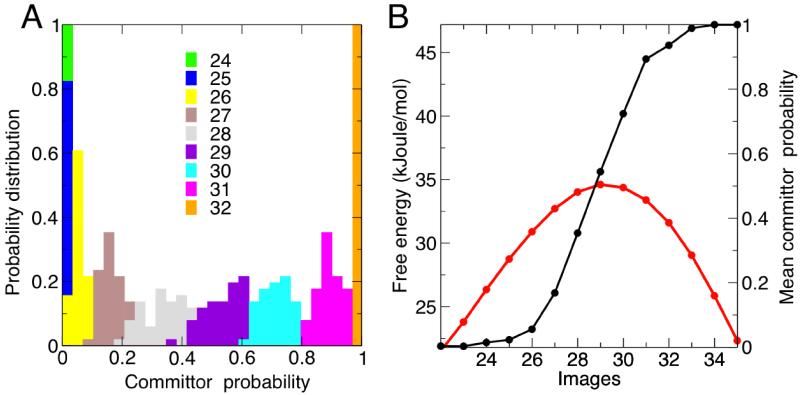
Fig. 5A shows the resulting distributions of the committor probability for images 22 to 35, based on the accumulated statistics from the 10,000 trajectories launched per image. It is apparent that all distributions are peaked around a single value, which progressively spans the expected range. In Fig. 5B, we plot the mean-value of the distributions, as a function of the image number, in comparison with the free energy at each image. It is clear that the image with a mean committor probability of 0.5 corresponds to the transition state, as defined from the free-energy profile. These results validate the SOMA methodology and the minimum free-energy path calculated here for the isomerization of the alanine dipeptide.
Figure 5. Committor probability test of the calculated minimum free-energy path for alanine dipeptide isomerization.
(A) Probability distributions of the committor to state C7ax as a function of the image number, around the transition state. Note that the distribution for state 29 is strongly peaked around a value of 0.5. Individual plots are shown in the Supporting Information. (B) Mean committor probability, from the distributions in panel (A), as a function of the image number. A close-up of the free-energy profile around the transition state is overlaid for comparison (in red). Note that the mean committor probability of the transition state (image 29) is approximately 0.5.
3.1.3 Free-energy decomposition and isomerization mechanism
An advantage of the Cartesian-coordinate formulation of SOMA is that it permits a straightforward decomposition of the minimum free-energy profile into per-atom contributions, according Eq. 61. Such analysis reveals which atoms in the molecule are most influential in altering its chemical or conformational state. That is, when the molecular system changes uphill, driven by thermal fluctuations, the decomposition identifies the atoms that offer the most resistance; when the system evolves downhill, the analysis shows which atoms drive the change. As is well known, any decomposition of a free-energy change is path-dependent; arguably, however, the dissection of the minimum free-energy path reveals the predominant mechanism of the conformational or chemical process under consideration.
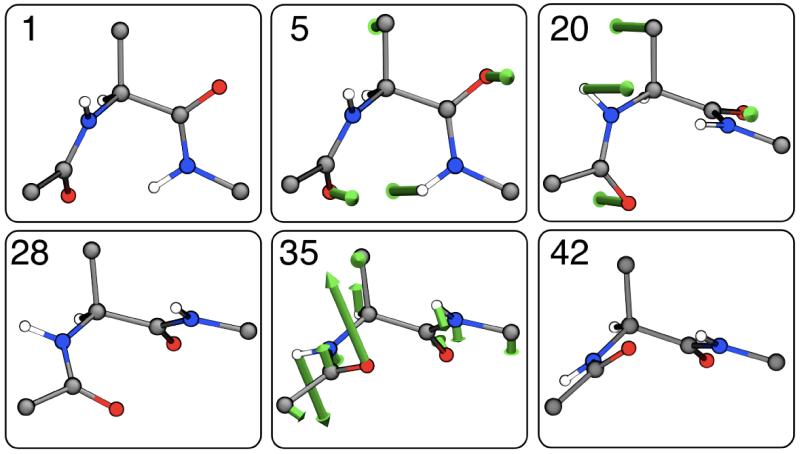
Fig. 4B shows the per-atom contributions to the free energy of isomerization of the alanine dipeptide, as a function of the image number. In Fig. 6, we show the underlying atomic mean forces, projected along the corresponding displacement vectors, for a few representative images. Strikingly, only a handful of atoms plays a significant role in the process, none of which are in the backbone of the molecule. Early on in the isomerization from C7eq (image 1) to C7ax (image 42), the only prominent contributions are those from atoms HR and OR (Fig. 4A for atom names), i.e. the peripheral atoms in the N-terminal backbone dipoles, connected by the peptide bond (image 5). After reaching a plateau, the isomerization proceeds resisted only by the Cβ atom in the side-chain, and by atoms HL and OL, in the C-terminal dipoles (image 20). After the transition state (image 28), it is mostly these two atoms that drive the molecule downhill (image 35) towards the C7ax conformation.
Figure 6. Atomic mechanism of isomerization of the alanine dipeptide.
The figure shows the projections of the atomic mean-force vectors for representative images along the lowest free energy path. The vectors shown are defined as , i.e. they represent the atomic mean forces along the displacement vector along the path. For clarity, only forces of magnitude larger than 200 kJoule/nm are displayed.
As mentioned above, it is known that the Ramachandran dihedrals Φ and ψ, are insufficient to identify the most probable path of the isomerization process. In addition to these, it is necessary to consider the peptide-bond torsions, Θ and ζ (Fig. 2A).9,35,51 Our results provide a clear rationale for this observation: Φ and ψ define the arrangement of the nitrogen and carbon atoms in the backbone dipoles, relative to Cα−Cβ side-chain, but none of these atoms, except Cβ, resist or drive the isomerization process. All the relevant atomic contributions are considered, however, when the peptide-bond torsions Θ and ζ are also included. Altogether these four backbone torsions define the relative position of the hydrogen and oxygen atoms in the backbone dipoles, relative to the dipeptide side-chain.
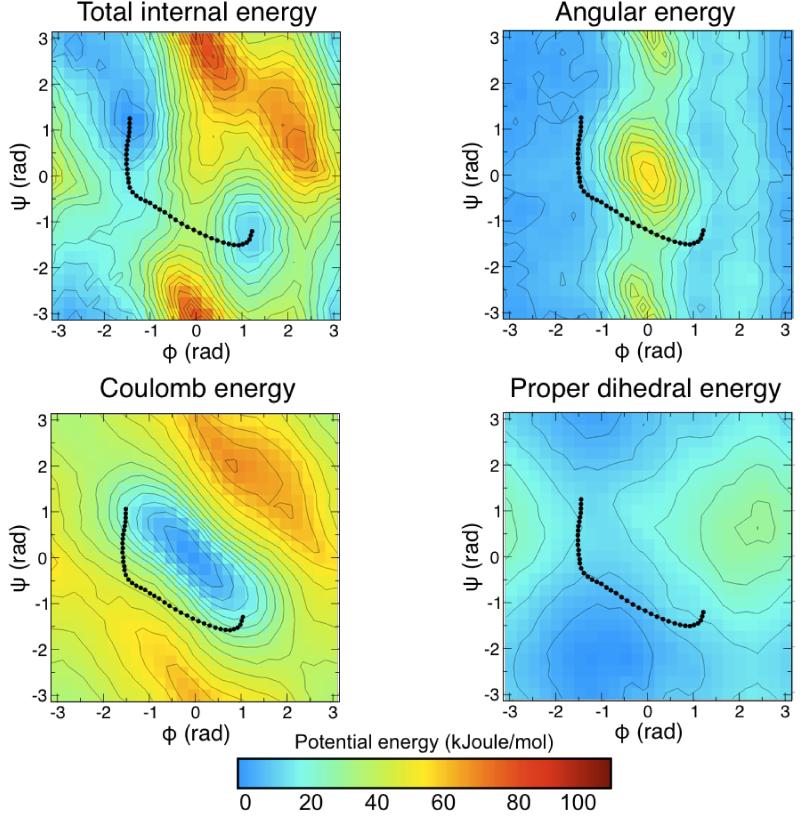
From a mechanistic standpoint, the ranking of the atomic contributions to the free-energy profile indicates that the isomerization of the alanine dipeptide is primarily resisted (uphill) or driven (downhill) by electrostatic interactions among the oxygen and hydrogen atoms in the backbone dipoles, sterically restricted by the Cβ atom in the dipeptide sidechain. Because the molecular energetics is encoded by the force-field, one would expect this mechanism to be consistent with a decomposition of the average potential-energy landscape into its various bonded and non-bonded contributions. As shown in Fig. 7, this is indeed the case. The most probable isomerization path appears to be the result of two competing contributions; the Coulomb term, which by itself would favor the concurrent rotation of the N- and C-terminal torsions; and the bond-angle term, which seems to reflect the presence of a strong steric barrier, which must be circumvented. By comparison, all other energy terms, including that from the dihedral-angles, have a marginal contribution. This is not to say that these terms are irrelevant; evidently they are key to define the chemical structure of the molecule. However they do not influence the isomerization of the molecule between the C7eq and C7ax states.
Figure 7. Decomposition of the internal energy landscape of the alanine dipeptide, in the space of the Ramachandran dihedral angles.
The internal-energy landscape was obtained from the umbrella-sampling calculations used in Fig. 3B, averaging the potential energy of 100 conformations at each point in the Φ/Ψ space. The most relevant contributions to the internal energy are shown alongside. Note that although the internal-energy and freeenergy landscapes are very similar, they are not identical. This indicates that the variations in conformational entropy in the Φ/Ψ space are much smaller than the changes in potential energy. The projection of the average over the last 30 iterations of the string optimization is shown with black dots.
3.1.4 Dimensionally-reduced string with essential degrees of freedom
As we reported in the previous section, the dissection of the free-energy profile into atomic contributions indicates that only a handful of atoms in the alanine dipeptide influences the isomerization mechanism. This result explains why all four backbone dihedrals are required to characterize this process via enhanced-sampling approaches based on torsions, and is also consistent with a qualitative inspection of the contributions to the internal-energy landscape of the molecule. This notwithstanding, the ultimate implication of the atomic decomposition is that most of the atomic degrees of freedom in the molecule are unnecessary to obtain a reasonably accurate description of the conformational change. Therefore, one should be able to re-compute the minimum-free-energy path using a string of reduced dimensionality, and obtain nearly identical results, both in terms of the free-energy profile, the committor probabilities, and the mechanism.
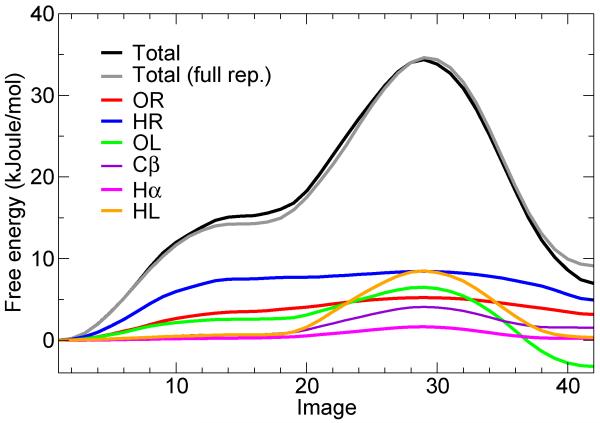
Thus, we repeated the SOMA optimization procedure and subsequent analysis, for a sting that includes only the Cartesian coordinates of atoms OL, HL, OR, HR and Cβ, which are the dominant contributors (Fig. 4), as well as Hα, whose contribution is much smaller but not entirely negligible. The dimensionality of this string is therefore reduced from 39 to 18.
As Fig. 8 shows, the free-energy profile resulting from this second SOMA calculation is nearly identical to that obtained previously. The decomposition again shows that atoms OL, HL, OR, HR and Cβ are key, while the contribution from Hα is minor. The only significant differences between high and low-dimensional strings are seen early on in the isomerization, with a greater contribution of atoms HR and OL in the reduced string. Further inspection (not shown) reveals that these subtle differences in the calculated free energy are due to differences in the atomic mean-force vectors calculated for each image (second term in Eq. 61), rather than in the displacement vectors among images (first term in Eq. 61). That is, in the low-dimensional string there is a slight redistribution of the mean forces, on account of the missing degrees of freedom, but the dimensionality reduction has a minimal effect on the reparametrization and structural-alignment algorithms. Thus, the overall mechanism of the isomerization revealed by the free-energy dissection is largely unchanged.
Figure 8. Minimum free-energy profile and per-atom decomposition for the isomerization of the alanine dipeptide, using a string with reduced dimensionality.
The coloring scheme is the same as in Fig. 4B. The first image corresponds to the C7eq state and the last one corresponds to the C7ax state. For comparison, the free-energy profile obtained with the high-dimensional string (Fig. 4B) is shown in grey.
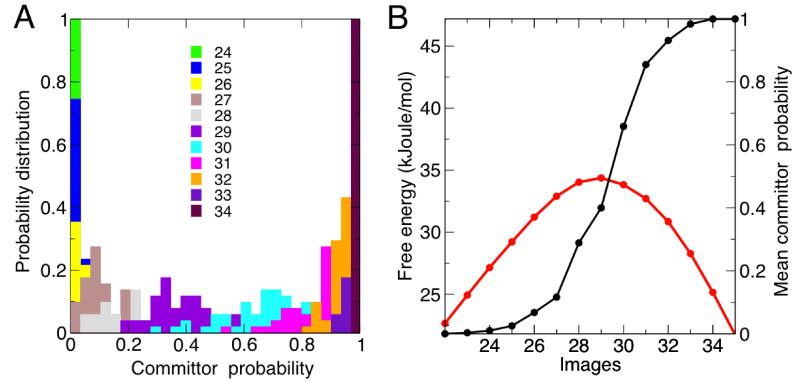
Importantly, analysis of the committor probabilities for the low-dimensional path yields excellent results, considering the extreme simplification of the string and how sensitive these quantities are to the precise definition of the path and its transition state (Fig. 9). The committor distributions are somewhat broader than in the high-dimensional case (Fig. 9A), and the committor probability of the transition state (image 29) is slightly greater than 0.5 (Fig. 9B). However, better results could hardly be expected, given the fact that the dimensionality reduction used here is guided by a ranking of the atomic free-energy contributions along the entire length of the path. Committor distributions are however local features that pertain to the transition state; thus, all degrees of freedom with a non-zero free-energy change across the transition state ought to be considered for an optimal result, strictly speaking.
Figure 9. Committor probabilities for the minimum free-energy path for the alanine dipeptide isomerization, calculated with the low-dimensional string.
(A) Probability distributions of the committor to state C7ax as a function of the image number, around the transition state. A more detailed view is enclosed in the Supporting Information. (B) Mean committor probability, from the distributions in panel (A), as a function of the image number. A close-up of the free-energy profile around the transition state is again overlaid for comparison (in red). Note that the mean committor probability of the transition state (image 29) slightly greater than that obtained for the high-dimensional string, but still close to 0.5.
In sum, we conclude that the results obtained for the low-dimensional string provide further validation to the proposed atomic mechanism of isomerization of the alanine dipeptide, and to thus to the SOMA approach. Moreover, these results illustrate the potential of the string method as a framework for a rational, physically meaningful coarse-graining of degrees of freedom in chemical and conformational transitions.
3.2 Isomerization of β-D mannose in explicit solvent
In order to further assess the proposed method, we applied SOMA to the chair-to-inverted-chair isomerization of β-D mannose in water. The chair inversion in saccharides is a complex process that has been studied in depth via free-energy techniques,56-59 using ad-hoc descriptors to enhance the transition, for example the Cremer-Pople60 puckering coordinates. We analyze this mechanism to show that SOMA can be successfully applied in solvated molecular systems featuring non-trivial conformational pathways, with minimal knowledge of the system a priori.
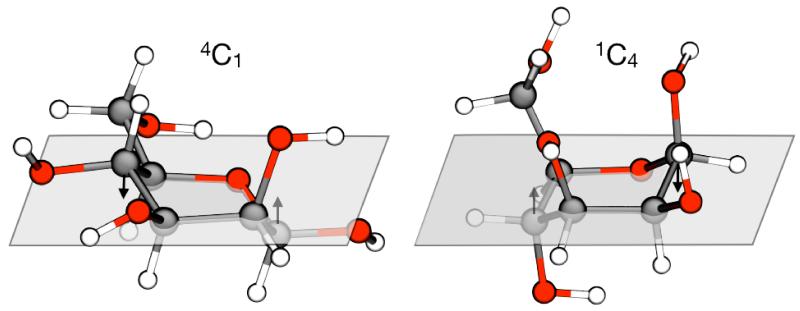
The two chair isomers are represented in Fig. 10. We use the standard nomenclature based on the location of the carbon atoms in the ring with respect to a plane crossing C2, C3, C5 and O5 (see Fig. 11 for atom names). In the orientation depicted, if the carbon atom C4 lies above the plane while C1 is below it, the isomer is called “chair” or . Conversely, the isomer is called “inverted chair” or . The transition from one conformer to the other proceeds through a series of intermediates in which adjacent ring atoms adopt different staggered conformations. If two couples of adjacent atoms form a plane, the conformer is classified as “boat” or B; if the plane is formed by three adjacent atoms and one on the opposite side of the ring, the conformation is called “skew-boat”, or S. Subscripts or superscripts are added to B or S to denote the atoms that are above or below the plane.
Figure 10. Representative conformations of the and isomers of β-D mannose.
The arrows indicate the major differences in the positions of the ring atoms with respect to the plane defined by C2, C3, C5 and O5. See Fig. 11A for atom names.
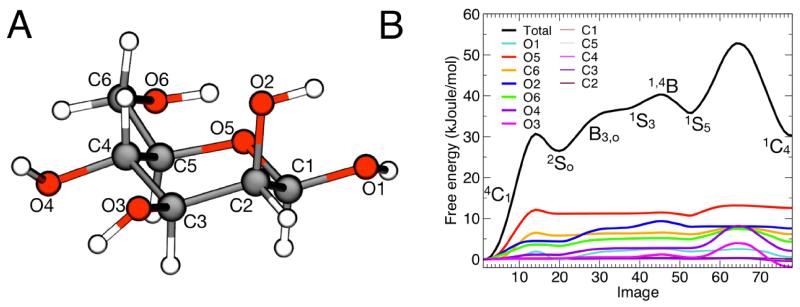
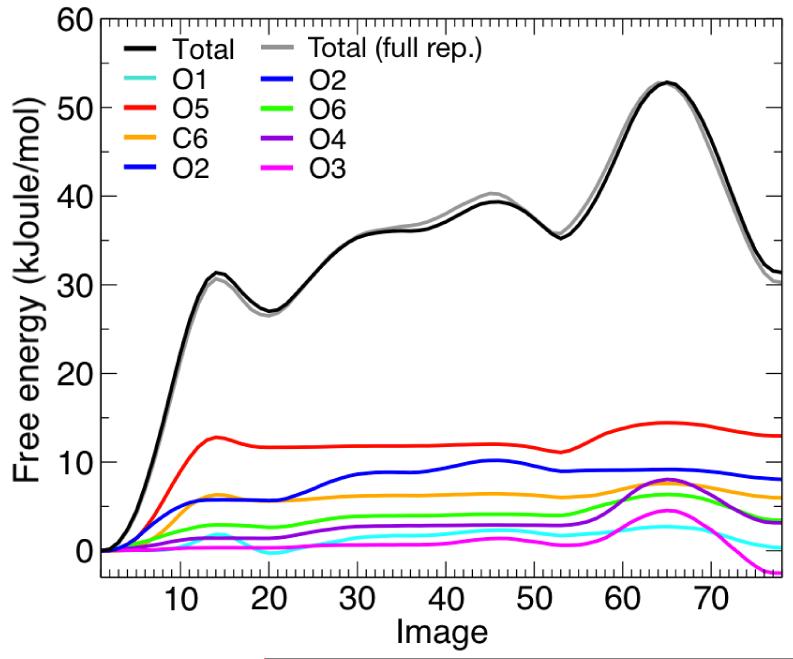
Figure 11. Minimum free-energy profile for the isomerization of β-D mannose, and per-atom decomposition.
(A) Molecular structure of β-D mannose with atom names used in the text. (B) Final free-energy profile obtained through SOMA and per-atom decomposition. Intermediate states are indicated. The statistical error on the total free-energy profile, obtained from averaging the last 30 iterations of the string after convergence, is less than 1 kJoule/mol on average and less then 0.2 kJoule/mol on average for each atomic contribution (not shown). A more detailed figure with the associated error bars can be found in the Supporting Information.
To characterize the complete isomerization transition with SOMA, we used the Cartesian coordinates of all non-hydrogen atoms in the molecule (12) to define a string of states. An initial set of 24 images was extracted from a targeted MD trajectory in which was driven toward conformer in 20 ps. The string was optimized as described above, using steps of 0.0025 nm and a spring constant of 109 kJoule/(mol nm4), and appeared to be converged after 100 iterations. To obtain a more accurate path, we increased the number of images to 78 and optimized the string with 20 additional iterations using a reduced step of 0.001 nm. The resulting free-energy profile is shown in Fig. 11B. The free-energy difference between and was 30.3 kJoule/mol. This value is somewhat smaller than that obtained by Spiwok et al.59 for β-D glucopyranose, namely 40 kJoule/mol. This discrepancy can be ascribed to the different chirality of the two molecules.
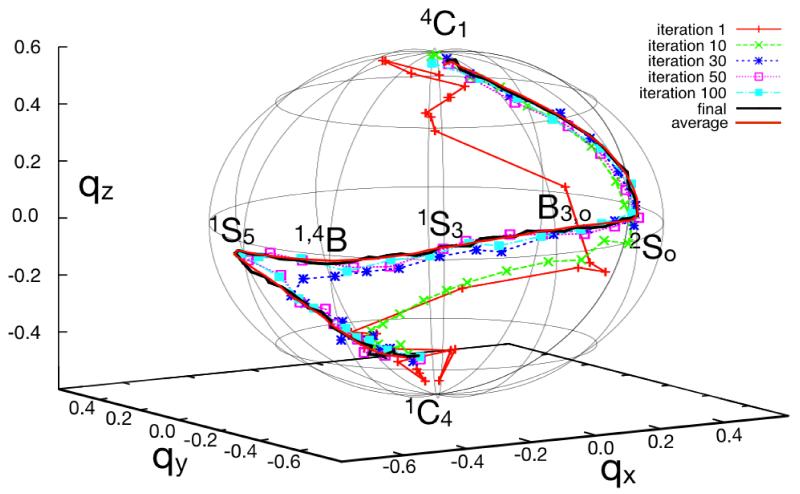
To better understand the topological features of the resulting path, in Fig. 12 we show various iterations of the optimization procedure projected onto the space conventional Cremer-Pople puckering coordinates. Briefly, these coordinates represent the deviation of a six-membered ring with respect to an ideal plane, by using three values, namely Q, θ and φ, which define a set of polar coordinates. Following the implementation of Autieri et al.,57 these are defined by:
| (63) |
| (64) |
| (65) |
where zj is the distance of each atom of the ring with respect to the mean plane passing through the ring itself. In this space the conformations of the molecule are depicted in a spherical projection with the two chair conformations and positioned at opposite poles. Skew-boat and boat conformations alternate one another along the equator.
Figure 12. Optimization of the string for the to isomerization of β-D mannose.
Different iterations of the string are shown, projected onto the space of qx, qy, qz Cremer-Pople coordinates. A sphere of radius 0.6 is shown as reference for the path. The various intermediate conformations are denoted with standard saccharides nomenclature. The projection of the average string from the last 30 iterations of string optimization is shown with a continuous thick red line.
As Fig. 12 shows, the string rapidly converges to a path that crosses the equatorial boat and skew-boat intermediates, ending up in the conformation. This pathway is in qualitative agreement with that found by Autieri,57 in spite of the differences in the force-field used. It also resembles that reported by Ardèvol et al.58 based on Car-Parrinello metadynamics simulations in vacuum, as well as that found by Spiwok et al.59 for β-D glucopyranose with the same force-field used here. The consistency of these results is worth noting, given that SOMA requires only that two end-points are defined, and does not rely on process-specific conformational coordinates.
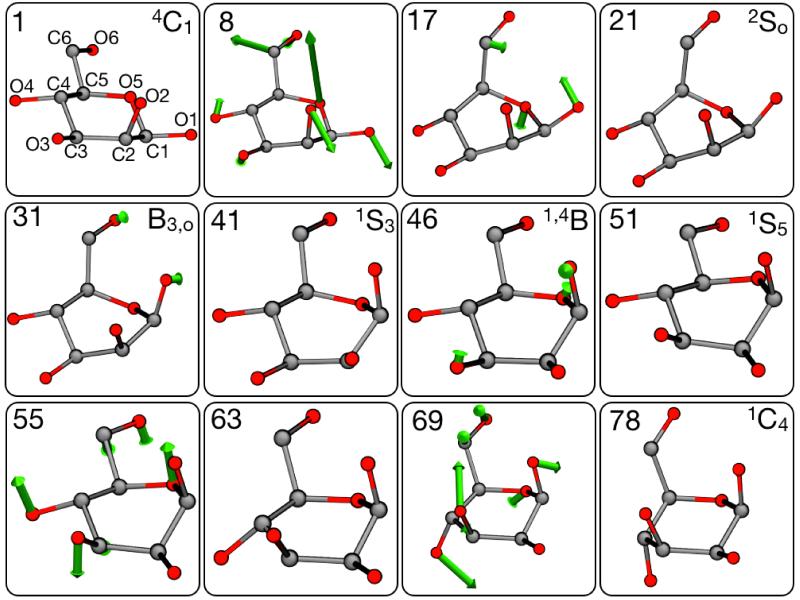
The per-atom decomposition of the free-energy profile in Fig. 11B shows that the isomerization mechanism is controlled for the most part by the electrostatic dipoles at the periphery of the sugar ring, which act as handles that resist or drive the conformational change; this is analogous to what we observe for the alanine dipeptide. The initial part of the transition, from to , involves the out-of-plane displacement of the ring oxygen atom, O5, which offers the most resistance, along with C6, O6, O1 and O2 (Fig. 13, image 8). Eventually the strain on the molecule is somewhat reduced (Fig. 13, image 7), and the intermediate is metastable (Fig. 13, image 21), in agreement with the results from Spiwok et al.59 for β-D glucopyranose. Conformations B3, O, and 1,4B can be subsequently reached with a steady increase in the free energy, provided that further uphill rearrangements of O1 and O2 take place (Fig. 13, images 31, 41 and 46). A second metastable state is found in the conformation, as atoms O2 and O3 become displaced towards the center of the ring plane (Fig. 13, image 51). This intermediate was detected by Autieri et al.57 but not by Spiwok et al.,59 due to the particular chirality of β-D glucopyranose. The last free-energy barrier, towards , requires again uphill forces in several atoms (Fig. 13, image 55), but arises mostly from the resistance posed by O3 and O4. Finally, after the transition state, a global stress release takes place, with most of the atoms included in the string contributing to lower the total free-energy of the system (Fig. 13, image 69).
Figure 13. Representative conformations of β-D mannose along the to isomerization.
The figure shows the projections of the atomic mean-force vectors for representative images along the final string. The vectors shown are defined as , i.e. they are the atomic mean forces along the displacement vector along the path. For clarity, only forces of magnitude larger than 400 kJoule/nm are displayed.
As we did for the alanine dipeptide, we further assessed the hypothesis that the process just described is the dominant atomic mechanism of isomerization by re-computing the minimum free-energy path after removing from the definition of the string those atoms with a negligible contribution to the profile shown in Fig. 11B. This coarse-grained string was re-optimized over 50 iterations. The resulting free-energy profile and per-atom contributions are shown in Fig. 14. It is apparent that the mechanism remains largely unchanged.
Figure 14. Minimum free-energy profile and atomic contributions for the isomerization of β-D mannose, using a string with reduced dimensionality.
Atomic contributions are indicated with colors. The coloring scheme is the same as in Fig. 11B. The first image corresponds to the state and the last one corresponds to the state. For comparison, the free-energy profile obtained with the high-dimensional string (Fig. 11B) is shown in grey.
4 Conclusions
We have introduced a variant of the string method in collective variables,9 which we refer to as String-method with Optimal Molecular Alignment (SOMA). This approach is particularly suited for the calculation of minimum-free-energy paths in terms of highly-multidimensional sets of Cartesian coordinates. In this scheme, rotations and translations of the molecular system of interest need not be restricted, and a posteriori projections of the free energy on internal degrees of freedoms are not required.15 Thus, the SOMA method provides a straightforward approach to analyze chemical or conformational reactions in gas and solution. The use of Cartesian components can also be exploited to identify and characterize the most probable reaction mechanism at the atomic level. Thus, this approach provides a detailed understanding of the molecular system, as well as a physically-meaningful framework for rational coarse-graining. To illustrate the potential and performance of the SOMA methodology, we have analyzed the isomerization of the alanine dipeptide in vacuum and the chair-to-inverted-chair transition of β-D mannose in explicit solvent. Notwithstanding the simplicity of these systems, the SOMA calculations reveal novel insights into to the mechanism of these isomerizations, which to our knowledge had not been previously reported. We have also shown how these insights can be used in practice to drastically reduce the dimensionality with which the isomerization path is described, while retaining the dynamical quality of the transition state, and near-identical energetics and mechanism. In sum, we anticipate that the SOMA method will be an insightful and straightforward approach to characterize the thermodynamics and mechanisms of a wide range of molecular processes in chemistry and biophysics.
Supplementary Material
Acknowledgement
The authors are very thankful to Luca Maragliano for extensive discussions on the SOMA methodology and his help in the preparation of the manuscript. We are also thankful to Eric Vanden-Eijnden for his constructive criticisms and suggestions, and to Michele Ceriotti and Fabrizio Marinelli for their for useful comments on this manuscript.
Footnotes
Detailed free energy profiles including error bars and committor distributions represented individually are provided. This information is available free-of-charge via the Internet at http://pubs.acs.org.
References
- (1).Torrie GM, Valleau JP. J. Comput. Phys. 1977;23:187–199. [Google Scholar]
- (2).Roux B. Comp. Phys. Comm. 1995;91:275–282. [Google Scholar]
- (3).Mezei M. J. Comput. Phys. 1987;68:237–248. [Google Scholar]
- (4).Darve E, Pohorille A. J. Chem. Phys. 2001;115:9169–9183. [Google Scholar]
- (5).Laio A, Parrinello M. Proc. Natl. Acad. Sci. USA. 2002;99:12562–12566. doi: 10.1073/pnas.202427399. [DOI] [PMC free article] [PubMed] [Google Scholar]
- (6).Fukunishi H, Watanabe O, Takada S. J. Chem. Phys. 2002;116:9058–9067. [Google Scholar]
- (7).Faraldo-Gómez JD, Roux B. J. Comput. Chem. 2007;28:1634–1647. doi: 10.1002/jcc.20652. [DOI] [PubMed] [Google Scholar]
- (8).Branduardi D, Gervasio FL, Parrinello M. J. Chem. Phys. 2007;126:054103. doi: 10.1063/1.2432340. [DOI] [PubMed] [Google Scholar]
- (9).Maragliano L, Fischer A, Vanden-Eijnden E, Ciccotti G. J. Chem. Phys. 2006;125:024106. doi: 10.1063/1.2212942. [DOI] [PubMed] [Google Scholar]
- (10).E W, Ren W, Vanden-Eijnden E. Phys. Rev. B. 2002;66:052301. [Google Scholar]
- (11).Vanden-Eijnden E, Venturoli M. J. Chem. Phys. 2009;130:194103. doi: 10.1063/1.3130083. [DOI] [PubMed] [Google Scholar]
- (12).Chen M, Yang W. J. Comp. Chem. 2009;30:1649–1653. doi: 10.1002/jcc.21311. [DOI] [PubMed] [Google Scholar]
- (13).Cao L, Lv C, Yang W. J. Chem. Theor. Comput. 2013 doi: 10.1021/ct400198q. 130724080026008. [DOI] [PMC free article] [PubMed] [Google Scholar]
- (14).Díaz Leines G, Ensing B. Phys. Rev. Lett. 2012;109:020601. doi: 10.1103/PhysRevLett.109.020601. [DOI] [PubMed] [Google Scholar]
- (15).Ovchinnikov V, Karplus M, Vanden-Eijnden E. J. Chem. Phys. 2011;134:085103. doi: 10.1063/1.3544209. [DOI] [PMC free article] [PubMed] [Google Scholar]
- (16).Miller TF, III, Vanden-Eijnden E, Chandler D. Proc. Natl. Acad. Sci. USA. 2007;104:14559–14564. doi: 10.1073/pnas.0705830104. [DOI] [PMC free article] [PubMed] [Google Scholar]
- (17).Haas K, Chu J-W. J. Chem. Phys. 2009;131:144105. doi: 10.1063/1.3243080. [DOI] [PubMed] [Google Scholar]
- (18).Kearsley S. Acta Crystallogr., Sect. A: Cryst. Phys., Diffr., Theor. Gen. Crystallogr. 1989;A45:208–210. [Google Scholar]
- (19).Carter E, Ciccotti G, Hynes J, Kapral R. Chem. Phys. Lett. 1989;156:472–477. [Google Scholar]
- (20).Ciccotti G, Kapral R, Vanden-Eijnden E. ChemPhysChem. 2005;6:1809–1814. doi: 10.1002/cphc.200400669. [DOI] [PubMed] [Google Scholar]
- (21).E W, Ren W, Vanden-Eijnden E. J. Chem. Phys. 2007;126:164103. doi: 10.1063/1.2720838. [DOI] [PubMed] [Google Scholar]
- (22).Henkelman G, Jónsson H. J. Chem. Phys. 2000;113:9978–9985. [Google Scholar]
- (23).Bonomi M, Branduardi D, Bussi G, Camilloni C, Provasi D, Raiteri P, Donadio D, Marinelli F, Pietrucci F, Broglia RA, Parrinello M. Comp. Phys. Comm. 2009;180:1961–1972. [Google Scholar]
- (24).Phillips JC, Braun R, Wang W, Gumbart J, Tajkhorshid E, Villa E, Chipot C, Skeel R, Kalé L, Schulten K. J. Comput. Chem. 2005;26:1781–802. doi: 10.1002/jcc.20289. [DOI] [PMC free article] [PubMed] [Google Scholar]
- (25).Hess B, Kutzner C, van der Spoel D, Lindahl E. J. Chem. Theor. Comput. 2008;4:435–447. doi: 10.1021/ct700301q. [DOI] [PubMed] [Google Scholar]
- (26).Case DA, Cheatham TE, Darden T, Gohlke H, Luo R, Merz K, Onufriev A, Simmerling C, Wang B, Woods R. J. Comput. Chem. 2005;26:1668–1688. doi: 10.1002/jcc.20290. [DOI] [PMC free article] [PubMed] [Google Scholar]
- (27).MacKerell AD, Jr., Bashford D, Bellot M, Dunbrack RL, Jr., Evanseck JD, Field MJ, Fischer S, Gao J, Guo H, Ha S, Joseph-McCarthy D, Kuchnir L, Kuczera K, Lau FTK, Mattos C, Michnick S, Ngo T, Nguyen DT, Prodhom B, Reiher WE, III, Roux B, Schlenkrich M, Smith JC, Stote R, Straub J, Watanabe W, Wiorkiewicz-Kunczera J, Yin D, Karplus M. J. Phys. Chem. B. 1998;102:3586–3616. doi: 10.1021/jp973084f. [DOI] [PubMed] [Google Scholar]
- (28).MacKerell AD, Feig M, Brooks CL., III J. Comp. Chem. 2004;25:1400–1415. doi: 10.1002/jcc.20065. [DOI] [PubMed] [Google Scholar]
- (29).Kirschner K, Yongye A, Tschampel S, González-Outeiriño J, Daniels C, Foley B, Woods R. J. Comput. Chem. 2008;29:622–655. doi: 10.1002/jcc.20820. [DOI] [PMC free article] [PubMed] [Google Scholar]
- (30).Bussi G, Donadio D, Parrinello M. J. Chem. Phys. 2007;126:014101. doi: 10.1063/1.2408420. [DOI] [PubMed] [Google Scholar]
- (31).Hess B. J. Chem. Theor. Comput. 2008;4:116–122. doi: 10.1021/ct700200b. [DOI] [PubMed] [Google Scholar]
- (32).Jorgensen W, Chandrasekhar J, Madura J, Impey R, Klein M. J. Chem. Phys. 1983;79:926. [Google Scholar]
- (33).Essmann U, Perera L, Berkowitz ML, Darden T, Lee H, Pedersen LG. J. Chem. Phys. 1995;107:8577–8592. [Google Scholar]
- (34).Berendsen HJC, Postma JPM, DiNola A, Haak JR. J. Chem. Phys. 1984;81:3684–3690. [Google Scholar]
- (35).Bolhuis PG, Dellago C, Chandler D. Proc. Natl. Acad. Sci. USA. 2000;97:5877–5882. doi: 10.1073/pnas.100127697. [DOI] [PMC free article] [PubMed] [Google Scholar]
- (36).Ren W, Vanden-Eijnden E, Maragakis P, E W. J. Chem. Phys. 2005;123:134109. doi: 10.1063/1.2013256. [DOI] [PubMed] [Google Scholar]
- (37).Khavrutskii IV, Arora K, Brooks CL., III J. Chem. Phys. 2006;125:174108. doi: 10.1063/1.2363379. [DOI] [PubMed] [Google Scholar]
- (38).Maragliano L, Vanden-Eijnden E. Chem. Phys. Lett. 2007;446:182–190. [Google Scholar]
- (39).Gfeller D, De Los Rios P, Caflisch A, Rao F. Proc. Natl. Acad. Sci. USA. 2007;104:1817–1822. doi: 10.1073/pnas.0608099104. [DOI] [PMC free article] [PubMed] [Google Scholar]
- (40).Spiwok V, Lipovová P, Králová B. J. Phys. Chem. B. 2007;111:3073–3076. doi: 10.1021/jp068587c. [DOI] [PubMed] [Google Scholar]
- (41).van der Vaart A, Karplus M. J. Chem. Phys. 2007;126:164106. doi: 10.1063/1.2719697. [DOI] [PubMed] [Google Scholar]
- (42).Sega M, Faccioli P, Pederiva F, Garberoglio G, Orland H. Phys. Rev. Lett. 2007;99:118102. doi: 10.1103/PhysRevLett.99.118102. [DOI] [PubMed] [Google Scholar]
- (43).Barducci A, Bussi G, Parrinello M. Phys. Rev. Lett. 2008;100:020603. doi: 10.1103/PhysRevLett.100.020603. [DOI] [PubMed] [Google Scholar]
- (44).Spiwok V, Králová B, Tvaroska I. J. Mol. Model. 2008;14:995–1002. doi: 10.1007/s00894-008-0343-7. [DOI] [PubMed] [Google Scholar]
- (45).Strodel B, Wales D. Chem. Phys. Lett. 2008;466:105–115. [Google Scholar]
- (46).Cecchini M, Krivov SV, Spichty M, Karplus M. J. Phys. Chem. B. 2009;113:9728–9740. doi: 10.1021/jp9020646. [DOI] [PMC free article] [PubMed] [Google Scholar]
- (47).Bonomi M, Barducci A, Parrinello M. J. Comput. Chem. 2009;30:1615–1621. doi: 10.1002/jcc.21305. [DOI] [PubMed] [Google Scholar]
- (48).Dickson BM, Legoll F, Lelievre T, Stoltz G, Fleurat-Lessard P. J. Phys. Chem. B. 2010;114:5823–5830. doi: 10.1021/jp100926h. [DOI] [PubMed] [Google Scholar]
- (49).Májek P, Elber R. J. Chem. Theor. Comput. 2010;6:1805–1817. doi: 10.1021/ct100114j. [DOI] [PMC free article] [PubMed] [Google Scholar]
- (50).Ledbetter PJ, Clementi C. J. Chem. Phys. 2011;135:044116. doi: 10.1063/1.3610957. [DOI] [PMC free article] [PubMed] [Google Scholar]
- (51).Ma A, Dinner AR. J. Phys. Chem. B. 2005;109:6769–6779. doi: 10.1021/jp045546c. [DOI] [PubMed] [Google Scholar]
- (52).Krebs WG. Nucleic Acids Res. 2000;28:1665–1675. doi: 10.1093/nar/28.8.1665. [DOI] [PMC free article] [PubMed] [Google Scholar]
- (53).Berteotti A, Cavalli A, Branduardi D, Gervasio FL, Recanatini M, Parrinello M. J. Am. Chem. Soc. 2009;131:244–250. doi: 10.1021/ja806846q. [DOI] [PubMed] [Google Scholar]
- (54).Lodola A, Branduardi D, De Vivo M, Capoferri L, Mor M, Piomelli D, Cavalli A. PLoS One. 2012;7:e32397. doi: 10.1371/journal.pone.0032397. [DOI] [PMC free article] [PubMed] [Google Scholar]
- (55).Geissler PL, Dellago C, Chandler D. J. Phys. Chem. B. 1999;103:3706–3710. [Google Scholar]
- (56).Biarnés X, Ardèvol A, Planas A, Rovira C, Laio A, Parrinello M. J. Am. Chem. Soc. 2007;129:10686–10693. doi: 10.1021/ja068411o. [DOI] [PubMed] [Google Scholar]
- (57).Autieri E, Sega M, Pederiva F, Guella G. J. Chem. Phys. 2010;133:095104. doi: 10.1063/1.3476466. [DOI] [PubMed] [Google Scholar]
- (58).Ardèvol A, Biarnés X, Planas A, Rovira C. J. Am. Chem. Soc. 2010;132:16058–16065. doi: 10.1021/ja105520h. [DOI] [PubMed] [Google Scholar]
- (59).Spiwok V, Králová B, Tvaroska I. Carb. Res. 2010;345:530–537. doi: 10.1016/j.carres.2009.12.011. [DOI] [PubMed] [Google Scholar]
- (60).Cremer DT, Pople JA. J. Am. Chem. Soc. 1975;97:1354–1358. [Google Scholar]
- (61).Humphrey W, Dalke A, Schulten K. J. Mol. Graphics. 1996;14:33–38. doi: 10.1016/0263-7855(96)00018-5. [DOI] [PubMed] [Google Scholar]
Associated Data
This section collects any data citations, data availability statements, or supplementary materials included in this article.


