Abstract
Rett syndrome (RTT), associated with mutations in methyl-CpG-binding protein 2 (Mecp2), is linked to diverse neurological symptoms such as seizures, motor disabilities, and cognitive impairments. An altered GABAergic system has been proposed as one of many underlying pathologies of progressive neurodegeneration in several RTT studies. This study for the first time investigated the temporal- and location-specific alterations in the expression of γ-amino butyric acid (GABA) transporter 1 (GAT-1), vesicular GABA transporter (vGAT), and glutamic acid decarboxylase 67kD (GAD67) in wild type (WT) and knockout (KO) mice in the Mecp2tm1.1Bird/y mouse model of RTT. Immunohistochemistry (IHC) co-labeling of GAT-1 with vGAT identified GABAergic synapses that were quantitated for mid-sagittal sections in the frontal cortex (FC), hippocampal dentate gyrus (DG), and striatum (Str). An age-dependent increase in the expression of synaptic GABA transporters, GAT-1, and vGAT, was observed in the FC and DG in WT brains. Mecp2 KO mice showed a significant alteration in this temporal profile that was location-specific, only in the FC. GAD67-positive cell densities also showed an age-dependent increase in the FC, but a decrease in the DG in WT mice. However, these densities were not significantly altered in the KO mice in the regions examined in this study. Therefore, the significant location-specific downregulation of synaptic GABA transporters in Mecp2 KO brains with unaltered densities of GAD67-positive interneurons may highlight the location-specific synaptic pathophysiology in this model of RTT.
Keywords: Rett syndrome, MeCP2 mutation, GABAergic neurons, synapse, lipofuscin, GAT-1
Introduction
Rett syndrome (RTT) is an X-chromosome linked neurodevelopmental disorder that afflicts one in 10,000–22,000 females.1 Typical RTT symptoms include severe seizures, autistic behavior, and impaired language and motor abilities.2 More than 95% of RTT is associated with mutations in the genes encoding a transcription repressor: methyl-CpG- binding protein 2 (MeCP2).2,3 The complex upstream and downstream pathways of MeCP2 even involve microRNAs and neurotrophic factors such as miR-132 and BDNF,4 and the potential roles of MeCP2 include modulating the neuroplasticity in diverse neuropsychiatric diseases including RTT.5,6 Recent studies on Mecp2 mutant mice have reported developmental alterations specific to GABAergic interneurons.1,7 MeCP2-deficient GABAergic neurons show significant deficits in their presynaptic function and γ-amino butyric acid (GABA) immunoreactivity,8 highlighting the critical role of Mecp2 in GABA synthesis in GABA-releasing neurons. However, how Mecp2 deficiency affects GABA recycling system, especially the synaptic transporters associated with GABA, has remained relatively unexamined.
GABA is a major inhibitory neurotransmitter in the nervous system, and the fundamental pathophysiology of RTT has been frequently attributed to an impaired GABAergic system.8,9 MeCP2 mutation is known to alter the function of glutamic acid decarboxylase (GAD) enzyme, which converts glutamate into GABA, which suggests a failing de novo GABA synthesis pathway in RTT.8,10,11 However, the synaptic physiology of the GABAergic system heavily depends on the neurotransmitter reuptake of GABA that significantly contributes to the GABA availability for synaptic vesicle packaging before their release.12 Thus, this study addresses two important questions: (1) does Mecp2 deficiency impair the GABA recycling system in addition to the GABA synthesis pathway as shown in past studies in a location-specific manner? and (2) do the same Mecp2 knockout (KO) brains have altered densities of GABAergic interneurons associated with such changes?
GABA transporters (GAT-1, GAT-2, GAT-3, and BGT-1) are the transmembrane proteins that perform the GABA reuptake function in GABAergic interneurons. GAT-1, expressed in both neurons and astrocytes and primarily located at the presynaptic terminals, is the major GABA reuptake transporter in the synaptic cleft.13 Vesicular GABA transporter (vGAT) is directly related to the packaging of GABA into vesicles before its synaptic release. Thus, investigating the expression level of GAT-1 and vGAT may reveal how the MeCP2 mutation alters the GABA recycling system in RTT, specifically answering the two questions addressed above.
Materials and Methods
Experimental paradigm
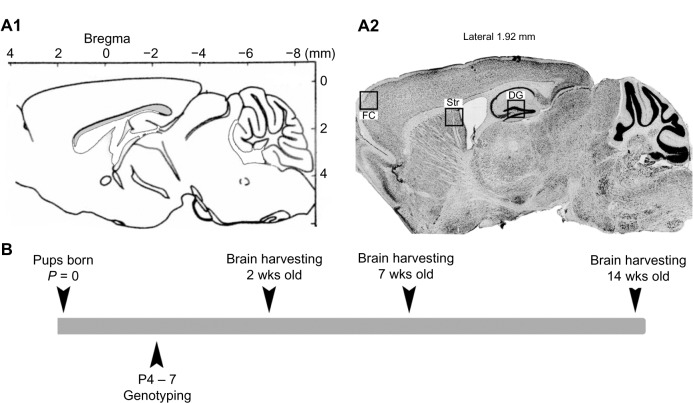
All experimental procedures were conducted in compliance with protocols approved by Johns Hopkins University Animal Care and Use Committee. Mecp2tm1.1Bird/y mice (2, 7, and 14 weeks old; Jackson Laboratory, Bar Harbor, Maine, USA) crossbred on a C57BL/6 background were used. Mecp2tm1.1Bird/y mice were generated from congenic mutant strain with a targeted insertion of LoxP site in exon 3 and 4. Three advancing ages of postnatal 2, 7, and 14 week old wild type (WT) and KO mice brains were examined to compare how the components of the GABA recycling and synthesis system are altered through the progression of RTT. A total of 23 mice were included in this study. The sample size per genotype and age were as follows: postnatal 2 (total n = 7), 7 (total n = 8), and 14 (total n = 8) weeks (Fig. 1B; Suppl. Table 1). Genotyping was done using tail-clipping samples collected between P4 and P7, processed using PCR protocols provided by Jackson Laboratories.14,15 After being anesthetized with ether at the ages of 2, 7, and 14 weeks, all animals underwent transcardiac perfusion with ice-cold phosphate buffered saline (pH = 7.4) and the brains were harvested, post-fixed in methacarn fixative, and kept frozen. Series of sagittal sections (25 μm) were obtained using a rotary microtome and one free floating section per genotype per brain was mounted on each slide for further staining. This study examined the frontal cortex (FC), where the loss of MeCP2 has been shown to elicit typical RTT behavioral symptoms in mice,16 compared to the dentate gyrus (DG) and striatum (Str).
Figure 1.
(A1) and (2) ROIs are outlined in Bregma and CV stain, respectively (FC: frontal cortex, DG: dentate gyrus, Str: Striatum). (B) A general timeline of this study.
Immunohistochemistry (IHC)
Each superfrost slide contained three sagittal sections (lateral ≈ 1.92 mm), one from each genotype (WT and KO), to provide internal control for variations between IHC runs. The slides underwent heat-induced antigen retrieval, and a 0.2% gelatin block was used to reduce nonspecific binding. Series of consecutive, sagittally cut sections were then incubated over-night with primary antibodies [rabbit anti-GAT-1 (1:500, Invitrogen) followed by mouse anti-vGAT (1:1000, Synaptic Systems); and mouse anti-GAD67 (1:1000, Chemicon International) followed by rabbit anti-MeCP2 (1:250, Santa Cruz)]. All sections were counterstained with nuclear stain Hoechst (1:2000, Invitrogen).
Imaging acquisition
All images were acquired with Axiovision Software 4.6 and Apotome® (Carl Zeiss, Jena, Germany). Images from the three regions of interest (ROI) (FC, DG, and Str), were obtained (the locations are depicted in Figure 1A2). Z-stack images of 1 μm step size for entire section for each ROI were acquired and a fused image was stored for further analysis.
Image analysis
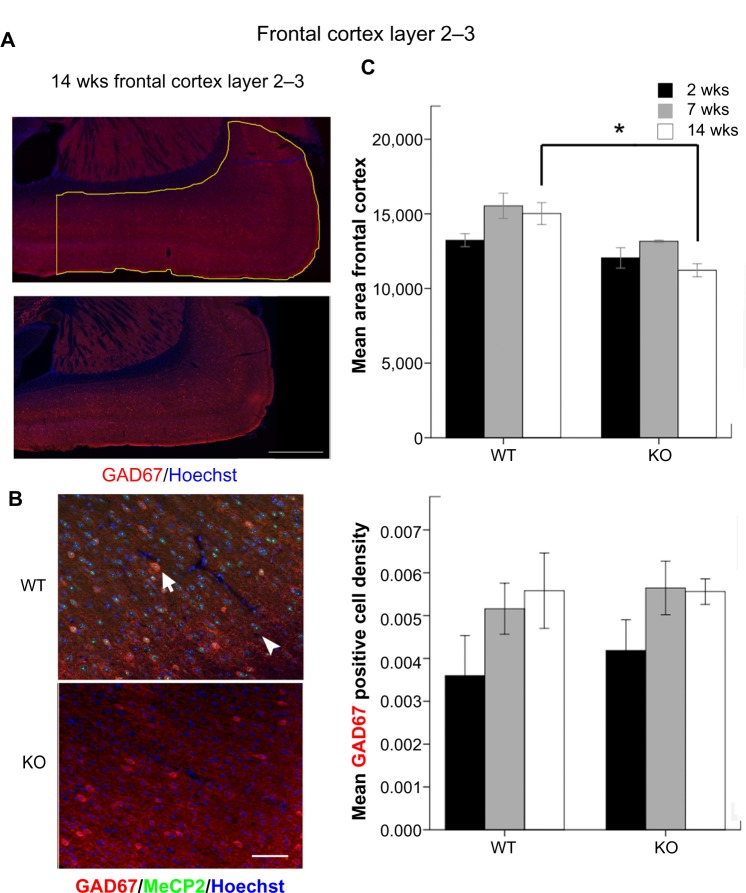
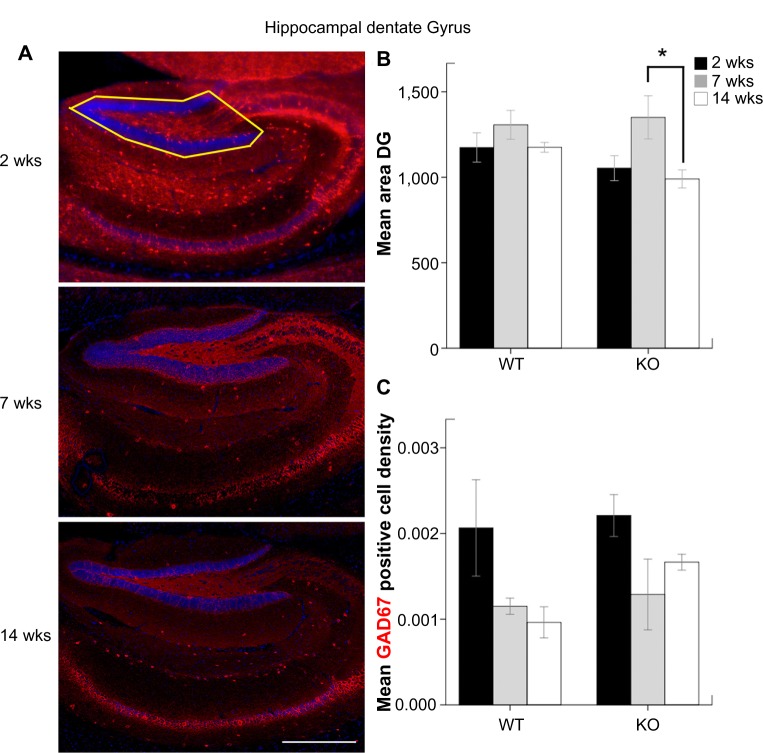
All Z-stack images were analyzed with Axiovision software. The contrast and brightness of all images were adjusted similarly, and the total counts of puncta were collected under high magnification using Axiovision analysis module (40 ×). Every acquired image (see ROI traced in Figure 1A2) was quantitated at six random sites for FC and Str (data not included for Str) and the averages of total counts were reported. DG was quantitated at nine random sampling sites (three hilus + three granule cell layer and three inner molecular layer; square area 20 × 20 um each), and the averages of total counts were reported. GAD67 and MeCP2 positivity was determined under 20 × magnification, and GAD67-positive cell-density was calculated as the total counts of GAD67-positive cells divided by the pixel area of each region quantitated (see ROIs traced in Figures 4A and 5A) and the densities were reported. All counts were conducted blinded to the genotype and age. GAT-1 and vGAT counts and GAT-1/vGAT colocalization counts were done for each sampling site within the ROI.
Figure 4.
(A) The outlined area denote the FC at 14 weeks that was used for the calculation of GAD67-positive cell densities (scale bar = 500 μm). The left vertical line was drawn with respect to anterior of lateral ventricle. (B) GAD67 and MeCP2 co-labeling in the FC at 14 weeks (scale bar = 50 μm). (C) Mean area of FC inside the outlined region in Figure 4 A. (d) Mean GAD67-positive cell densities calculated as the total counts of GAD67-positive cells in the defined regions divided by their pixel squared area.
Figure 5.
(A) The outlined area denote the hippocampal DG upper blade that was used for the calculation of GAD67-positive cell densities (scale bar = 1000 μm). (B) Mean area of hippocampal DG inside the outlined region in Figure 5A. (C) Mean GAD67-positive cell densities in DG.
Lipofuscin
Slides underwent same protocol as GAT-1/vGAT IHC runs except that no primary antibodies were added in the protocol. Lipofuscin deposits auto fluoresced under microscopic examination. The lipofuscin deposits were evaluated in the FC of all 14 weeks old WT and KO mice (n = 8). Autofluorescent lipofuscin deposits were quantified, using particle analysis in Image J (NIH, Bethesda), and the total counts were reported. Image signal thresholds were similarly adjusted to eliminate background.
Data analysis
All statistical analyses were performed with SPSS 21 (IBM). The mean IHC counts, area, and density were compared using one-way ANOVA with Bonferroni post-hoc tests and the comparisons with P-values < 0.05 were considered statistically significant.
Results
Significant location-specific impairment of GAT-1 and vGAT at temporally advancing ages (the FC vs. DG)
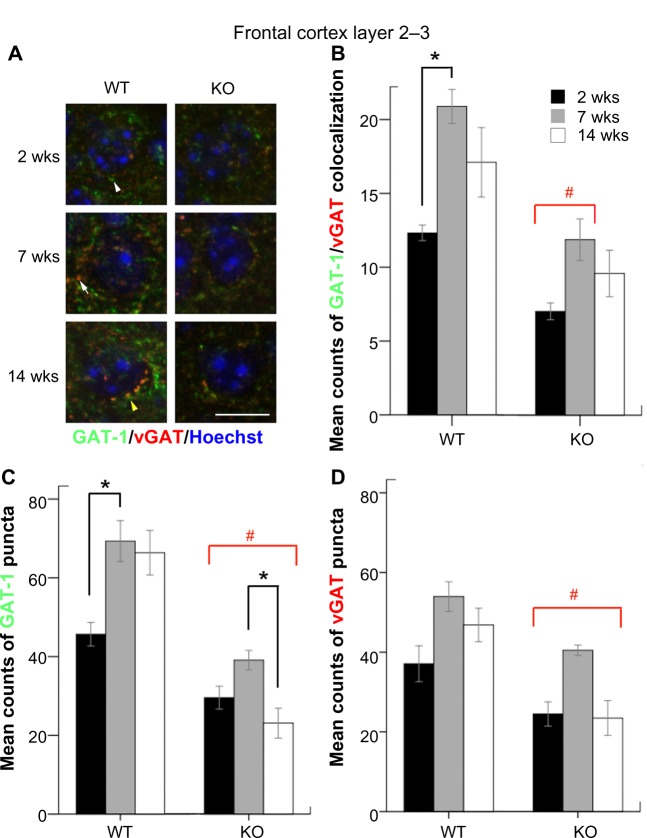
The counts of colocalized (Fig. 2A, yellow arrow) and non-colocalized GAT-1 (white arrow head) and vGAT (white arrow) puncta were quantitated in the FC layers 2–3 under high magnification. WT mice showed a robust age-dependent increase in the both the counts of GAT-1/vGAT colocalized and non-colocalized GAT-1 puncta between the ages of two and seven weeks (Fig. 2B–D, black brackets, P = 0.023 and P = 0.038). KO mice had significantly lower counts of GAT-1/vGAT colocalization at FC compared to WT mice (all P < 0.05) at all ages except KO mice at 14 weeks, which was only a trend (Fig. 2B, red brackets). Additionally, KO mice had significantly lower counts of GAT-1 puncta in FC when compared to WT mice (all P < 0.05; Figure 2C, red bracket). Also, KO mice showed a significant decrease in the counts of GAT-1 puncta between the ages of 7–14 weeks (P = 0.046). For the counts of vGAT puncta, KO mice showed significantly lower counts compared to WT mice at all ages examined (Fig. 2D, P = 0.049 for 14 weeks KO vs. WT). However, KO mice, in spite of lower counts, still retained the age-dependent trend of increasing expression of all three types of puncta over time in the FC.
Figure 2.
(A) GAT-1 and vGAT puncta located in the FC are shown under high magnification (scale bar = 10 μm). (B), (C), and (d) The mean counts of GAT-1-vGAT colocalization, GAT-1, and vGAT puncta in the FC were compared according to ages and genotypes.
Notes: # KOs of all ages but excluding 14 weeks KO in B. *a statistical significance of P < 0.05.
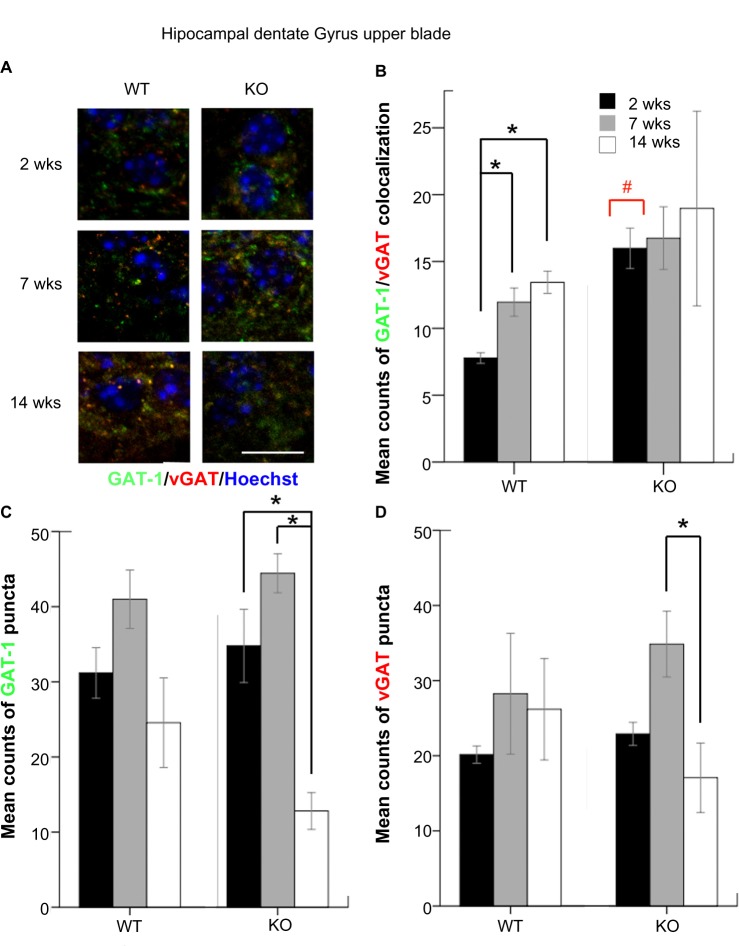
The counts of colocalized and non-colocalized GAT-1 and vGAT puncta were also quantitated in the DG (Fig. 3A). WT mice showed an age-dependent increase of colocalized puncta both at 7 and 14 weeks compared to that of 2 weeks in the DG (P = 0.032 and 0.008) similar to the FC. In the DG, KO mice had higher counts of GAT-1/vGAT colocalization at two weeks compared to WT mice (P = 0.032; Figure 3B, red bracket). At 14 weeks, KO mice showed a significant age-dependent decrease in counts of GAT-1 and vGAT compared to the seven week group of KOs (P = 0.005 and 0.021, respectively, Figure 3 and 3D, black brackets). Unlike the FC, no other between-genotype comparison was statistically significant for any of the parameters quantitated.
Figure 3.
(A) GAT-1 and vGAT puncta located at hippocampal DG are shown under high magnification (scale bar = 10 μm). (B), (C), and (d) The mean counts of GAT-1-vGAT colocalization, and GAT-1 and vGAT puncta in the hippocampal DG were compared according to ages and genotypes.
Notes: # GAT-1-vGAT colocalization of two weeks KO. *a statistical significance of P < 0.05.
Location-specific developmental profiles of GAD67-positive cell densities
Total number of GAD67-positive cells was counted in the defined region of the FC and DG (Figs. 4A and 5). Similar to previous findings in both human RTT patients17 and RTT mouse model,18 a significant reduction in the FC area in MeCP2 KO brains was observed. All GAD67-positive cells showed robust MeCP2 expression in the nuclei of WT mice as previous described,8 which was not seen in KOs (positive control). At 14 weeks, KO mice had significantly smaller area of cortices compared to WT mice (Fig. 4C, P = 0.001). In the FC, an age-dependent increase of GAD67-positive cell densities was detected in both genotypes, although none of them was statistically significant (Fig. 4D). In contrast to the significant impairments in synaptic expression of GAT-1 and vGAT reported above, GAD67-positive cell densities were not significantly altered with age in KO mice compared to WT mice.
Unlike the severe cortical atrophy detected in KOs, hippocampal DG areas were not significantly different between genotypes. DG areas in KO mice at 14 weeks were significantly lower than KO mice at 7 weeks (P = 0.036; Fig. 5B). In contrast to the age-dependent increase in GAD67-positive cells in the FC, an age-dependent decrease of GAD67-positive cell densities was detected in the DG of the same WT mice, although none of them was statistically significant (Fig. 5C).
Early cortical atrophy in KO brains may be associated with significantly increased lipofuscin deposits
The counts of lipofuscin deposits were quantitated in the FC of WT and KO mice at the age of 14 weeks. KO mice showed significantly higher counts of lipofuscin deposits compared to the WT (P = 0.035; Suppl. Figure 1B).
Discussion
Recent studies have shown that Mecp2 expression levels are 50% higher in GABAergic than non-GABAergic neurons,8 and Mecp2 mutations selectively affect the GABAergic system at specific anatomical locations like the thalamus and brainstem.7,19 In addition, a reduced presynaptic GABA quantal release was reported when Mecp2 was specifically knocked out (ie, Viaat-Cre mice) in a subset of forebrain GABAergic neurons.8 In this study, we investigated the age- and location-specific changes in the expression level of GAT-1, vGAT, and GAD67 in Mecp2 KO (Mecp2tm1.1Bird/y) brains and found significant location-specific alterations. GAT-1 and vGAT had significantly lower expression, and therefore lower colocalization of the two synaptic transporters in the frontal cortices of Mecp2 KO brains compared to the age-matched WT mice. This impairment was not detected in the DG or Str (data not shown), where the expression levels were similar to age-matched WT mice. An age-dependent increase in the densities of GAD67-positive cells was observed in the frontal cortices of both genotypes in early development that has been previously reported,20 from ages of two to seven weeks. However, the opposite trend was observed in the hippocampal DG where an age-dependent decrease in the densities of GAD67-positive cells was observed similar to previous reports.21 Additionally, at 14 weeks, Mecp2 mutant brains had higher counts of lipofuscin deposits compared to WT in the FC layer 2–3, which may indicate an accelerated aging that may correlate to the early mortality detected in the KO mice.
Developmental profile of maturation of GABAergic system cortex vs. hippocampus
The development and maturation of GABAergic system continues to post-adolescence,22,23 and the pre- and post-natal GABAergic development is still an active field of research. During development, the GABAergic interneurons proliferate, migrate, and undergo robust functional maturations.20 In rodents, this maturation has been documented as a reduced number of overall hippocampal interneurons that include parvalbumin-, calbindin-, and calretinin-positive interneurons as well as GAD67-positive interneurons with aging.21,24 Our study has similar findings in that the GAD67-positive cell-density declined with aging in DG of both WT and KO mice. This study found a common trend of increasing densities of GAD67-positive cells in the FC with aging in contrast to the hippocampus. Hence, the developmental profile of GAD67 expression in GABAergic interneurons was found to be age- and location-specific, and the Mecp2 deficiency did not significantly alter the age-dependent development of GAD67 expressing interneurons in this study.
GABAergic synapses vs. GABA reuptake dynamics
The mechanism of how Mecp2 mutation affects each molecular player of GABAergic synaptic transmission is not clearly understood. Nonetheless, the functional alterations of GABAergic system can occur by multiple mechanisms. Our IHC data showed that GAD67-positive cell densities were not significantly altered in either FC or DG in this model between KO and WT mice. In addition, the findings of this study suggest that the GABA reuptake pathway is significantly altered in the FC and fairly preserved in the DG and Str. Therefore, Mecp2 mutation altered the expression of synaptic transporters GAT-1 and vGAT in a location-specific manner. In the FC, the counts of each GAT-1 and vGAT puncta and their colocalization are significantly decreased at all ages examined in Mecp2 KO mice brains compared to WT. On the other hand, in the DG, counts of GAT-1 and vGAT puncta were similar to WT mice at 2 and 7 weeks of age and only significantly decreased at 14 weeks of age in the same KO mice. The findings of the age- and location-specific alterations of synaptic GABA transporters reported here may highlight the: (1) differential effects of the same mutation in the location-specific development of GABAergic circuits in KOs, (2) the synaptic pathology of the mutation for the model. GAT-1 is the major GABA reuptake transporter at GABAergic synapses, and is primarily expressed at the presynaptic membrane,25,26 but also in astrocytes. The location-specific modulation of astrocytes on neuronal function has also recently been shown to be age- and location-specific.27 The significantly lower expression level of GAT-1/vGAT colocalization in the FC of Mecp2 KO mice indicates a compromised GABA transporter system, implying a dysfunctional GABA recycling system associated with the Mecp2 deficiency in the model. Whether the Mecp2 deficiency directly affects the expressions and functions of synaptic transporters is not known. However, similar densities of GAD67-positive interneurons in the frontal cortices of WT and KO mice may highlight the pathophysiology to be synaptic in this model of RTT. Furthermore, the data suggest that future investigations quantitating the protein expression levels of these transporters in the model will have to be location-specific. GABAergic synapses are crucial for the integration of immature neural circuitries in early development.20 Thus, alterations in the GABA reuptake dynamics may have significant implications for understanding neurodevelopmental disorders such as RTT.
Accelerated degenerative changes associated with aging in KO
Lipofuscin, an intra-lysosomal substance with cross-linked protein residues and lipids, is a hallmark of cellular degeneration and aging.28 The increased numbers of lipofuscin deposits were detected in the FC of Mecp2 KO brains compared to that of age-matched WT brains at 14 weeks of age. This suggests that Mecp2 mutation may result in an acceleration of degenerative brain changes with aging. Similar increase in the lipofuscin deposits have been reported in RTT patients.29 However, the pathological significance of these deposits and their relation to clinical phenotypes in the animal model and RTT requires further investigation.
Supplementary Data
Supplementary Figure 1. (A) The left column shows FC sections of WT and KO mice brains at 14 weeks that had GAT-1 and vGAT staining (20 ×) (scale bar = 50 μm). The right column shows an unstained autofluorescence of the tissue from same mouse. (B) Lipofuscin deposits were counted using random sampling (P = 0.035).
Supplementary Table 1. The sample size and the main characteristics of mice studied for each age and genotype.
Acknowledgments
We are grateful to the KKI neuroscience laboratory for sharing equipment and resources. We thank Dr. Mary Blue for sharing the genotyped mouse brain sections processed in this study.
Footnotes
Author Contributions
SKK, MVJ, and SDK conceived and designed the experiments. SKK, STK, and SDK analyzed the data. SKK wrote the first draft of the manuscript. STK and SDK contributed to the writing of the manuscript. STK, SDK, and MVJ agree with manuscript results and conclusions. SKK, STK, and SDK jointly developed the structure and arguments for the paper. SKK, STK, SDK, and MVJ made critical revisions and approved final version. All authors reviewed and approved of the final manuscript.
ACADEMIC EDITOR: Alexander Rotenberg, Editor in Chief
FUNDING: We thank Kennedy Krieger Institute for funding this project through Kennedy Krieger Undergraduate Research Award program.
COMPETING INTERESTS: Author(s) disclose no potential conflicts of interest.
DISCLOSURES AND ETHICS
As a requirement of publication the authors have provided signed confirmation of their compliance with ethical and legal obligations including but not limited to compliance with ICMJE authorship and competing interests guidelines, that the article is neither under consideration for publication nor published elsewhere, of their compliance with legal and ethical guidelines concerning human and animal research participants (if applicable), and that permission has been obtained for reproduction of any copyrighted material. This article was subject to blind, independent, expert peer review. The reviewers reported no competing interests.
REFERENCES
- 1.Dolce A, Ben-Zeev B, Naidu S, Kossoff EH. Rett syndrome and epilepsy: an update for child neurologists. Pediatr Neurol. 2013;48(5):337–45. doi: 10.1016/j.pediatrneurol.2012.11.001. [DOI] [PubMed] [Google Scholar]
- 2.Chahrour M, Zoghbi HY. The story of Rett syndrome: from clinic to neurobiology. Neuron. 2007;56(3):422–37. doi: 10.1016/j.neuron.2007.10.001. [DOI] [PubMed] [Google Scholar]
- 3.Kaufmann WE, Johnston MV, Blue ME. MeCP2 expression and function during brain development: implications for Rett syndrome’s pathogenesis and clinical evolution. Brain Dev. 2005;27(suppl 1):S77–87. doi: 10.1016/j.braindev.2004.10.008. [DOI] [PubMed] [Google Scholar]
- 4.Klein ME, Lioy DT, Ma L, et al. Homeostatic regulation of MeCP2 expression by a CREB-induced microRNA. Nat Neurosci. 2007;10(12):1513–4. doi: 10.1038/nn2010. [DOI] [PubMed] [Google Scholar]
- 5.Im HI, Hollander JA, Bali P, Kenny PJ. MeCP2 controls BDNF expression and cocaine intake through homeostatic interactions with microRNA-212. Nat Neurosci. 2010;13(9):1120–7. doi: 10.1038/nn.2615. [DOI] [PMC free article] [PubMed] [Google Scholar]
- 6.Serafini G, Pompili M, Hansen KF, et al. MicroRNAs: fundamental regulators of gene expression in major affective disorders and suicidal behavior? Front Cell Neurosci. 2013;7:208. doi: 10.3389/fncel.2013.00208. [DOI] [PMC free article] [PubMed] [Google Scholar]
- 7.Medrihan L, Tantalaki E, Aramuni G, et al. Early defects of GABAergic synapses in the brain stem of a MeCP2 mouse model of Rett syndrome. J Neurophysiol. 2008;99(1):112–21. doi: 10.1152/jn.00826.2007. [DOI] [PubMed] [Google Scholar]
- 8.Chao HT, Chen H, Samaco RC, et al. Dysfunction in GABA signalling mediates autism-like stereotypies and Rett syndrome phenotypes. Nature. 2010;468(7321):263–9. doi: 10.1038/nature09582. [DOI] [PMC free article] [PubMed] [Google Scholar]
- 9.Coghlan S, Horder J, Inkster B, et al. GABA system dysfunction in autism and related disorders: from synapse to symptoms. Neurosci Biobehav Rev. 2012;36(9):2044–55. doi: 10.1016/j.neubiorev.2012.07.005. [DOI] [PMC free article] [PubMed] [Google Scholar]
- 10.Horike S, Cai S, Miyano M, Cheng JF, Kohwi-Shigematsu T. Loss of silent-chromatin looping and impaired imprinting of DLX5 in Rett syndrome. Nat Genet. 2005;37(1):31–40. doi: 10.1038/ng1491. [DOI] [PubMed] [Google Scholar]
- 11.Stuhmer T, Anderson SA, Ekker M, Rubenstein JL. Ectopic expression of the Dlx genes induces glutamic acid decarboxylase and Dlx expression. Development. 2002;129(1):245–52. doi: 10.1242/dev.129.1.245. [DOI] [PubMed] [Google Scholar]
- 12.Kersanté F, Rowley SC, Pavlov I, et al. A functional role for both GABA transporter-1 and GABA transporter-3 in the modulation of extracellular GABA and GABAergic tonic conductances in the rat hippocampus. J Physiol. 2013;591(pt 10):2429–41. doi: 10.1113/jphysiol.2012.246298. [DOI] [PMC free article] [PubMed] [Google Scholar]
- 13.Deken SL, Beckman ML, Boos L, Quick MW. Transport rates of GABA transporters: regulation by the N-terminal domain and syntaxin 1A. Nat Neurosci. 2000;3(10):998–1003. doi: 10.1038/79939. [DOI] [PubMed] [Google Scholar]
- 14.Blue ME, Kaufmann WE, Bressler J, et al. Temporal and regional alterations in NMDA receptor expression in Mecp2-null mice. Anat Rec (Hoboken) 2011;294(10):1624–34. doi: 10.1002/ar.21380. [DOI] [PMC free article] [PubMed] [Google Scholar]
- 15.Metcalf BM, Mullaney BC, Johnston MV, Blue ME. Temporal shift in methyl-CpG binding protein 2 expression in a mouse model of Rett syndrome. Neuroscience. 2006;139(4):1449–60. doi: 10.1016/j.neuroscience.2006.01.060. [DOI] [PubMed] [Google Scholar]
- 16.Gemelli T, Berton O, Nelson ED, et al. Postnatal loss of methyl-CpG binding protein 2 in the forebrain is sufficient to mediate behavioral aspects of Rett syndrome in mice. Biol Psychiatry. 2006;59(5):468–76. doi: 10.1016/j.biopsych.2005.07.025. [DOI] [PubMed] [Google Scholar]
- 17.Gibson JH, Slobedman B, NH K, et al. Downstream targets of methyl CpG binding protein 2 and their abnormal expression in the frontal cortex of the human Rett syndrome brain. BMC Neurosci. 2010;11:53. doi: 10.1186/1471-2202-11-53. [DOI] [PMC free article] [PubMed] [Google Scholar]
- 18.Jentarra GM, Olfers SL, Rice SG, et al. Abnormalities of cell packing density and dendritic complexity in the MeCP2 A140V mouse model of Rett syndrome/X-linked mental retardation. BMC Neurosci. 2010;11:9. doi: 10.1186/1471-2202-11-19. [DOI] [PMC free article] [PubMed] [Google Scholar]
- 19.Zhang ZW, Zak JD, Liu H. MeCP2 is required for normal development of GABAergic circuits in the thalamus. J Neurophysiol. 2010;103(5):2470–81. doi: 10.1152/jn.00601.2009. [DOI] [PMC free article] [PubMed] [Google Scholar]
- 20.Le MC, Monyer H. GABAergic interneurons shape the functional maturation of the cortex. Neuron. 2013;77(3):388–405. doi: 10.1016/j.neuron.2013.01.011. [DOI] [PubMed] [Google Scholar]
- 21.Shetty AK, Turner DA. Hippocampal interneurons expressing glutamic acid decarboxylase and calcium-binding proteins decrease with aging in Fischer 344 rats. J Comp Neurol. 1998;394(2):252–69. [PubMed] [Google Scholar]
- 22.Tau GZ, Peterson BS. Normal development of brain circuits. Neuropsychopharmacology. 2010;35(1):147–68. doi: 10.1038/npp.2009.115. [DOI] [PMC free article] [PubMed] [Google Scholar]
- 23.Wang DD, Kriegstein AR. Defining the role of GABA in cortical development. J Physiol. 2009;587(pt 9):1873–9. doi: 10.1113/jphysiol.2008.167635. [DOI] [PMC free article] [PubMed] [Google Scholar]
- 24.Stanley DP, Shetty AK. Aging in the rat hippocampus is associated with widespread reductions in the number of glutamate decarboxylase-67 positive interneurons but not interneuron degeneration. J Neurochem. 2004;89(1):204–16. doi: 10.1111/j.1471-4159.2004.02318.x. [DOI] [PubMed] [Google Scholar]
- 25.Bragina L, Marchionni I, Omrani A, et al. GAT-1 regulates both tonic and phasic GABA(A) receptor-mediated inhibition in the cerebral cortex. J Neurochem. 2008;105(5):1781–93. doi: 10.1111/j.1471-4159.2008.05273.x. [DOI] [PubMed] [Google Scholar]
- 26.Conti F, Melone M, Fattorini G, Bragina L, Ciappelloni S. A role for GAT-1 in presynaptic GABA homeostasis? Front Cell Neurosci. 2011;5:2. doi: 10.3389/fncel.2011.00002. [DOI] [PMC free article] [PubMed] [Google Scholar]
- 27.Lioy DT, Garg SK, Monaghan CE, et al. A role for glia in the progression of Rett’s syndrome. Nature. 2011;475(7357):497–500. doi: 10.1038/nature10214. [DOI] [PMC free article] [PubMed] [Google Scholar]
- 28.Dunlop RA, Brunk UT, Rodgers KJ. Oxidized proteins: mechanisms of removal and consequences of accumulation. IUBMB Life. 2009;61(5):522–7. doi: 10.1002/iub.189. [DOI] [PubMed] [Google Scholar]
- 29.Jellinger K, Armstrong D, Zoghbi HY, Percy AK. Neuropathology of Rett syndrome. Acta Neuropathol. 1988;76(2):142–58. doi: 10.1007/BF00688098. [DOI] [PubMed] [Google Scholar]
Associated Data
This section collects any data citations, data availability statements, or supplementary materials included in this article.
Supplementary Materials
Supplementary Figure 1. (A) The left column shows FC sections of WT and KO mice brains at 14 weeks that had GAT-1 and vGAT staining (20 ×) (scale bar = 50 μm). The right column shows an unstained autofluorescence of the tissue from same mouse. (B) Lipofuscin deposits were counted using random sampling (P = 0.035).
Supplementary Table 1. The sample size and the main characteristics of mice studied for each age and genotype.


