

Abstract
This study extends the in vitro understanding of the RBC storage lesion by serially analyzing the RBC’s magneophoretic mobility, a property dependent on the content and oxygenation or oxidation state of hemoglobin (Hb) iron, during storage. Four prestorage leukoreduced, AS-5 preserved RBC units were stored between 1–6°C for 42 days. Weekly starting on storage day 7, each unit was sampled, the aliquot divided into 3 portions and subjected to different reactions: one portion was exposed to room air to produce oxyhemoglobin (oxyHb), another portion was mixed with sodium nitrite to produce methemoglobin (metHb), while the third portion was desaturated of oxygen (deoxyhemoglobin, deoxyHb) using nitrogen gas. These portions were placed into a cell tracking velocimetry (CTV) apparatus which measured both the settling velocity (us) of the RBCs as well as their magnetically induced velocity (um). The um/us ratio depends on the oxygenation or oxidation state and quantity of iron within the RBC. RBC density was measured by percoll centrifugation. There was a significant reduction in the um/us ratio for the deoxyHb RBC portion as storage time elapsed, with a smaller but still significant reduction in the um/us ratio for the metHb portion. The average RBC density decreased very slightly during storage, as determined by percoll centrifugation technique, although the average settling velocity (another measure of cell density) seemed to fluctuate during storage. The decrease in magnetophoretic mobility of the deoxyHb portion, presented as the ratio of um/us, is explicable either by Hb’s increased affinity for oxygen during storage, or a loss of iron from the cells.
Introduction
Transfusion of red blood cells (RBCs) is a common medical procedure, with approximately 14.7 million RBC units transfused in the US in 2006 (1). Current US FDA regulations allow RBCs to be stored and transfused for up to 42 days after donation if they are maintained between 1 and 6 °C in an FDA approved additive solution (AS). Additive solutions typically provide a carbohydrate energy source for the RBCs, along with adenine and various salts (2). These FDA regulations are based on the post transfusion recovery of autologous RBCs stored in an AS, and the amount of hemolysis present at the proposed outdate of the unit; they are not based on the most fundamental functional characteristics of RBC, the ability to take up and release oxygen (3).
Numerous changes occur to the RBCs as they are stored ex vivo. These storage-induced perturbations affect virtually every aspect of the RBC including its shape and volume, rheological properties, decrease in concentration of ATP and 2,3-DPG, lipid peroxidation, protein oxidation etc., and are collectively known as the RBC storage lesion (reviewed in references (4–5)). Recently, Gelderman et al. addressed the issue of the RBC storage lesion and its potential effect on hemoglobin function by serially measuring the kinetics of oxygen uploading and offloading across the membrane of stored RBCs at weekly intervals for 6 weeks (6). In summary, this study showed that at 6 weeks of storage, the oxygen uptake (kon) and release rates (koff) were largely preserved. A slight increase in the kon rate was observed which corresponded to the known decrease in 2, 3-DPG(7); however, this increase was not dramatic. While these kinetic studies provide functional, kinetic data on the functionality of hemoglobin in stored RBCs, they do not provide a measure of the absolute amount of oxygen bound and released on a cell-by cell basis. It is this area that we will address in this study.
Theoretical Analysis
In 1936 and 1937, Linus Pauling and coworkers reported that the chemical bond between Fe and the heme group changes from an ionic bond in the deoxygenated state to a covalent bond in the oxygenated state(8–10). In the ionic state, iron (Fe2+) has unpaired electrons, which gives the deoxygenated hemoglobin paramagnetic characteristics in contrast to the diamagnetic character of the more covalent Fe bonds in oxyhemoglobin. They further noted that methemoglobin (metHb), which can be synthesized by a reaction with oxyhemoglobin and sodium nitrite, is also paramagnetic from the contribution of 5 unpaired electrons in each ionic iron (Fe3+).
The development of ultra-high power, low cost, neodymium magnets and modern computer imaging technology has facilitated the development of instruments that can track the movement, on a cell-by-cell basis, of large numbers of cells and particles, including deoxygenated, oxygenated, and metHb containing RBCs. From these measured magnetically induced velocities in a given magnetic field, the magnetic susceptibility of the cells within the field can be determined(11–13). Using an instrument referred to as cell tracking velocimetry, CTV, which incorporates all of these advancements, Zborowski et al. demonstrated a close agreement between the theoretically predicted magnetic susceptibility and experimentally determined values of RBCs containing oxygenated, deoxygenated, and met forms of hemoglobin(14). In addition to the magnetically induced velocity, it is also possible to measure the settling velocity used to validate the absolute values of field induced RBC velocity.
The magnetic force inducing the movement (velocity) of cells within the field can be expressed by:
| (1) |
where:
| (2) |
is the local magnetostatic field energy density gradient of the cell location. The magnetic susceptibility of the RBC, χ, unlike ferromagnetic materials, such as iron oxides, typically used in magnetic nano and microparticles to label cells, is due to the iron atoms in the heme group which maintains a paramagnetic character; consequently, unlike iron oxides, the linear nature of Eq. 1 is maintained over a significantly larger range of magnetic fields than the more typically used iron oxides.
An RBC suspended in a buffer solution not containing paramagnetic compounds will experience a velocity given by:
| (3) |
where χRBC and χf are the volumetric magnetic susceptibility of the RBC and suspending fluid, VRBC is the volume of the RBC, DRBC is the hydrodynamic diameter of the RBC, and η is the viscosity of the suspending fluid.
An analogous relationship can be defined for the settling velocity, us, of an RBC:
| (4) |
Dividing Eq. 3 by Eq. 4, one obtains:
| (5) |
The magnetic susceptibility of an RBC is a weighted sum of susceptibilities of its major components:
| (6) |
where φH2O, φheme, φglobin are the volume fractions of water, four heme groups, and the protein (globin) part of the hemoglobin. χH2O, χdeoxyheme, and χglobin are the volume magnetic susceptibilities of water, the four ferroheme groups in deoxyhemoglobin, and globin, respectively, and S is the oxygen saturation of hemoglobin. Each hemoglobin molecule is assumed to contain four heme groups.
As outlined above, it is important to note that the heme group is only paramagnetic in the absence of bound oxygen (deoxygenated state); correspondingly, the magnetic moment of heme is zero in the presence of bound oxygen (oxygenated state). The methemoglobin contribution to RBC magnetic susceptibility has a similar form as Eq. 6
| (7) |
where χmetheme is the magnetic susceptibility of the four heme groups in methemoglobin, and Z is the fraction of hemoglobin converted to methemoglobin.
The product of the volume fraction and volumetric magnetic susceptibility for deoxyheme, metheme, and globin, can be related to the concentration of hemoglobin in RBC, cHb (mol/m3), and the molar susceptibilities, χm of the three forms:
| (8) |
| (9) |
| (10) |
Literature reported values of the three forms of molar susceptibilities, in SI units, are: 6.395×10⁻⁷, 7.217×10⁻⁷, and = −4.754×10⁻⁷ m3/mol, for χm,deoxyheme, χm,metheme, and χm,globin, respectively. It should be noted that the reported molar susceptibility of deoxyheme or metheme is the contribution of the four heme groups together. It follows that a change in the quantity of heme or iron within each RBC could result in the change in the magnetic susceptibility value of deoxyheme or metheme. The volume fraction of cytoplasmic water in RBC is determined from the volume fraction of the hemoglobin,
| (11) |
where Vm,Hb = 0.048 m3/mol is the molar volume of hemoglobin.
By inserting terms from Eqs. 8–11 into Eq. 6 or 7 one arrives at the following function of RBC volume susceptibility as a function of the oxyhemoglobin saturation, S, or methemoglobin fraction, Z, and cellular hemoglobin concentration:
| (12) |
or
| (13) |
With respect to the mass of an RBC, it can be simplified to be the sum of the mass of water and hemoglobin contained within an RBC, since hemoglobin makes up about 97% of the dry weight of RBCs. Thus, the density of an RBC is sufficiently well approximated by:
| (14) |
where Mw,globin = 64,450 g/mol is the molecular weight of hemoglobin, and ρH2O = 103kg/m3 is the density of water. Substituting Eq. 11 into Eq. 14, one obtains RBC density as a function of hemoglobin concentration:
| (15) |
The cell suspension buffer (PBS containing 0.1% Pluronic F-68) used in this study has almost the same physico-chemical property as water: ρf ≅ ρH2O, χf ≅ χH2O. Therefore, by combining Eqs. 5, 12 or 13 with Eq. 15 and by inserting the instrument constant Sm/g = 1.427×10⁷ kg/m3 (described below), one obtains
| (16) |
or
| (17) |
The result of this analysis indicates that the ratio of the magnetically induced velocity and settling velocity only depends on its oxygen saturation or the fraction of hemoglobin converted to methemoglobin. However, this ratio also depends on the quantity of heme group or iron atom in each RBC, which here is assumed to be 4 per Hb and will be discussed later. Mathematically,
Given this mathematical analysis, we conducted a series of experiments in which we not only tested the accuracy of these relationships described above, but also investigated if there are significant changes in the RBC with respect to the ratio of um/us as the RBCs are stored for 6 weeks under routine clinical blood bank conditions.
Methods
Sample preparation
Four prestorage leukoreduced, AS-5 preserved RBC units, each collected from a different volunteer donor on the same calendar day were obtained from a local FDA licensed blood center and were stored between 1–6°C for 42 days. This protocol was approved by the University of Pittsburgh’s institutional review board. A 5 mL aliquot was removed using sterile technique weekly starting on day 7 of storage. This aliquot was divided into 3 portions designated “oxyHb RBC”, “metHb RBC” and “deoxyHb RBC”.
OxyHb RBC
To produce oxyHb RBCs, 0.1 mL of RBCs in 4.9 mL PBS were exposed to room air for approximately 10 minutes before CTV experimentation (see below). Subsequently, 1.5 × 10⁶ oxyHb RBCs were added to 4 mL PBS containing 0.1% Pluronic F-68 (Sigma-Aldrich, St Louis, MO) in preparation for CTV analysis.
MetHb RBC
A 5 mM oxidant solution was prepared by dissolving sodium nitrite (NaNO2, Sigma-Aldrich Co., Milwaukee, WI) in PBS at room temperature. 2 × 10⁶ RBCs were pelleted and resuspended in 5 mL of the 5 mM sodium nitrite solution, which was then incubated for about 1.5 hours to achieve a 100% methemoglobin oxidation. Spectrophotometry data (Table 1) validated that this method converted 100% oxyHb into metHb. After incubation, methemoglobinated RBCs were washed once and resuspended in 5 mL PBS containing 0.1% Pluronic F-68 for CTV analysis.
Table 1.
Average oxyHb content and cell density in the four donor samples and average metHb content in the metHb RBC samples treated by sodium nitrate as a function of age.
| Day | oxyHb* (%) | Density** (g/mL) | metHb* (%) |
|---|---|---|---|
| 7 | 90.2 | 1.100 | 100 |
| 14 | 91.8 | 1.100 | 100 |
| 21 | 92.9 | 1.100 | 100 |
| 28 | 93.6 | 1.100 | 100 |
| 35 | 97.1 | 1.100 | 100 |
| 42 | 99.7 | 1.095 | 100 |
Determined spectrophotometrically
Determined by percoll centrifugation
DeoxyHb RBC
A Glove-Bag™ inflatable glove chamber (Cole Parmer, Vernon Hills, IL), filled with nitrogen (Medipure™ nitrogen, concentration > 99%, Praxair, Inc., Danbury, CT) and tightly sealed was used to deoxygenate the RBCs. The nitrogen gas was humidified by bubbling through water. After passing through a 0.2 μm filter, the humidified gas entered into the glove bag through a tubing coupler, which was inserted into the gas port built into the glove bag. The actual gas flow rate into the glove bag was not measured, but the gas pressure was controlled by a N2 gas cylinder pressure regulator at approximately 50 kPa.
2 × 10⁶ RBCs in 5 mL PBS were stored in an inclined 50 mL conical tube affixed to a stirring rotator, which was kept in the N2 atmosphere for 3 hours. Meanwhile, PBS buffer in the glove bag was bubbled by N2 to achieve the deoxygenation. The conditions were selected based on prior tests leading to this experiment showing blood oxygen partial pressure, PO2, dropped to 2.3 mmHg and blood oxygen saturation, S, dropped to 3.9% (from the initial value of 99%) after 3-hr deoxygenation (by a blood gas analyzer, ABL715, Radiometer, Denmark).
OxyHb content by spectrophotometer
From each of the 4 RBC units, 50μL was removed and mixed for about 10 minutes with 4.95mL of distilled water to hemolyze the cells. The samples were then vortexed and centrifuged at 250g for 5min to pellet the cell membranes. The supernatants were then transferred to plastic cuvettes and spectrophotometric readings were taken at 560nm, 577nm, and 630nm (BD DU 730 life science UV/Vis Spectrophotometer). These absorption values were used to calculate the percentage of oxyHb in each sample(19).
Density measurements
A Stock Isotonic Percoll (SIP) solution was prepared by adding 9 parts (v/v) of percoll (GE Healthcare, Piscataway, NJ, USA) to 1 part (v/v) of 10× concentrated PBS, which is called “100% percoll”. Solutions of SIP were diluted to lower densities by adding 1× PBS. The density of a series of similarly diluted solutions (from 100% percoll to 0% percoll) was then estimated by using density marker beads (GE Healthcare, Piscataway, NJ, USA), which is a function of the percoll concentration (R2 = 0.98). Blood was loaded into tubes of diluted percoll solutions at different concentration of known density. After centrifugation, the position of the cell band in each tube was evaluated and its cell density was estimated.
Cell tracking velocimetry (CTV) analysis
CTV, an analytical technique previously developed and tested (11, 13, 20), measures both the magnetically induced and settling velocities of individual RBCs. The magnetostatic field in the region of interest is designed so that the local magnetostatic field energy density gradient, Sm = 140 × 106 TA/m2 to within 1%. Given that the gravitational acceleration constant, g, is 9.81 m/s2 the following value of the instrument constant Sm/g = 1.427×10⁷ kg/m3 is obtained and used in Eq. 5. The technique can be used to simultaneously measure the velocity of thousands of RBCs. The oxyHb RBCs and metHb RBCs were processed identically as follows: The cell suspension in a syringe was injected into the channel manually, and two valves bracketing the channel were closed to stop all bulk fluid motion. Twenty video images of each set were then recorded at a 2.0s interval.
The deoxyHb RBC sample was processed as above with a few modifications the CTV apparatus. In order to maintain the anoxic conditions, gas impermeable tubing was used to connect the borosilicate glass channel placed in the interpolar gap of magnet assembly. Two Hamilton gas-tight syringes, one with deoxygenated buffer to flush the channel, the other one for sample collection, were placed at the ends of the channel to seal the system. Deoxygenated RBCs were transferred to a 2.5mL Hamilton gas-tight syringe in the glove bag, which was then attached to the CTV injection port to replace the one with deoxygenated buffer as quickly as possible to avoid any contact with air.
Statistical analysis
Mann-Whitney Rank Sum Test was performed for statistical analysis using SigmaStat 3.5 (Systat Software, Inc., Chicago, IL, USA). P < 0.05 was considered statistically significant.
Results
Magnetically induced and settling velocities of RBCs
Aliquots from the four different donor units were analyzed weekly starting on storage day 7 in three states of oxygenation or oxidation: fully oxygenated, deoxygenated, and in the met hemoglobin state. Equipment failures on day 7 and day 35 prevented the preparation of deoxygenated RBCs at these time points, although oxygenated and met hemoglobin data were obtained. The number of individual cells for which velocity data was obtained ranged from 342 to 2258 per experiment.
As discussed above, the cell tracking velocimetry (CTV) instrument produces 2 velocities per tracked RBC: a vertical velocity associated with the sedimentation of the cells, and a perpendicular velocity in the direction of the magnetic energy density gradient which is proportionate to the cell’s magnetic susceptibility. Examples of the computer screen output of the CTV software are shown in Fig. 1A and 1B indicating the motion trajectories representative of oxyHb RBCs and metHb RBCs. Fig. 2A and B are representative dot plots of the magnetically induced velocity (um), x-axis, and gravity induced velocity (settling velocity, us), y-axis, of a sample from 1 RBC unit after 21 days of storage (this storage time was selected for this example because the um/us ratio was high and thus the separation of RBCs based on us was clearly visible). Fig. 2A compares the velocities of oxygenated Hb with the metHb form, while Fig. 2B compares the velocities of the oxygenated RBC with the deoxygenated RBC. In both cases, the metHb and the deoxyHb samples demonstrated greater velocity in the magnetic field (um) compared to the oxyHb RBCs. The RBC gravitational settling rate on Day 21 (us) did not differ depending on the hemoglobin oxygenation or oxidation state.
Figure 1.
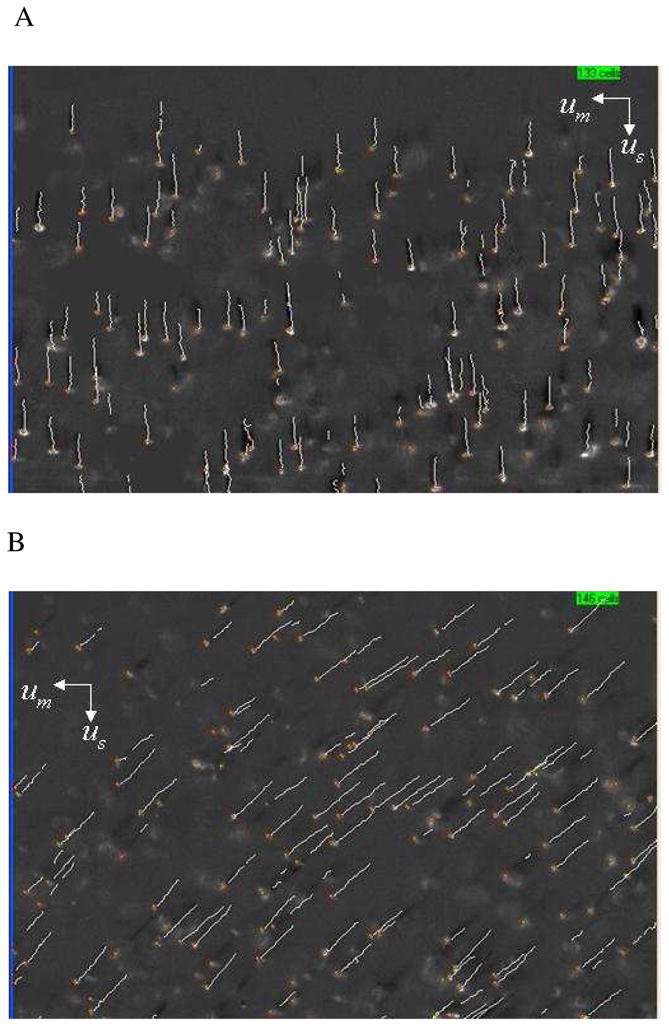
Examples of the computer screen output of the CTV software showing the motion trajectories of A) oxyHb RBCs (note the virtual absence of magnetophoretic movement along the horizontal axis) and B) metHb RBCs.
Figure 2.

Velocity distributions of RBC unit A at day 21, A) oxyHb RBC and metHb RBC; B) oxyHb RBC and deoxyHb RBC.
Density measurements of RBCs as a function of storage
As can be seen from Eq. 5, only RBC density and magnetic susceptibility are determinants of the settling and magnetic velocities, respectively. Table 1 presents the RBC density during storage, as measured by percoll centrifugation method, and calibrated with density marker beads. The density remained constant at 1.10 g/mL until the last week, where it decreased slightly to 1.095g/mL. In contrast, Fig. 3 is a plot of the mean settling velocity of the oxygenated RBC samples from all 4 donors as a function of days of storage. Settling velocity decreased slightly during first three-weeks of storage (p < 0.001, number of RBCs tested per time point: > 1000). After that, the mean settling velocity increased to slightly greater than the day 21 value (p < 0.001, number of RBCs tested per time point: > 1000). Given the nearly constant RBC density, these results suggest the variation of settling velocity is a result of changes in cell size and/or morphology.
Figure 3.

Settling velocity of the four oxyHb RBC samples at different storage time.
OxyHb content by spectrophotometer
Table 1 presents the results of the spectroscopic analysis of the fraction of hemoglobin saturated with O2 as a function of age. For all four samples the percentage of saturated hemoglobin increased from approximately 90 to 100 percent from day 7 to day 42.
um/us for oxyHb RBCs during storage
Fig. 4 presents the magnetophoretic mobility (the ratio of um/us) for the oxyHb RBCs as a function of storage time for each of the four donors. The actual data points are the average of all of the RBCs tracked per donor, the error bars are 95% confidence interval, and the solid line is a linear regression with the dotted lines corresponding to a 95% confidence band.
Figure 4.

The ratio of RBC magnetic field induced velocity to settling velocity, um/us combined with the RBC oxygen saturation of the four oxyHb RBC samples at different storage time.
This method of CTV data analysis revealed a gradual decrease in the um/us ratio for the oxyHb containing RBCs during the 6 weeks of storage (p<0.001, number of RBCs tested per time point >1,000). Aside from the quantity of heme or iron per RBC, Eq. 16 indicates that the ratio of um/us is only a function of S, the fractional saturation of Hb. The second y-axis on the right hand side of Fig. 4 is the solution to Eq. 16; thus the slight reduction in the um/us ratio for the oxyHb containing RBCs over time was paralleled by the spectrophotometric results (S), which indicated that the average oxyHb content of these RBCs increased from 90.2% to 99.7% during storage, Table 1.
um/us for metHb RBCs during storage
Fig. 5 demonstrates the changes in the ratio of um/us for the metHb RBCs during storage (p <0.0001, number of cells tested per time point > 1,000). The y-axis on the right hand side of the figure is the solution to Eq. 17, the ratio um/us as a function of Z, the fraction of Hb in the metHb form. Again, a decrease in this ratio of velocities is observed; for this condition, the decrease in approximately 20% between day 7 and day 42.
Figure 5.

As in Figure 4, combined with the RBC metHb fraction of the four metHb RBC samples at different storage time.
um/us for deoxyHb RBCs during storage
There was a significantly larger decrease, Figure 6, in um/us between days 14 and 42 (p<0.001, number of RBCs tested per time point >1,000) for the deoxyHb RBCs compared to oxyHb and metHb RBC (Figures 4 and 5). As with the previous two plots of the ratio of um/us, the right hand side of Fig. 6 is the solution of Eq. 16 for the oxygen saturation, S. The value of S based on the um/us value for deoxyHb RBC on day 14 of storage indicated that the Hb was completely desaturated. While the data point for day 7 was lost as a result of equipment failure, the fact that the cells are completely desaturated on day 14, as would be expected for fully functional RBC, a symbol was placed at the fully desaturated state in Figure 6. In contrast, by day 42 the Hb was 45% saturated with oxygen despite the identical treatment with nitrogen gas Figure 5 at each time point. Thus for the deoxyHb containing RBCs, the reduction in the um/us ratio indicated that as storage time progressed, it became more difficult to convert the Hb to deoxyHb.
Figure 6.

As in Figure 4, combined with the RBC oxygen saturation of the four deoxyHb RBC samples at different storage time. Data point at day 7 marked by “*” was an expected value, which was derived from the data point at day 14.
Discussion
In this study, the mathematical relationships that govern the motion of RBC in a magnetic energy gradient and gravity field were adapted to measure single cell magnetization as a function of the RBC oxygenation or oxidation state. The experimental studies of the motion of oxygenated, deoxygenated, and the metHb form of RBC, at various age of storage, in a nearly constant magnetic energy density gradient and gravity field were conducted using an instrument referred to as CTV. This instrument is sensitive enough to not only detect the difference between oxygenated and deoxygenated RBC, but also changes in these properties as a function of storage age. It is significant to note that both the theoretical and experimental results presented are the logical outcomes of the work of Pauling and coworkers presented in 1936 (8–9) and later work by others (10, 14).
We found a large and significant decrease in the um/us ratio for RBCs containing deoxyHb during storage, as well as a smaller but statistically significant decrease for the RBCs containing metHb. There was also a decrease in magnetic velocity for the oxyHb containing RBCs during storage, although the magnitude of the decrease was much smaller than for either the deoxyHb or metHb RBCs as expected.
There are several possible, and not mutually exclusive, explanations for the decrease in magnetic velocity of the RBCs containing the 3 different forms of Hb in this study. As the theoretical relationships predict, the magnetically induced velocity of the RBCs, the magnetophoretic mobility, depends on both the oxygenation or oxidation state of Hb iron and the quantity of Hb iron within each RBC. It is known that by day 14, 2,3-DPG is virtually absent from stored RBCs causing a decrease in the P50 value (7). This “left shift” (Hb’s increased affinity for oxygen) makes it more difficult to fully convert all the oxygenated RBC Hb into deoxyHb. In turn this would leave a higher residual proportion of oxyHb within the RBCs, and since oxyHb does not contribute to positive magnetically induced velocity, lower um/us ratios for deoxyRBC would result. The left shift would also explain the small reduction in um/us observed for the oxyHb containing RBCs. However, recently published oxygen on- and off-loading experiments during RBC storage revealed that while the kon (oxygen loading rate constant) increased slightly after day 14 as expected given the reduction in 2,3-DPG, the koff (oxygen offloading rate constant) remained stable throughout the 42 days of storage (6). The koff rate constant data suggests that in spite of the decrease in P50 that occurs during storage, deoxygenating the RBCs should not become increasingly difficult as storage time progresses. This is consistent with the spectrophotometrically determined percentage of oxyHb per RBC, which increased during our storage experiments (Table 1) in agreement with both the reported increase in the kon rate constant and Hb’s increased oxygen affinity. On the other hand, the RBC magnetophoretic mobility data in this current study suggests that the total amount of functioning Hb decreases with storage as the Hb appears less able to release its bound oxygen as storage time progresses. Further studies are required to reconcile the changes that occur in the P50 and koff during storage as it relates to the um/us ratio.
In addition to the potential for irreversible oxygenation during storage, another explanation for the decrease in the um/us ratio observed during storage for all 3 Hb oxidation species is the possibility that RBCs lose iron containing Hb during storage. As intracellular levels of ATP decline, the RBC undergoes a series of well-defined changes in shape ultimately adopting sphero-echinocyte morphology (15–16). In the process, the RBC membrane sheds vesicles which are rich in monomeric and polymeric Hb (17–18). Spectrophotometric data (Table 1) confirmed that sodium nitrite treatment converted 100% oxyHb to metHb (Z = 1 in Eq. 7) for all RBCs at different experiment date. Therefore, the observed decrease in the um/us ratio for the metHb RBCs could be explained by the likely loss of intracellular iron (Eqs. 9 and 17) by as much as 20% by day 42. All things considered, the observed decrease in the um/us ratio by day 42 could be due to a combination of outright loss of Fe through membrane vesiculation, and the gradual and irreversible oxygenation of the Hb during storage as demonstrated in Table 1. Regardless of the mechanism causing the decline in the um/us ratio during storage, the clinical significance of these findings should be elucidated in large, prospective trials where patients are randomized to receive exclusively older or fresher RBCs.
As indicated in Fig. 3, the change in the RBC settling velocity, us, was not constant during storage but seemed to decrease slightly starting on day 14 and then rise after day 28. As the us is dependent not only on the RBC density but also on RBC size, the change in us reflects the changing density and size of the RBC during storage as it adopts its terminal sphero-echinocytic morphology. Although the magnitude of the changes in RBC density as measured was quite small, the size changes that occur in the transition from discoid to sphero-echinocyte morphology could explain the change in us. Interestingly, these perturbations were not detected by the percoll centrifugation technique, which is an indication of the assay’s relative insensitivity to minor fluctuations in RBC density.
In conclusion, we have demonstrated that the single cell motion analysis in a strong magnetic field and gradient by cell tracking velocimetry (CTV) normalized by cell sedimentation velocity is sensitive enough to detect changes in the magnetophoretic mobility of RBCs during storage, and that the loss of mobility could be due to irreversible Hb oxygenation through increased oxygen affinity and the loss of Hb through membrane vesiculation.
Acknowledgments
This work has been supported by the National Institutes of Health (R01 CA62349 to M.Z.).
Nomenclature
- B
magnetic field induction (T)
- c
concentration of Hb (moles m−3)
- F
force (N)
- H
strength of applied magnetic field (A m−1)
- D
cell diameter (m)
- u
velocity (m/s)
- V
cell volume (m3)
- Vm,Hb
molar volume of hemoglobin (m3 moles−1)
- Sm
magnetic energy gradient (TA m−2)
- g
standard gravitational acceleration (9.81 m s−2)
Greek
- μ0
magnetic permeability of a vacuum (4π × 10−7 T m A−1)
- χ
volumetric magnetic susceptibility (−)
- χm
molar magnetic susceptibility (m3 moles−1)
- χH20
volumetric magnetic susceptibility of water (−9.04×10⁻⁶, SI),
References
- 1.US Department of Health and Human Services. The 2007 national blood collection and utilization survey. DHHS; Washington, DC: 2009. [Google Scholar]
- 2.Brecher ME. Technical Manual. 16 AABB; Bethesda, MD: 2008. [Google Scholar]
- 3.Dzik W. Fresh blood for everyone? Balancing availability and quality of stored RBCs. Transfus Med. 2008;18(4):260–265. doi: 10.1111/j.1365-3148.2008.00870.x. [DOI] [PubMed] [Google Scholar]
- 4.Triulzi DJ, Yazer MH. Clinical studies of the effect of blood storage on patient outcomes. Transfus Apher Sci. 2010;43(1):95–106. doi: 10.1016/j.transci.2010.05.013. [DOI] [PubMed] [Google Scholar]
- 5.Hess JR. Red cell changes during storage. Transfus Apher Sci. 2010;43(1):51–59. doi: 10.1016/j.transci.2010.05.009. [DOI] [PubMed] [Google Scholar]
- 6.Gelderman MP, et al. Serial oxygen equilibrium and kinetic measurements during RBC storage. Transfus Med. 2010;20(5):341–345. doi: 10.1111/j.1365-3148.2010.01016.x. [DOI] [PubMed] [Google Scholar]
- 7.Bennett-Guerrero E, et al. Evolution of adverse changes in stored RBCs. Proc Natl Acad Sci U S A. 2007;104(43):17063–17068. doi: 10.1073/pnas.0708160104. [DOI] [PMC free article] [PubMed] [Google Scholar]
- 8.Pauling L, Coryell CD. The magnetic properties and structure of the hemochromogens and related substances. Proc Natl Acad Sci U S A. 1936;22(3):159–163. doi: 10.1073/pnas.22.3.159. [DOI] [PMC free article] [PubMed] [Google Scholar]
- 9.Pauling L, Coryell CD. The magnetic properties and structure of hemoglobin, oxyhemoglobin and carbonmonoxyhemoglobin. Proc Natl Acad Sci U S A. 1936;22:210–216. doi: 10.1073/pnas.22.4.210. [DOI] [PMC free article] [PubMed] [Google Scholar]
- 10.Coryell CD, Stitt F, Pauling L. The Magnetic Properties and Structure of Ferrihemoglobin (Methemoglobin) and Some of its Compounds. J Am Chem Soc. 1937;59(4):633–642. [Google Scholar]
- 11.Chalmers J, et al. An instrument to determine the magnetophoretic mobility of labeled, biological cells and paramagnetic particles. J Magn Magn Mater. 1999;194(1):231–241. [Google Scholar]
- 12.Chalmers JJ, et al. Quantification of cellular properties from external fields and resulting induced velocity: cellular hydrodynamic diameter. Biotechnol Bioeng. 1999;64(5):509–518. doi: 10.1002/(sici)1097-0290(19990905)64:5<509::aid-bit1>3.0.co;2-z. [DOI] [PubMed] [Google Scholar]
- 13.Nakamura M, Zborowski M, Lasky L, Margel S, Chalmers J. Theoretical and experimental analysis of the accuracy and reproducibility of cell tracking velocimetry. Exp Fluids. 2001;30(4):371–380. [Google Scholar]
- 14.Zborowski M, et al. Red blood cell magnetophoresis. Biophys J. 2003;84(4):2638–2645. doi: 10.1016/S0006-3495(03)75069-3. [DOI] [PMC free article] [PubMed] [Google Scholar]
- 15.Wolfe LC. The membrane and the lesions of storage in preserved red cells. Transfusion. 1985;25(3):185–203. doi: 10.1046/j.1537-2995.1985.25385219897.x. [DOI] [PubMed] [Google Scholar]
- 16.Berezina TL, et al. Influence of storage on red blood cell rheological properties. J Surg Res. 2002;102(1):6–12. doi: 10.1006/jsre.2001.6306. [DOI] [PubMed] [Google Scholar]
- 17.Bosman GJ, et al. The proteome of red cell membranes and vesicles during storage in blood bank conditions. Transfusion. 2008;48(5):827–835. doi: 10.1111/j.1537-2995.2007.01630.x. [DOI] [PubMed] [Google Scholar]
- 18.Kriebardis AG, et al. RBC-derived vesicles during storage: ultrastructure, protein composition, oxidation, and signaling components. Transfusion. 2008;48(9):1943–1953. doi: 10.1111/j.1537-2995.2008.01794.x. [DOI] [PubMed] [Google Scholar]
- 19.Winterbourn CC. Oxidative reactions of hemoglobin. Methods Enzymol. 1990;186:265–272. doi: 10.1016/0076-6879(90)86118-f. [DOI] [PubMed] [Google Scholar]
- 20.Jin X, et al. Differences in magnetically induced motion of diamagnetic, paramagnetic, and superparamagnetic microparticles detected by cell tracking velocimetry. Analyst. 2008;133(12):1767–1775. doi: 10.1039/b802113a. [DOI] [PMC free article] [PubMed] [Google Scholar]