

Abstract
As the result of early specification processes, sea urchin embryos eventually form various mesodermal cell lineages and a gut consisting of fore-, mid- and hindgut. The progression of specification as well as the overall spatial organization of the organism is encoded in its gene regulatory networks (GRNs). We have analyzed the GRN driving endoderm specification up to the onset of gastrulation and present in this paper the mechanisms which determine this process up to mid-blastula stage. At this stage, the embryo consists of two separate lineages of endoderm precursor cells with distinct regulatory states. One of these lineages, the veg2 cell lineage, gives rise to endoderm and mesoderm cell types. The separation of these cell fates is initiated by the spatially confined activation of the mesoderm GRN superimposed on a generally activated endoderm GRN within veg2 descendants. Here we integrate the architecture of regulatory interactions with the spatial restriction of regulatory gene expression to model the logic control of endoderm development.
Keywords: Gene regulatory network, Endoderm, Mesoderm, Embryonic specification
Introduction
Gene regulatory networks (GRNs) control the spatial organization of the embryo. GRN models describe the regulatory interactions between transcription factors and signaling molecules which drive the partitioning of the embryo into compartments of specific regulatory state, and the progression of specification within these compartments. The architecture of these regulatory interactions is encoded in cis-regulatory control genomic sequence. The sea urchin embryo endomesoderm comprises several spatial compartments, and recent work has elaborated GRN models to provide a causal explanation for the developmental progression of regulatory states in these compartments. That portion of the GRN which concerns the specification of the endoderm has, until the present work, remained the most incomplete. We have learned a great deal since the initial attempts to formalize GRN relationships within the endomesoderm (Davidson et al., 2002a, b). Only recently has the intrinsically complex developmental biology of the endoderm in this embryo been clarified. The sea urchin genome was sequenced (The Sea Urchin Genome Sequencing Consortium, Sodergren et al., 2006), permitting the annotation of most of the regulatory genes encoded in the genome, and at least preliminary assessment of their spatial and temporal expression (Howard-Ashby et al., 2006a,b,c; Materna et al., 2006; Rizzo et al., 2006). Cis-regulatory studies on many of the relevant genes have now been carried out as well. This paper reports the results of a system level, total analysis of regulatory transactions in the developing endoderm based on perturbation and gene expression measurements. We have generated a new set of GRN models for the pregastrular embryonic endoderm, which incorporates all previously available information. All newly identified regulatory genes expressed specifically up to the onset of gastrulation are now incorporated in the endoderm GRN model. Several prior proposed linkages have been revised and evidence from cis-regulatory studies has been integrated. Endoderm specification is a spatially dynamic process, and we have emphasized the spatial distribution of regulatory gene expression so that the GRN model satisfactorily explains the progressive spatial organization of the embryo. Here we model the endoderm GRN as it achieves the climax of its initial specification phase at 18 h post-fertilization (hatched blastula stage). The subsequent regulatory interrelationships and extension of the GRN model up to the period just prior to gastrulation are to be presented elsewhere in a following paper.
Cell lineages and fate maps for the endomesoderm provide a framework for the organization of the underlying GRN models. Four distinct embryonic lineages produce the entire endomesoderm, all deriving from the vegetal half of the embryo. The 4th cleavage micromeres produce four “small micromere” daughter cells which reside at the polar center of the vegetal plate, and after gastrulation their descendants contribute about half the cells of the pluripotent coelomic pouches (Pehrson and Cohen, 1986; Cameron et al., 1991). Their “large micromere” sister cells are the founders of an exclusively skeletogenic lineage, which after gastrulation generates the characteristic euechinoid embryonic skeleton. The skeletogenic lineage contributes non-autonomously to endoderm and non-skeletogenic mesoderm specification, providing three essential signaling inputs to the immediately adjacent precursor cells. These are an activin related “early signal” (Ransick and Davidson, 1993, 1995; Oliveri et al., 2003; Beane et al., 2006; Sethi et al., 2009); a Delta signal (Sherwood and McClay, 1999; Sweet et al., 1999, 2002; Ransick and Davidson, 2006); and a Wnt8 signal (Wikramanayake et al., 2004; Minokawa et al., 2005; Smith et al., 2007). The expression of these signaling ligands is specifically explained by regulatory relationships in the skeletogenic micromere GRN (Oliveri et al., 2008). The two other endomesoderm lineages are veg1 and veg2, which segregate from one another at 6th cleavage (~7 h post-fertilization; hpf) (Hoerstadius, 1939). This paper concerns events occurring in the veg2 and veg1 lineage compartments, which together constitute the future endoderm, though neither produces endoderm exclusively (Cameron et al., 1991). When they are born, the circular 8-cell veg2 tier abuts the polar micromere-derived cells, and the 8-cell veg1 tier overlies the veg2 tier. At blastula stage, viewed from the vegetal pole of the embryo, the cells of the four lineages form four concentric domains within the vegetal plate. At the center are the small micromere descendants, surrounding them are the skeletogenic cells, and abutting them are the veg2 and then more peripherally the veg1 rings of cells. When gastrulation starts, at around 30 hpf, veg2 and veg1 cells have undergone four additional cleavages, and each lineage consists of roughly 120 cells.
Very briefly, some important background facts relevant to endoderm specification in veg2 and veg1 are as follows. The veg2 lineage produces various non-skeletogenic mesodermal cell types in addition to endoderm. The distinction between endoderm and mesoderm specification in veg2 depends on the Delta/Notch signaling system. Delta ligand expressed on the skeletogenic micromere lineage activates Notch receptor in adjacent veg2-derived cells, thereby initiating mesoderm specification (op. cit. above). As the cells of the veg2 lineage proliferate, only the cells directly adjacent to the micromere lineage become mesoderm, whereas more distal veg2 derived cells which are thus not exposed to the Delta/Notch signaling input become endoderm. Both the micromere and veg2 cell lineages have high levels of nuclearized β-catenin, triggered initially by a localized maternal cytoplasmic system (Logan et al., 1999; Weitzel et al., 2004). Since the wnt8 gene responds to Tcf/β-catenin, the most likely consequence is to intensify nuclearization of b-catenin in these cells, assuming that Wnt8 acts via the canonical wnt pathway (Wikramanayake et al., 2004; Minokawa et al., 2005; Smith et al., 2007). The result is activation of the Tcf transcription factor. Tcf acts as an exclusive switch, repressing activity of target genes by means of its complex with the dominant Groucho repressor in cells not exposed to a Wnt ligand (Range et al., 2005), while permitting and to some extent promoting expression of genes where Groucho is replaced by β-catenin. The recently discovered blimp1-wnt8 expanding torus subcircuit (Smith et al., 2007) directly impacts early endoderm specification, by causing strong wnt8 expression in veg2 cells. This is likely to cause enhanced positive Tcf input in these cells because of the intercellular feedback circuitry (community effect; Bolouri and Davidson, 2009) among wnt8 expressing veg2 cells (Minokawa et al., 2005). Much less is known about the specification of veg1-derived cells. The boundary between endoderm and ectoderm forms within the veg1 lineage domain, at the periphery of the vegetal plate, but this decision does not occur before mesenchyme blastula stage. Likewise, endoderm specification in the veg1 lineage occurs later than corresponding events in veg2 descendants. For instance, expression of the endoderm differentiation gene endo16 in veg1 cells is detected only after the onset of gastrulation, some hours after the same gene is turned on in veg2 derived cells (Ransick and Davidson, 1998). A very important point is that lineage origin determines the eventual spatial and functional contribution of endodermal cells to the larval gut. Thus lineage tracing has shown that endoderm cells deriving from veg2 cells mainly contribute to the fore- and midgut (Ransick and Davidson, 1998). Cells of the veg1 lineage on the other hand end up within the posterior compartments of the gut, the mid- and hindgut (Logan and McClay, 1997; Ransick and Davidson, 1998).
For orientation, an overview of the specification processes in the endomesoderm to the end of the mesenchyme blastula stage (~27 hpf) is shown in the Process Diagram in Fig. 1, though this paper considers only the events which occur up to the 18 hpf hatched blastula stage. Fig. 1 shows that five distinct regulatory domains have been established by the late blastula stage (the small micromere set-aside lineage is omitted, since it does not participate in endomesoderm specification). Domain I consists of the skeletogenic micromere lineage. When Delta is first expressed in these cells, there is only one ring of veg2 cells present, all of which are in contact with the signaling ligand. In consequence, all veg2 cells express glial cells missing (gcm), a direct Notch target gene, which is required for pigment cell specification (Ransick and Davidson, 2006). At the same time, these same cells activate expression of endoderm regulatory genes e.g., foxa, blimp1b and hox11/13b (Arenas-Mena et al., 2006; Smith et al., 2007). Thus all descendants of veg2 cells initially co-express factors involved in endoderm and mesoderm specification (Fig. 1, green box). However, expression of the mesoderm regulatory genes is maintained only in the more centrally located veg2 cells, initially as a function of Delta/Notch signaling. The endoderm regulatory genes are transcribed in all veg2 cells until these genes become repressed in mesoderm precursor cells between 18 and 21 hpf, completely separating endoderm and mesoderm cell fates (Fig. 1, domains II and III). At the same time, mesoderm precursor cells become subdivided into domains of different regulatory state, initiating the distinct specification of different mesodermal cell types; but this lies outside the focus of the present study. Several regulatory genes of the endoderm GRN are activated in veg1 only at 21–24 hpf, and this probably marks the time when endoderm and ectoderm cell fates are discriminated (Fig. 1, domains IV and V). Here we focus on the regulatory interactions in veg2 endoderm by 18 hpf, and on the initiation of the veg1 endoderm regulatory state.
Fig. 1.

Process diagram of endomesoderm development in sea urchin embryos. The specification processes which lead to the formation of mesodermal and endodermal cells are shown in respect to time (vertical axis) and radial position (horizontal axis), where the left ordinate intercept represent the vegetal center and right corresponds to distal. The three cell lineages in which these processes occur are the skeletogenic mesoderm cell lineage and the macromere-derived veg2 and veg1 cells. A common endomesoderm regulatory state (green) is active in veg2-derived cells before the separation of endodermal and mesodermal cell fates, which occurs after the hatched blastula stage. A Delta/Notch signaling interaction leads to the activation of mesodermal specification in cells adjacent to skeletogenic cells. Veg2-derived cells located more distantly to skeletogenic cells acquire an endodermal cell fate (yellow). A second set of endoderm cells derives from veg1 cells (light red). Endoderm specification occurs later in the veg1 lineage, and the initiation of this process in veg1 is dependent on specification events in veg2 cells. Signaling interactions are shown by red arrows labeled with the responsible signaling molecule, if known.
Materials and methods
Whole mount in situ hybridization (WMISH)
Probe templates were generated using the primers and cDNA clones listed in Table S1. Antisense RNA probes labeled with digoxigenin (DIG) or fluorescein (FL) were generated using the corresponding RNA labeling mix (Roche). WMISHs were performed according to standard methods (Revilla-i-Domingo et al., 2007). Briefly, embryos were fixed in 4% paraformaldehyde, 32.5% sea water, 32.5 mM maleic acid (pH7) and 162.5 mM NaCl at 4 °C over night. Hybridizations were performed over night at 65 °C using a probe concentration of 1 ng/μl. For single WMISH, probes were detected using anti-DIG Fab fragments conjugated to alkaline phosphatase (1/1000 dilution) and NBT/BCIP. Hybridizations for double WMISH were performed according to a protocol described previously (Minokawa et al., 2005). Probes were detected by POD-conjugated anti-DIG or anti-Fluorescein Fab fragments (1/1000 dilution) using substrates provided in the TSA Plus Cyanine3/Fluorescein System (Perkin Elmer). Staining occurred at a substrate dilution of 1:400 in 1× Plus Amplification Diluent or in TBS/0.005% H2O2.
MASO injection and RNA isolation
MASOs were provided by GeneTools and sequences are given in Table S2. MASOs were microinjected into fertilized eggs at 100–400 μM in 0.12M KCl, as described (Rast et al., 2000). Randomized control MASOs (N25) were injected at same or higher concentrations as gene-specific MASOs. Experiments were performed on 2–4 independent embryonic batches. Embryos were cultured at 15 °C and about 100–200 embryos per sample were lysed at 12, 15 or 18 hpf. Total RNA was isolated using the RNeasy Micro Kit (Qiagen).
QPCR analysis
cDNA was synthesized using the iScript cDNA synthesis kit (BioRad). QPCRs were performed with the iTaq SYBR green supermix (BioRad) on cDNA equivalent to 0.6 embryos in a 10 μl reaction. Gene expression levels were normalized to levels of ubiquitin expression, using a reference value of 220,000 ubiquitin copies per embryo (Nemer et al., 1991). Changes in expression levels were determined by comparing normalized expression levels in MASO injected embryos to uninjected control embryos (Materna and Oliveri, 2008). Changes in gene expression levels of more than 2-fold were considered significant, to include regulatory interactions occurring only in a subset of cells. Thus MASO injection might cause loss of target gene expression in half of the cells (e.g., in mesoderm vs. endoderm precursor cells) or the expansion of gene expression to another cell lineage (veg1 vs. veg2 cell lineage). In both cases, maximal changes in expression levels might not exceed a factor of 2.
NanoString nCounter system
Total RNA was used to quantify the expression levels of 180 selected genes using the nCounter system (Geiss et al., 2008; Su et al., 2009). The code set used in this study contained probes specific for 144 transcription factors, 20 signaling molecules and a few differentiation genes expressed at embryonic stages. Each gene is detected by two oligos consisting of 35–50 nucleotides of complementary sequence. One of these probes contains a biotin tag used for purification of probe:RNA hybrids, whereas the other probe is labeled with specific codes of fluorophores. 100–200 ng of total RNA was hybridized to the probes at 65 °C overnight, according to the manufacturer’s protocol. Subsequent washing steps occurred on the Prep Station. Imaging of fluorescent probes and data collection were performed using the Digital Analyzer. Raw counts for each gene were normalized to the total number of counts measured in the corresponding RNA sample. Gene expression levels in MASO-injected embryos were compared to levels in uninjected control embryos and changes of more than a factor of two were considered significant. Low abundance transcripts (e.g., <200 counts) were generally prone to higher variation and repeated experiments on independent embryonic batches were performed to reduce false-positive results.
Results
Two exclusive domains of transcription factor gene expression in endoderm precursor cells
Previous studies have identified a number of transcription factors expressed specifically in the embryonic endoderm and its precursors (Howard et al., 2001; Davidson et al., 2002a,b; Howard-Ashby et al., 2006a,b; Materna et al., 2006; Oliveri et al., 2006; Rizzo et al., 2006). However, most of these factors are expressed at developmental stages later than those considered in the present study. A total of nine transcription factors are specifically expressed in endoderm precursor cells before the 18 hpf hatched blastula stage. Even though the presence of additional specifically expressed transcription factors cannot be excluded, it is assumed that these nine regulatory factors represent the majority of the early endoderm regulatory tool kit.
Direct regulatory interactions between transcription factor and target gene requires their expression in the same cells. Most regulatory genes show highly dynamic expression patterns early in development, which complicates the comparison of expression patterns obtained from independent experiments. We therefore analyzed carefully the spatial expression pattern of a core set of transcription factors known to be involved in endoderm specification. Observations on different genes were made in the same batches of embryos at 18 hpf by WMISH (Fig. 2A). Number and position of gene expressing cells relative to the coordinates of the embryo were determined by counting stained cells as well as the unstained cells located in the polar center of the stained rings of cells (Fig. 2B). foxA, blimp1b, hox11/13b and brachyury showed very similar expression patterns. Gene expression was not detectable in 20–28 cells (on average) located at the vegetal pole, which approximates the number of micromere descendants plus a few of the veg2-derived cells at 8th cleavage stage. These cells were surrounded by 33–39 cells expressing the transcripts. A similar number of cells was also stained when using a probe specific for even-skipped (eve); however the position of these cells within the embryo was strikingly different. Eve expressing cells were located at the periphery of the vegetal plate and cell numbers indicated little overlap with the domain of expression of the other four factors. Roughly 50 vegetal cells showed no detectable eve expression. This is the total of micromere and veg2 cell descendants at this stage, suggesting that eve is exclusively expressed in cells of the veg1 lineage. Since there are 8 veg2, and 8 veg1 cells at 6th cleavage, the vegetal plate cells are in their 8th cleavage cycle at 18 hpf.
Fig. 2.

Spatial expression of transcription factors involved in the endoderm network. Spatial distribution of transcription factor gene expression was analyzed by WMISH on embryos at hatched blastula stage (18 hpf). (A) First panel shows a schematic diagram of an embryo at hatched blastula stage from vegetal view. The two cell lineages giving rise to endodermal cells are shown in green (veg2 lineage) and orange (veg1 lineage). Other panels show embryos from the vegetal view stained by WMISH to detect the expression patterns of foxA, blimp1b, hox11/13b, brachyury (bra) and eve transcripts. (B) Embryos stained by WMISH were used to count the number of unstained vegetal cells and of surrounding stained cells. All transcripts are detected in a similar number of cells, however eve is expressed at a different location relative to the vegetal pole, as indicated by a significant difference in the number of unstained vegetal cells. Contribution of cell lineages in a 8th cleavage stage embryos are shown above the diagram; sMi: small micromeres; Skel.M.: Skeletogenic micromeres; Veg2: Veg2 descendants; Veg1: Veg1 descendants. Shown are average and standard deviation of counts on 7–9 embryos.
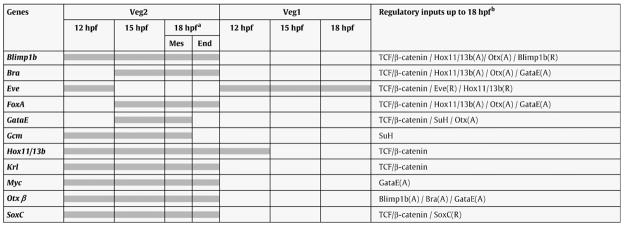
To examine the origins of these expression patterns, we looked at earlier embryos. The spatial patterns of these transcripts at earlier embryonic stages appear to be as expected from the 18 hpf observations just recounted (Fig. S1A), though the earlier patterns of expression have not been studied in nearly the detail of the 18 hpf patterns. At 12 hpf eve and hox11/13b appear to be expressed in tiers of cells encompassing veg2- and most likely also veg1-derived cells, though this remains tentative pending cell counts. By 15 hpf eve expression, however, is clearly restricted to the veg1 lineage, whereas hox11/13b is expressed in veg2 descendants together with blimp1b and foxA. At 18 hpf the residual regulatory genes contributing to endoderm specification, krl/z13, otx-β, soxc and myc, are also expressed in veg2 descendants (Howard et al., 2001; Yuh et al., 2002; Howard-Ashby et al., 2006a). The expression patterns of krl/z13 and myc are similar to hox11/13b at 18 hpf (Fig. S1B/C). In summary, as shown in Table 1, all but one of the regulatory genes involved in endoderm specification are expressed in veg2 derived cells at hatched blastula stage. The exception is eve, which by then is expressed only in veg1-derived cells. The low number of regulatory genes specifically expressed in the veg1 lineage is consistent with previous results showing that the progression of specification in these cells occurs after hatched blastula stage (Ransick and Davidson, 1998).
Table 1.
Summary of regulatory gene expression patterns and regulatory inputs up to 18 hpf.
|
All regulatory genes expressed at 18 hpf with endoderm-specific expression at later stages are shown, in addition to gcm and gataE, which are expressed in mesoderm precursors at 18 hpf.
Different regulatory states are present in mesoderm (Mes) and endoderm precursor cells (End).
Transcription factors activating (A) or repressing (R) the expression of these genes are summarized in the right column.
Simultaneous activation of mesoderm and endoderm GRNs
The number of cells expressing regulatory genes which function in the specification of endoderm suggests that the endoderm GRN is activated in the entire veg2 lineage. However, veg2 cells are also the progenitors of mesodermal cell types, and the expression of regulatory genes contributing to mesoderm specification starts in veg2 cells as soon as Delta ligand is expressed on micromere descendants, at 7th cleavage stage. The transcription factor Gcm is a direct target gene of the Delta/Notch signaling pathway and is required for the specification of pigment cells (Ransick and Davidson, 2006). gcm is initially expressed in all 16 veg2 descendants. After 8th cleavage, the veg2 lineage consists of two tiers of 16 cells, of which only the inner ring is in direct contact with micromere descendants. To analyze how endodermal and mesodermal cell fates become resolved at this stage, we compared the expression patterns of regulatory genes involved in both specification processes by double fluorescent WMISH (Fig. 3). As expected, the expression patterns observed for hox11/13b and foxA were largely overlapping. However, Fig. 3 shows that at 16.5 hpf gcm expression was observed only in a subset of veg2 descendants, the single ring of cells which are located adjacent to the micromere lineage (see also Ransick et al., 2002). Note that at 15 hpf, both rings are still expressing gcm (Ransick and Davidson, 2006); thus the Su(h) input from N signaling lasts a few hours but then, in the absence of further contact with the Delta ligand, gcm expression dies out, in accord with the cis-regulatory study (op. cit.). In this inner tier of veg2 derived cells, expression of gcm overlaps with hox11/13b and foxA. Thus, as summarized in Fig. 4, veg2 cells located peripheral to the Delta expressing micromere lineage no longer express gcm and continue to express regulatory genes involved in endoderm specification only, while the endoderm GRN on the other hand is activated as a default program in the entire veg2 lineage.
Fig. 3.

Relative spatial distribution of regulatory factors involved in endoderm and mesoderm specification. (A) Double fluorescent WMISH was performed on hatching blastula stage embryos (16.5 hpf). All embryos are shown from vegetal view. Results indicate a strong overlap between the expression patterns of foxA and hox11/13b. Gcm, which is involved in mesoderm specification, is expressed in a subset of veg2-derived cells, which are also expressing hox11/13b and foxA. Most part of the eve expression domain is located peripheral to the foxA expression domain with only few cells expressing both regulatory factors. (B) Cell counts on indicated domains of gene expression, made on magnified hard copy images.
Fig. 4.

Schematic representation of the spatial domains in which indicated GRNs are active. (A) At 7th cleavage stage, 16 veg2 descendants (green) and 16 veg1 descendants (orange) surround the large micromere lineage (light purple) at the vegetal pole. As the Fig. 2 cell counts show, the number of cells in veg2 expressing foxa is close to the 8th cleavage total of 32 (B). The following cleavage generates two tiers of 16 cells in the veg2 and veg1 lineages. As a result, the outer tier of veg2 derived cells becomes separated from the Delta signaling source and regulatory factors in the mesoderm GRN are no longer expressed. In these cells, only the endoderm GRN is active (yellow). The mesoderm GRN remains active in veg2 descendants adjacent to the micromere lineage and these cells therefore co-express regulatory genes involved in both GRNs (green). The veg1 lineage (orange) is marked by the expression of eve. Separate schemes of spatial patterns are shown for (C) veg1, (D) mesoderm and (E) endoderm regulatory states. Differences in schematic cell sizes are only due to the geometry of the scheme and do not reflect actual differences in cell sizes.
Initiation of regulatory gene expression in veg2 descendants
The regulatory factor which is responsible for initiating the expression of regulatory genes in endoderm precursor cells is Tcf, together with the co-activator β-catenin (Davidson et al., 2002b, b). A summary of prior and new evidence supporting this simplifying generalization is as follows: (i), Availability: at 7th cleavage, levels of nuclear β-catenin are high in skeletogenic precursor cells and veg2 descendants (Logan et al., 1999; Weitzel et al., 2004). Thus the Tcf/β-catenin input is specifically available at the stage when the first transcription factors start being specifically expressed in the veg2 lineage. (ii), Cis-regulatory evidence: one of these regulatory genes is blimp1b, whose expression is driven by Tcf binding sites encoded in its cis-regulatory region (Smith et al., 2007). A direct cis-regulatory input has also been demonstrated in the eve gene, confirming an earlier prediction (Ransick et al., 2002; Smith et al., 2008). (iii) Additional data: several unpublished cis-regulatory studies furthermore show that hox11/13b, foxA and brachyury are also all under direct Tcf control (C. Theodoris, S. Ben-Tabou de-Leon, R.A. Cameron and E.H.D., unpublished data). Furthermore, krl/z13 is likely to be a direct target gene of Tcf/β–catenin as well, since its expression is stated to respond to modulations of β-catenin activity in a manner independent of protein synthesis (Howard et al., 2001). The expression pattern of soxC is very similar to that of blimp1b and krl/z13, and it may also be the outcome of Tcf transcriptional control (Howard-Ashby et al., 2006a; Oliveri et al., 2008).
Mutation of Tcf binding sites in the cis-regulatory regions of hox11/13b, foxA and brachyury, and eve results in dramatic ectopic expression of reporter constructs in all or most domains of the embryo. This demonstrates that Tcf/groucho-mediated repression is required for spatial restriction of expression to the endoderm precursor cells (C. Theodoris, S. Ben-Tabou de-Leon, R.A. Cameron and E.H.D., unpublished results; Smith et al., 2008). It follows as well that all these genes respond to widespread and possibly globally distributed activators, as well as to Tcf/β-catenin.
Temporal differences in the initiation of expression of these Tcf target genes also indicate that different regulatory inputs are required for their expression. The eve gene is active in veg2 right after it is born at 6th cleavage (Ransick et al., 2002), while hox11/13b is active in these cells after the next cleavage (Arenas-Mena et al., 2006; Theodoris, 2009), and foxa shortly thereafter (Oliveri et al., 2006). The inference that these genes require different inputs in addition to Tcf is substantiated by explorations of their cis-regulatory systems, as will be reported in full elsewhere.
Regulatory interactions in the veg2 endoderm GRN
As discussed extensively (Davidson, 2006), our validated approach to constructing GRNs is generation of a system-wide model, by means of perturbation analysis, consisting of predicted direct inputs into the participant genes from the other genes of the system. This serves as a guide for cis-regulatory analyses that test the directness of the predicted inputs. The current endomesoderm GRN has been validated at many of its key nodes over the last several years, and where tested over 90% of predicted interactions have been verified. Embryos were injected with gene-specific morpholinos (MASOs), and changes in gene expression levels were analyzed by QPCR, or in indicated experiments, by NanoString. The set of analyzed genes included all genes encoding potential endoderm regulatory factors, as well as transcription factors expressed in other embryonic domains and a few differentiation genes. In addition, since Delta/Notch signaling occurs in at least a subset of veg2 descendants, it might affect the expression of endodermal regulatory genes as well, and this was analyzed by injection of notch MASOs. Even though gataE is expressed exclusively in mesoderm precursor cells at hatched blastula stage, it is a component of the endoderm GRN at later stages and therefore was included in the perturbation analysis. The complete data set can be found in Fig. S2, while an extract of these data relevant to the revised endoderm regulatory network are shown in Fig. 5.
Fig. 5.

Perturbation analysis of regulatory factors expressed in veg2-derived cells. (A) Changes in expression levels induced by the perturbation of predicted regulatory inputs are shown for transcription factors expressed in veg2-derived cells. Embryos were injected with indicated gene-specific MASOs (dark grey) or control MASOs (white) and gene expression levels were determined by QPCR at 18 hpf. The averaged results of 2–3 independent experiments are shown as fold difference in expression levels in injected relative to uninjected embryos. For sequences of MASOs see Table S2 and for criteria of significance see Materials and methods. (B) Expression of brachyury detected by WMISH in hatched blastula stage (18 hpf) embryos injected with control MASO or hox11/13b MASO. Levels of brachyury are strongly reduced upon perturbation of hox11/13b expression. (C) Portion of the veg2 regulatory network containing newly identified regulatory linkages. Colored linkages correspond to perturbation experiments shown in A) and/or emerge from recent cis-regulatory analyses, as mentioned in the text.
The resulting model includes many interactions that have been investigated earlier (Fig. S2), and the following concerns only our new observations, revisions of linkages proposed earlier, and new insights. A major addition concerns the prominent role of hox11/13b in the endoderm GRN. As noted above this gene is an early participant in formation of the veg2 regulatory state. Fig. 5A shows that expression of brachyury is strongly reduced in the presence of hox11/13b MASO. However, when analyzed by WMISH, brachyury expression, though very weak, remains spatially correct in the absence of hox11/13b expression (Fig. 5B). Though the spatial expression of brachyury is clearly regulated by Tcf (R.A. Cameron and E.H.D., unpublished cis-regulatory studies), this result predicts that the brachyury gene requires an additional activating input from Hox11/13b. Injection of hox11/13b MASO also reduced the levels of blimp1b expression at hatched blastula stage, and possibly of foxA, predicted inputs which are now targets for cis-regulatory validation (Fig. 5A). However, our perturbation evidence did not support the hypothesis (Smith et al., 2008) that hox11/13b is itself a target of Blimp1b regulation, and recent cis-regulatory investigation of the hox11/13b gene (J. Smith and C. Theodoris, unpublished results) confirms that this linkage does not exist. Since hox11/13b is one of the earliest regulatory genes expressed in the veg2 lineage, activated at 9 hpf, it might have a different regulatory function at earlier stages. Gene expression levels in embryos injected with hox11/13b MASO were therefore analyzed at 12 and 15 hpf by the NanoString counter system (Fig. S3). This approach allowed the simultaneous analysis of 180 selected genes, most of them encoding regulatory factors. However, in this whole set, no additional regulatory genes were affected by perturbation of hox11/13b expression. The only early effect of this MASO was to significantly depress brachyury expression by 15 hpf. Thus hox11/13b expression might be required for strong acceleration of brachyury expression. The expression of blimp1b and foxA on the other hand were not affected at stages before 18 hpf. hox11/13b expression itself was not affected by any of the nine regulatory factors tested.
Another key function in the early endoderm regulatory network is provided by the homeodomain transcription factor Otx. An earlier report showed that Otx directly regulates the expression of blimp1b (Smith et al., 2008). Recent results also indicate that Otx provides direct regulatory inputs into the cis-regulatory apparatus of both the foxA and brachyury genes (S. Ben-Tabou de-Leon, R.A. Cameron and E. H.D., unpublished results). The perturbation of Otx expression by morpholinos is complicated by the fact that otx is expressed in various splice isoforms (Li et al., 1997). The complexity of otx gene expression is probably even higher than previously recognized, since our current unpublished results indicate that otx-β1 and otx-β2 transcripts, which had been thought to share a common transcription start site, are regulated independently (unpublished results). A splice blocking MASO targeted to the homeodomain exon of the otx gene produced a weak decrease in foxA expression (Fig. 5A), not inconsistent with the cis-regulatory result noted above. The regulation of otx was earlier studied at the cis-regulatory level (Yuh et al., 2002; Yuh et al., 2004), and their data show that otx expression depends on Otx itself, GataE and Blimp1b, which are themselves encoded by Otx target genes. The expression of otx is therefore maintained by multiple positive feedback loops (Davidson et al., 2002b, b). Our current studies indicate an important additional layer of positive feedback regulation within this same subcircuit: perturbation of brachyury expression strongly depressed expression levels of otx–β transcripts (Fig. 5A). Though the perturbation matrix shown in Fig. S2 also shows a decrease in gatae transcripts in brachyury MASO, this is an expected indirect result of the depression of otx expression by brachyury MASO (Yuh et al., 2004), and is not to be considered a direct linkage.
The regulation of foxA and brachyury is fairly similar at these early stages. Both genes appear to be expressed under the control of Tcf, Hox11/13b and Otx, as mentioned above, and are also ultimately affected by GataE. The previously predicted Tcf, Otx, and GataE inputs into brachyury have already been confirmed in an unpublished cis-regulatory study, and the cis-regulatory construct responds to hox11/13b MASO as does the endogenous gene but the target sites are yet to be validated (R.A. Cameron and E.H.D., unpublished results). Fig. 5A shows a marginal effect of gatae MASO on brachyury expression, but since gatae expression is restricted to mesoderm precursor cells, such an interaction cannot occur in endoderm precursor cells by the stage with which we are here concerned. Injection of a brachyury MASO did not affect the expression levels of foxA at 18 hpf. Functional Brachyury binding sites have been identified in a foxA cis-regulatory module and mutation of these sites affected the activity of the module in endoderm precursor cells only after the stages considered here (S. Ben-Tabou de-Leon and E.H.D., unpublished results). Other new linkages suggested by these data indicate that the expression of myc is mostly a function of regulatory inputs provided by GataE and Otx, even though both inputs were fairly weak.
Since the endoderm GRN is also active in cells exposed to Delta/Notch signaling inputs, this signaling system could in principle affect early endoderm specification. QPCR analysis of gene expression levels in notch MASO-injected embryos however showed no changes in gene expression levels, with the exception of regulatory genes expressed in mesoderm precursors, i.e., gcm and gataE (Fig. S2). A 2-fold decrease in the expression levels of krl/z13 was however observed by NanoString Counter analysis in embryos injected with notch MASO or delta MASO (S. Materna and E.H.D., unpublished results). Other MASOs with no effect on endoderm-specific regulatory gene expression targeted the expression of foxA, myc, krl/z13 and soxC. Transcripts of myc and foxA attain functional levels after ~15 hpf and their regulatory functions are more likely to occur at later stages. The only regulatory function of soxC up to this time point is auto-repression. Blocking translation of krl/z13 transcripts did not show any change in endoderm regulatory gene expression as also shown earlier (C. Livi and E.H.D., unpublished results). A recent report shows that krl/z13 MASO produces late phenotypes which affect both endodermal and mesodermal development (Howard et al., 2001; Yamazaki et al., 2008).
Prelude to the Veg1 endoderm GRN
One regulatory gene appears to have acquired a function entirely different from the other genes in the early endoderm regulatory network. The eve gene was initially identified as a potential target of Tcf/β-catenin (Ransick et al., 2002). No other regulatory factor in the endoderm GRN (other than Tcf) has been found to affect the expression of eve, which is consistent with the fact that eve comes to be expressed in a different spatial domain, veg1, from the other genes considered here (Fig. 2). The non-overlap of these expression domains conflicts with an earlier conclusion that Blimp1 activates eve (Smith et al., 2008). Similarly, our current perturbation experiments show that blimp1 MASO has no effect at all on eve transcript levels (Fig. S2), in the same embryos in which it produces the expected (Smith et al., 2007) up-regulation of blimp1 expression. A probable explanation for the mutational result that led to the conclusion of a Blimp1 input into eve is that this mutation also affected function of an immediately adjacent and essential Tcf site. This linkage has been dropped from the GRN. The only perturbation resulting in a change of eve expression levels was injection of eve MASO itself. Interfering with eve expression led to a strong increase in eve transcript levels, as shown in Fig. 6A. This result indicates that eve is controlled by auto-repression. Since eve is expressed in all endomesoderm cell lineages at earlier stages, auto-repression could in principle occur in any of the vegetal cells. When eve expression was analyzed by WMISH on embryos injected with eve MASO, stronger than normal expression of eve transcripts was detected in a higher number of cells than express eve in control MASO injected embryos. This is seen from the side in Fig. 6B, and from the vegetal pole in Fig. 7, where it can be observed that eve transcripts are present in two-three rows of cells in embryos bearing eve MASO vs. a single row in embryos bearing the control MASO. The MASO driven increase in eve expression levels apparently occurs in cells deriving from both veg2 and veg1 lineages. It follows that in normal embryos eve auto-repression is required to clear eve expression from veg2 cells, despite the presence of levels of Tcf/β-catenin sufficient to support expression of the veg2 endoderm genes.
Fig. 6.

Regulatory role of eve. (A) eve expression levels in embryos injected with eve MASO (dark grey) or control MASO (white) were analyzed by QPCR (18 hpf) or the N counter system (12 hpf, 15 hpf) and compared to expression levels in uninjected embryos. Perturbation of eve expression results in increased eve expression levels at all time points examined. (B) WMISH detecting eve gene expression in eve MASO-injected embryos and control MASO-injected embryos at blastula stage (15 hpf). Perturbation of eve expression results in a strong increase of eve expression levels in veg2- and veg1-derived cells. (C) Transcript levels in embryos injected with eve MASO or Control MASO were analyzed by the NanaoString counter system at 15 hpf and compared to expression levels in uninjected control embryos. Non-reproducible variability of expression levels is usually observed for very low abundance transcripts and results are shown for transcripts present at >100 counts (approximately 50 molecules/embryo, S. Materna and E.H.D., unpublished results). Data points for genes in the endomesoderm GRN affected >2-fold are indicated with gene name. Additional results are shown in Fig. S3. The only gene in this code set repeatedly affected by eve MASO was eve itself.
Fig. 7.

Spatial expression of regulatory genes upon perturbation of hox11/13b or eve. Embryos injected with Control MASO, hox11/13b MASO or eve MASO were fixed at hatched blastula stage (18 hpf) and analyzed by WMISH. Injection of hox11/13b MASO resulted in reduced levels of gene expression for foxA and blimp1b and increased the levels for hox11/13b gene expression. The spatial distribution of these genes was not affected. Conversely, levels of eve were not changed by perturbation of hox11/13b, but the expression domain of eve was shifted towards the vegetal pole. Injection of eve MASO had no effect on levels or spatial distribution of regulatory factors expressed in veg2-derived cells, but resulted in a strong increase of eve expression levels in cells which do not express eve in corresponding control embryos. All embryos are shown from vegetal view.
Just as eve expression is not determined by the other genes of the endoderm GRN at 18 hpf, eve MASO does not affect any other gene analyzed here, other than itself (Fig. S2). But because eve is expressed earlier than any other of the future endoderm specific genes, it could have contributed to the initiation of the veg2 endoderm GRN. To examine this possibility, embryos bearing eve MASO were analyzed at 12 and 15 hpf using the Nanostring counter system. But again no other regulatory genes were affected by this perturbation besides eve itself, which was strongly up-regulated even at these early times (Fig. S3).
These results indicate unique functions for both hox11/13b and eve in endoderm specification. hox11/13b is a driver of many regulatory genes in the veg2 domain, and eve is the only representative of the endoderm network expressed in veg1 derived cells at the stages considered here. Furthermore, additional regulatory interactions mediated by these genes and required for the spatially correct expression of target genes could have escaped detection by quantitative approaches, if the experimental perturbations did not affect gross transcript levels. Expression patterns for foxA, blimp1b, hox11/13b and eve were therefore analyzed by WMISH in the presence of either hox11/13b MASO or eve MASO (Fig. 7). In embryos injected with hox11/13b MASO, no change of spatial distribution was observed for blimp1b, foxA and hox11/13b, even though changes in expression levels were apparent when compared to embryos bearing control MASO. Hox11/13b, however, turns out to be required for spatially correct eve expression. In the presence of hox11/13b MASO, eve transcripts were observed in cells closer to the vegetal pole, i.e., veg2 descendants, even though overall expression levels were not affected. Canonical Hox binding sites within the eve cis-regulatory apparatus had previously been shown to be required for repression of eve in veg2-derived cells (Smith et al., 2008), and the present data confirm that the responsible factor is indeed Hox11/13b. Injection of eve MASO did not change the spatial distribution of any regulatory gene transcripts besides itself.
Discussion
Discrimination of endoderm and mesoderm precursor cells in the veg2 lineage
Endoderm and mesoderm cell types share a common cell lineage ancestry in bilaterian animals and sea urchins are no exception. Thus, endomesoderm precursor cells initially have the potential to develop as endoderm or mesoderm cells, and cell fates become spatially separated by the exclusive activation of respective specification programs in subsets of cells. In sea urchin embryos, this complete spatial separation occurs after hatched blastula stage as a consequence of the regulatory interactions described here. Our current evidence indicates that the regulatory network underlying endoderm specification is active in all cells of the veg2 lineage before hatched blastula stage. Additional results to be presented in a following communication show that shortly after this stage, endoderm transcription factors become restricted to endoderm precursor cells and are no longer expressed in mesoderm precursor cells. Mesoderm specification, on the other hand, is dependent on the Delta/Notch signaling system and becomes activated only in cells in immediate contact with the ligand expressing micromere-derived cells. Delta/Notch signaling thus occurs in all veg2 cells at 7th cleavage stage, when all 16 cells of this lineage are in direct contact with micromeres. After the next cleavage the 32 veg2 cells become arranged in two rings of 16 cells each, the outer of which is now physically separated from the skeletogenic micromere lineage. By this stage, the expression of gcm, a direct target gene of Notch/SuH (Ransick and Davidson, 2006), fades out in cells not adjacent to the micromeres, becoming restricted to the inner tier of veg2 derived cells. This can be seen clearly in Fig. 3. gcm is one of the key regulatory genes required for mesoderm specification. These mesoderm precursor cells therefore initially co-express regulatory factors which at a later stage are part of either endoderm or mesoderm regulatory networks. The definitive endoderm precursor cells on the other hand exclusively express transcription factors involved in endoderm specification from early stages on.
Even though endomesoderm precursor cells co-express transcription factors required for endoderm and mesoderm specification, there initially seems to be little regulatory interaction between the two GRNs (i.e., prior to 18 hpf). None of the regulatory factors in the endoderm GRN affected mesodermal regulatory gene expression (see for example the Nanostring experiments that include all known regulatory genes active before 36h; Fig S3; gcm, hesC, elk, gatac were all tested by QPCR). In a strict sense, early endomesoderm specification therefore involves the concomitant activation of two separate GRNs, rather than the activation of a common endomesoderm GRN which diverges into two daughter programs. The co-expression of regulatory genes to which we refer to as endomesoderm regulatory state is the result of these two GRNs. Different activating inputs plus reciprocal repression in the later blastula stages lead to a complete separation of the two programs. In our case, the dependence of the mesoderm GRN on Delta/Notch signaling inputs and the absence of Delta/Notch signaling in endoderm precursor cells together explain the absence of mesoderm-specific gene expression in endoderm precursor cells. This would also explain why none of the transcription factors in the endoderm GRN mediates repression of gcm at hatched blastula stage. At gastrula stages however, foxa expression is required to exclude the pigment specification program by repressing gcm (Oliveri et al., 2006).
The GRN in veg2 endoderm precursor cells
As summarized in the GRN model in Fig. 8, many regulatory genes in the endoderm GRN are under control of Tcf. This mode of control restricts the activation of the endoderm GRN to cells with significant levels of nuclear β-catenin. At 7th cleavage, when the first regulatory factors start to be expressed in the veg2 lineage, levels of nuclear β–catenin are high in micromere and veg2 descendants and are low or not detectable in veg1 derived cells (Logan et al., 1999). The initial accumulation of nuclear β-catenin in veg2 derived cells is a direct consequence of maternal cues and is independent of micromere derived signals. Embryos in which micromeres have been removed still show β-catenin nuclearization in the veg2 lineage (Logan et al., 1999). However, the levels of nuclear β-catenin are probably further increased by the expression of wnt8 first in micromere and later also in veg2 descendants (Smith et al., 2007). Even though not necessary for the initial nuclearization of β-catenin in vegetal plate cells, Wnt8 is sufficient to induce endoderm formation in ectopic locations (Wikramanayake et al., 2004). Wnt8 expression is regulated by a positive feedback subcircuit, being itself driven by Tcf/β-catenin (Minokawa et al., 2005; Smith et al., 2007). The outcome of this regulatory architecture is referred to as a community effect, enhancing the levels of Tcf/β-catenin and in consequence also of its target gene transcripts in all cells expressing the signaling ligand (Bolouri and Davidson, 2009). This constellation contributes to the activation of the endoderm GRN in the entire veg2 lineage. Another very important early coordinator of the initial endoderm GRN is hox11/13b, as this study makes clear. For one thing hox11/13b is the first of the veg2 endoderm genes to be activated there (Arenas-Mena et al., 2006): it is upstream temporally as well as logically of the other genes that we show here utilize hox11/13b inputs (Fig. 8). Earlier than this, hox11/13b is expressed in the skeletogenic micromere lineage but only very transiently, which might explain why the endoderm GRN is not activated in the skeletogenic cells.
Fig. 8.

The endoderm GRN up to mid-blastula stage. Regulatory genes expressed in veg2-derived endoderm and mesoderm precursor cells are shown in green, whereas regulatory genes turned on exclusively in mesoderm precursor cells are shown in blue boxes. Regulatory interactions between transcription factors within their domain of expression are shown as activating arrows or repressing bars. This model summarizes all regulatory interactions in the endoderm GRN up to 18 hpf, including the new and revised linkages discussed in text. For individual time points and current updates please visit http://sugp.caltech.edu/endomes/.
One node within the early endoderm GRN is controlled by multiple layers of positive feedback regulation, as shown in Fig. 8. This positive feedback subcircuit will function to stabilize the regulatory state. Otx is activated by its own gene product as well as the products of its target genes blimp1b and brachyury. These genes are part of a subcircuit which has been referred to as endoderm kernel, since its activation is essential for endoderm development and because its architecture is highly conserved even in the distantly related starfish Asterina miniata (Davidson et al., 2002a; Hinman et al., 2003; Yuh et al., 2004; Hinman and Davidson, 2007; Hinman et al., 2007). Another component of the endoderm kernel is foxA, which is also expressed under the control of Otx, as shown by cis-regulatory analysis and perturbation (S. Ben-Tabou de Leon and E.H.D., unpublished results and Fig. 5A). The fact that gataE is also linked into this subcircuit (e.g., Fig. 5A, C), even though its expression is restricted to mesoderm precursor cells at hatched blastula stage might be the result of the static genomic coding of GRNs. gataE expression is turned on in endoderm precursor cells by mesenchyme blastula stage (24 hpf) and thereafter contributes to the stabilization of the endoderm regulatory state by activating otx-β expression.
Regulatory activity in Veg1 endoderm precursor cells
Of all the endoderm regulatory genes analyzed here, eve is the only one expressed in the veg1 lineage at early blastula stages. Its expression there is controlled by a combination of Tcf/β-catenin activation, Hox11/13b and Eve itself. The proposed regulatory logic is that Tcf/β-catenin is a potent inducer of eve expression, and also excludes eve expression outside the vegetal plate, whereas levels of eve transcripts are kept low by auto-repression. Exclusion of eve expression from the veg2 lineage is ultimately achieved by Hox11/13b, as shown here and elsewhere (Smith et al., 2008). Even though eve expression is detected for a short time period in veg2 descendants, it does not exert any regulatory functions in the veg2 endoderm GRN (Fig. 6). In fact, we could not detect any regulatory function for eve up to 18 hpf besides controlling its own expression levels. The earliest effect of eve on the expression of other regulatory genes was observed at mesenchyme blastula stage, as will be reported elsewhere. Eve is thus expressed in the veg1 lineage for almost 10 h before it starts to function as a transcriptional regulator of other endoderm regulatory genes. These results also show that the endoderm GRN active in veg1 descendants is not identical to the GRN active in veg2-derived cells. At least one of the initial inputs into the veg1 endoderm GRN is exclusively used in this lineage. We see here the initial regulatory events underlying the distinct morphological fates of the descendants of these two lineages in the construction of the archenteron.
Supplementary Material
Acknowledgments
We would like to thank Jina Yun for invaluable technical assistance, and Yi Fan and Eric Erkenbrack for their help with in situ hybridizations. We are also very pleased to acknowledge Smadar Ben-Tabou de Leon and R. Andrew Cameron for providing unpublished cis-regulatory data cited in text. The Blimp1 to hesC link in the new GRN in Fig. 9 is from Smith & Davidson, 2008. This research was supported by the National Institutes of Health grant HD-37105 and by a fellowship of the Swiss National Science Foundation to I.S.P.
Appendix A. Supplementary data
Supplementary data associated with this article can be found, in the online version, at doi:10.1016/j.ydbio.2009.10.037.
Footnotes
This article was accepted in 2009 to celebrate the 50th anniversary of Developmental Biology.
References
- Arenas-Mena C, Cameron RA, Davidson EH. Hindgut specification and cell-adhesion functions of Sphox11/13b in the endoderm of the sea urchin embryo. Dev Growth Differ. 2006;48:463–472. doi: 10.1111/j.1440-169X.2006.00883.x. [DOI] [PubMed] [Google Scholar]
- Beane WS, Gross JM, McClay DR. RhoA regulates initiation of invagination, but not convergent extension, during sea urchin gastrulation. Dev Biol. 2006;292:213–225. doi: 10.1016/j.ydbio.2005.12.031. [DOI] [PubMed] [Google Scholar]
- Bolouri H, Davidson EH. The gene regulatory network basis of the “community effect,” and analysis of a sea urchin embryo example. Dev Biol. 2009 doi: 10.1016/j.ydbio.2009.06.007. this issue. [DOI] [PMC free article] [PubMed] [Google Scholar]
- Cameron RA, Fraser SE, Britten RJ, Davidson EH. Macromere cell fates during sea urchin development. Development. 1991;113:1085–1091. doi: 10.1242/dev.113.4.1085. [DOI] [PubMed] [Google Scholar]
- Davidson EH. The Regulatory Genome. Gene Regulatory Networks in Development and Evolution. Academic Press/Elsevier; San Diego, CA: 2006. [Google Scholar]
- Davidson EH, Rast JP, Oliveri P, Ransick A, Calestani C, et al. A genomic regulatory network for development. Science. 2002a;295:1669–1678. doi: 10.1126/science.1069883. [DOI] [PubMed] [Google Scholar]
- Davidson EH, Rast JP, Oliveri P, Ransick A, Calestani C, et al. A provisional regulatory gene network for specification of endomesoderm in the sea urchin embryo. Dev Biol. 2002b;246:162–190. doi: 10.1006/dbio.2002.0635. [DOI] [PubMed] [Google Scholar]
- Geiss GK, Bumgarner RE, Birditt B, Dahl T, Dowidar N, et al. Direct multiplexed measurement of gene expression with color-coded probe pairs. Nat Biotechnol. 2008;26:317–325. doi: 10.1038/nbt1385. [DOI] [PubMed] [Google Scholar]
- Hinman VF, Davidson EH. Evolutionary plasticity of developmental gene regulatory network architecture. Proc Natl Acad Sci U S A. 2007;104:19404–19409. doi: 10.1073/pnas.0709994104. [DOI] [PMC free article] [PubMed] [Google Scholar]
- Hinman VF, Nguyen AT, Cameron RA, Davidson EH. Developmental gene regulatory network architecture across 500 million years of echinoderm evolution. Proc Natl Acad Sci U S A. 2003;100:13356–13361. doi: 10.1073/pnas.2235868100. [DOI] [PMC free article] [PubMed] [Google Scholar]
- Hinman VF, Nguyen A, Davidson EH. Caught in the evolutionary act: precise cis-regulatory basis of difference in the organization of gene networks of sea stars and sea urchins. Dev Biol. 2007;312:584–595. doi: 10.1016/j.ydbio.2007.09.006. [DOI] [PubMed] [Google Scholar]
- Hoerstadius S. The mechanics of sea urchin development studied by operative methods. Biol Rev Camb Philos Soc. 1939;14:132–179. [Google Scholar]
- Howard-Ashby M, Materna SC, Brown CT, Chen L, Cameron RA, et al. Gene families encoding transcription factors expressed in early development of Strongylocentrotus purpuratus. Dev Biol. 2006a;300:90–107. doi: 10.1016/j.ydbio.2006.08.033. [DOI] [PubMed] [Google Scholar]
- Howard-Ashby M, Materna SC, Brown CT, Chen L, Cameron RA, et al. Identification and characterization of homeobox transcription factor genes in Strongylocentrotus purpuratus, and their expression in embryonic development. Dev Biol. 2006b;300:74–89. doi: 10.1016/j.ydbio.2006.08.039. [DOI] [PubMed] [Google Scholar]
- Howard-Ashby M, Materna SC, Brown CT, Tu Q, Oliveri P, et al. High regulatory gene use in sea urchin embryogenesis: implications for bilaterian development and evolution. Dev Biol. 2006c;300:27–34. doi: 10.1016/j.ydbio.2006.10.016. [DOI] [PMC free article] [PubMed] [Google Scholar]
- Howard EW, Newman LA, Oleksyn DW, Angerer RC, Angerer LM. SpKrl: a direct target of beta-catenin regulation required for endoderm differentiation in sea urchin embryos. Development. 2001;128:365–375. doi: 10.1242/dev.128.3.365. [DOI] [PubMed] [Google Scholar]
- Li X, Chuang CK, Mao CA, Angerer LM, Klein WH. Two Otx proteins generated from multiple transcripts of a single gene in Strongylocentrotus purpuratus. Dev Biol. 1997;187:253–266. doi: 10.1006/dbio.1997.8610. [DOI] [PubMed] [Google Scholar]
- Logan CY, McClay DR. The allocation of early blastomeres to the ectoderm and endoderm is variable in the sea urchin embryo. Development. 1997;124:2213–2223. doi: 10.1242/dev.124.11.2213. [DOI] [PubMed] [Google Scholar]
- Logan CY, Miller JR, Ferkowicz MJ, McClay DR. Nuclear beta-catenin is required to specify vegetal cell fates in the sea urchin embryo. Development. 1999;126:345–357. doi: 10.1242/dev.126.2.345. [DOI] [PubMed] [Google Scholar]
- Materna SC, Oliveri P. A protocol for unraveling gene regulatory networks. Nat Protoc. 2008;3:1876–1887. doi: 10.1038/nprot.2008.187. [DOI] [PubMed] [Google Scholar]
- Materna SC, Howard-Ashby M, Gray RF, Davidson EH. The C2H2 zinc finger genes of Strongylocentrotus purpuratus and their expression in embryonic development. Dev Biol. 2006;300:108–120. doi: 10.1016/j.ydbio.2006.08.032. [DOI] [PubMed] [Google Scholar]
- Minokawa T, Wikramanayake AH, Davidson EH. cis-Regulatory inputs of the wnt8 gene in the sea urchin endomesoderm network. Dev Biol. 2005;288:545–558. doi: 10.1016/j.ydbio.2005.09.047. [DOI] [PubMed] [Google Scholar]
- Nemer M, Rondinelli E, Infante D, Infante AA. Polyubiquitin RNA characteristics and conditional induction in sea urchin embryos. Dev Biol. 1991;145:255–265. doi: 10.1016/0012-1606(91)90124-l. [DOI] [PubMed] [Google Scholar]
- Oliveri P, Davidson EH, McClay DR. Activation of pmar1 controls specification of micromeres in the sea urchin embryo. Dev Biol. 2003;258:32–43. doi: 10.1016/s0012-1606(03)00108-8. [DOI] [PubMed] [Google Scholar]
- Oliveri P, Walton KD, Davidson EH, McClay DR. Repression of mesodermal fate by foxa, a key endoderm regulator of the sea urchin embryo. Development. 2006;133:4173–4181. doi: 10.1242/dev.02577. [DOI] [PubMed] [Google Scholar]
- Oliveri P, Tu Q, Davidson EH. Global regulatory logic for specification of an embryonic cell lineage. Proc Natl Acad Sci U S A. 2008;105:5955–5962. doi: 10.1073/pnas.0711220105. [DOI] [PMC free article] [PubMed] [Google Scholar]
- Pehrson JR, Cohen LH. The fate of the small micromeres in sea urchin development. Dev Biol. 1986;113:522–526. doi: 10.1016/0012-1606(86)90188-0. [DOI] [PubMed] [Google Scholar]
- Range RC, Venuti JM, McClay DR. LvGroucho and nuclear beta-catenin functionally compete for Tcf binding to influence activation of the endomesoderm gene regulatory network in the sea urchin embryo. Dev Biol. 2005;279:252–267. doi: 10.1016/j.ydbio.2004.12.023. [DOI] [PubMed] [Google Scholar]
- Ransick A, Davidson EH. A complete second gut induced by transplanted micromeres in the sea urchin embryo. Science. 1993;259:1134–1138. doi: 10.1126/science.8438164. [DOI] [PubMed] [Google Scholar]
- Ransick A, Davidson EH. Micromeres are required for normal vegetal plate specification in sea urchin embryos. Development. 1995;121:3215–3222. doi: 10.1242/dev.121.10.3215. [DOI] [PubMed] [Google Scholar]
- Ransick A, Davidson EH. Late specification of Veg1 lineages to endodermal fate in the sea urchin embryo. Dev Biol. 1998;195:38–48. doi: 10.1006/dbio.1997.8814. [DOI] [PubMed] [Google Scholar]
- Ransick A, Davidson EH. cis-regulatory processing of Notch signaling input to the sea urchin glial cells missing gene during mesoderm specification. Dev Biol. 2006;297:587–602. doi: 10.1016/j.ydbio.2006.05.037. [DOI] [PubMed] [Google Scholar]
- Ransick A, Rast JP, Minokawa T, Calestani C, Davidson EH. New early zygotic regulators expressed in endomesoderm of sea urchin embryos discovered by differential array hybridization. Dev Biol. 2002;246:132–147. doi: 10.1006/dbio.2002.0607. [DOI] [PubMed] [Google Scholar]
- Rast JP, Amore G, Calestani C, Livi CB, Ransick A, et al. Recovery of developmentally defined gene sets from high-density cDNA macroarrays. Dev Biol. 2000;228:270–286. doi: 10.1006/dbio.2000.9941. [DOI] [PubMed] [Google Scholar]
- Revilla-i-Domingo R, Oliveri P, Davidson EH. A missing link in the sea urchin embryo gene regulatory network: hesC and the double-negative specification of micromeres. Proc Natl Acad Sci U S A. 2007;104:12383–12388. doi: 10.1073/pnas.0705324104. [DOI] [PMC free article] [PubMed] [Google Scholar]
- Rizzo F, Fernandez-Serra M, Squarzoni P, Archimandritis A, Arnone MI. Identification and developmental expression of the ets gene family in the sea urchin (Strongylocentrotus purpuratus) Dev Biol. 2006;300:35–48. doi: 10.1016/j.ydbio.2006.08.012. [DOI] [PubMed] [Google Scholar]
- Sethi AJ, Angerer RC, Angerer LM. Gene regulatory network interactions in sea urchin endomesoderm induction. PLoS Biol. 2009;7:e1000029. doi: 10.1371/journal.pbio.1000029. [DOI] [PMC free article] [PubMed] [Google Scholar]
- Sherwood DR, McClay DR. LvNotch signaling mediates secondary mesenchyme specification in the sea urchin embryo. Development. 1999;126:1703–1713. doi: 10.1242/dev.126.8.1703. [DOI] [PubMed] [Google Scholar]
- Smith J, Theodoris C, Davidson EH. A gene regulatory network subcircuit drives a dynamic pattern of gene expression. Science. 2007;318:794–797. doi: 10.1126/science.1146524. [DOI] [PubMed] [Google Scholar]
- Smith J, Kraemer E, Liu H, Theodoris C, Davidson E. A spatially dynamic cohort of regulatory genes in the endomesodermal gene network of the sea urchin embryo. Dev Biol. 2008;313:863–875. doi: 10.1016/j.ydbio.2007.10.042. [DOI] [PMC free article] [PubMed] [Google Scholar]
- Sodergren E, Weinstock GM, Davidson EH, Cameron RA, Gibbs RA, et al. The genome of the sea urchin Strongylocentrotus purpuratus. Science. 2006;314:941–952. doi: 10.1126/science.1133609. [DOI] [PMC free article] [PubMed] [Google Scholar]
- Su YH, Li E, Geiss GK, Longabaugh WJ, Kramer A, et al. A perturbation model of the gene regulatory network for oral and aboral ectoderm specification in the sea urchin embryo. Dev Biol. 2009;329:410–421. doi: 10.1016/j.ydbio.2009.02.029. [DOI] [PMC free article] [PubMed] [Google Scholar]
- Sweet HC, Hodor PG, Ettensohn CA. The role of micromere signaling in Notch activation and mesoderm specification during sea urchin embryogenesis. Development. 1999;126:5255–5265. doi: 10.1242/dev.126.23.5255. [DOI] [PubMed] [Google Scholar]
- Sweet HC, Gehring M, Ettensohn CA. LvDelta is a mesoderm-inducing signal in the sea urchin embryo and can endow blastomeres with organizer-like properties. Development. 2002;129:1945–1955. doi: 10.1242/dev.129.8.1945. [DOI] [PubMed] [Google Scholar]
- Theodoris C. Caltech Honors Thesis. 2009. Determining the factors governing the expression of hox11/13b to understand its role in gut formation. [Google Scholar]
- Weitzel HE, Illies MR, Byrum CA, Xu R, Wikramanayake AH, et al. Differential stability of beta-catenin along the animal-vegetal axis of the sea urchin embryo mediated by dishevelled. Development. 2004;131:2947–2956. doi: 10.1242/dev.01152. [DOI] [PubMed] [Google Scholar]
- Wikramanayake AH, Peterson R, Chen J, Huang L, Bince JM, et al. Nuclear beta-catenin-dependent Wnt8 signaling in vegetal cells of the early sea urchin embryo regulates gastrulation and differentiation of endoderm and mesodermal cell lineages. Genesis. 2004;39:194–205. doi: 10.1002/gene.20045. [DOI] [PubMed] [Google Scholar]
- Yamazaki A, Kawabata R, Shiomi K, Tsuchimoto J, Kiyomoto M, et al. Kruppel-like is required for nonskeletogenic mesoderm specification in the sea urchin embryo. Dev Biol. 2008;314:433–442. doi: 10.1016/j.ydbio.2007.11.035. [DOI] [PubMed] [Google Scholar]
- Yuh CH, Brown CT, Livi CB, Rowen L, Clarke PJ, et al. Patchy interspecific sequence similarities efficiently identify positive cis-regulatory elements in the sea urchin. Dev Biol. 2002;246:148–161. doi: 10.1006/dbio.2002.0618. [DOI] [PubMed] [Google Scholar]
- Yuh CH, Dorman ER, Howard ML, Davidson EH. An otx cis-regulatory module: a key node in the sea urchin endomesoderm gene regulatory network. Dev Biol. 2004;269:536–551. doi: 10.1016/j.ydbio.2004.02.025. [DOI] [PubMed] [Google Scholar]
Associated Data
This section collects any data citations, data availability statements, or supplementary materials included in this article.